Liquid Metal Embrittlement
RSW Masterclass
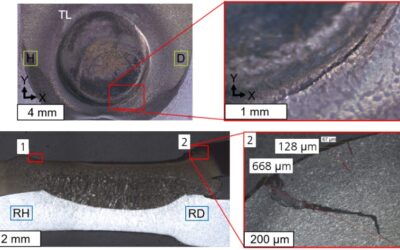
Four Steps to Mitigate Liquid Metal Embrittlement When Welding Steel
Liquid Metal Embrittlement (LME) during Resistance Spot Welding (RSW) can cause cracks when welding advanced high strength steels. Recent advances in steel metallurgy, resistance spot welding processing and accompanying simulation tools have substantially improved the...
Resistance Spot Welding with Advanced High-Strength Steels: Cold Stamped and Hot Formed
The discussions relative to cold stamping are applicable to any forming operation occurring at room temperature such as roll forming, hydroforming, or conventional stamping. Similarly, hot stamping refers to any set of operations using Press Hardening Steels (or Press...
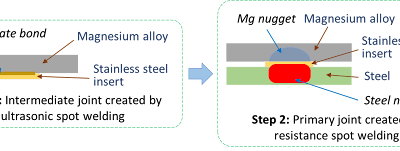
Resistance Spot Welding AHSS to Magnesium
This blog is a short summary of a published comprehensive research work titled: "Peculiar Roles of Nickel Diffusion in Intermetallic Compound Formation at the Dissimilar Metal Interface of Magnesium to Steel Spot Welds" Authored by Luke Walker, Carolin Fink,...
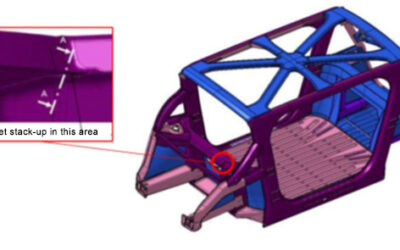
Resistance Spot Welding: 5T Dissimilar Steel Stack-ups for Automotive Applications
Urbanization and waning interest in vehicle ownership point to new transport opportunities in megacities around the world. Mobility as a Service (MaaS) – characterized by autonomous, ride-sharing-friendly EVs – can be the comfortable, economical, sustainable transport...

Resistance Spot Welding: 3T and 4T Dissimilar Steel Stack-ups for Automotive Applications
Car body-in-white (BIW) structures, such as pillars and rails, are increasingly made of complex stack-ups of advanced high-strength steels (AHSS) for vehicle lightweighting to achieve improved fuel efficiency and crashworthiness. Complex stack-ups comprise more than...

Process, Microstructure and Fracture Mode of Thick Stack-Ups of Aluminum Alloy to AHSS Dissimilar Spot Joints
This article summarizes a paper entitled, "Process, Microstructure and Fracture Mode of Thick Stack-Ups of Aluminum Alloy to AHSS Dissimilar Metal Spot Joints", by Luke Walker, Colleen Hilla, Menachem Kimchi, and Wei Zhang, Department of Materials Science and...
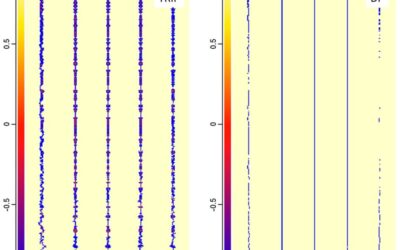
Hot cracking investigation in HSS laser welding with multi-scale modelling approach
This article summarizes the findings of a paper entitled, “Hot cracking investigation during laser welding of high-strength steels with multi-scale modelling approach”, by H. Gao, G. Agarwal, M. Amirthalingam, M. J. M. Hermans.G-4 Researchers at Delft University of...