This blog is a short summary of a published comprehensive research work titled: "Peculiar Roles of Nickel Diffusion in Intermetallic Compound Formation at the Dissimilar Metal Interface of Magnesium to Steel Spot Welds" Authored by Luke Walker, Carolin Fink,...
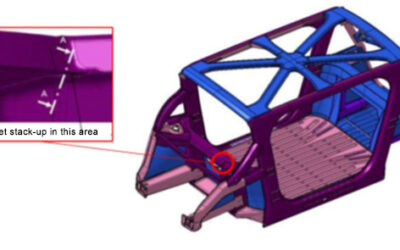
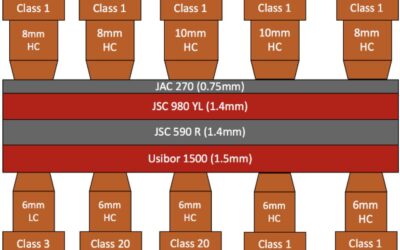
Resistance Spot Welding AHSS to Magnesium
read more