During a tensile test, the elongating sample leads to a reduction in the cross-sectional width and thickness. The shape of the engineering stress-strain curve showing a peak at the load maximum (Figure 1) results from the balance of the work hardening which occurs as metals deform and the reduction in cross-sectional width and thickness which occurs as the sample dogbone is pulled in tension. In the upward sloping region at the beginning of the curve, the effects of work hardening dominate over the cross-sectional reduction. Starting at the load maximum (ultimate tensile strength), the reduction in cross-sectional area of the test sample overpowers the work hardening and the slope of the engineering stress-strain curve decreases. Also beginning at the load maximum, a diffuse neck forms usually in the middle of the sample.

Figure 1: Engineering stress-strain curve from which mechanical properties are derived.
The elongation at which the load maximum occurs is known as Uniform Elongation. In a tensile test, uniform elongation is the percentage the gauge length elongated at peak load relative to the initial gauge length. For example, if the gauge length at peak load measures 61 mm and the initial gauge length was 50mm, uniform elongation is (61-50)/50 = 22%.
Schematics of tensile bar shapes are shown within Figure 1. Note the gauge region highlighted in blue. Up though uniform elongation, the cross-section has a rectangular shape. Necking begins at uniform elongation, and the cross section is no longer rectangular.
Theory and experiments have shown that uniform elongation expressed in true strain units is numerically equivalent to the instantaneous n-value.
Deformation Prior to Uniform Elongation is Not Uniformly Distributed
Conventional wisdom for decades held that there is a uniform distribution of strains within the gauge region of a tensile bar prior to strains reaching uniform elongation. Traditional extensometers calibrated for 50-mm or 80-mm gauge lengths determine elongation from deformation measured relative to this initial length. This approach averages results over these spans.
The advent of Digital Image Correlation (DIC) and advanced processing techniques allowed for a closer look. A studyS-113 released in 2021 clearly showed that each of the 201 data points monitored within a 50 mm gauge length (virtual gauge length of 0.5-mm) experiences a unique strain evolution, with differences starting before uniform elongation.
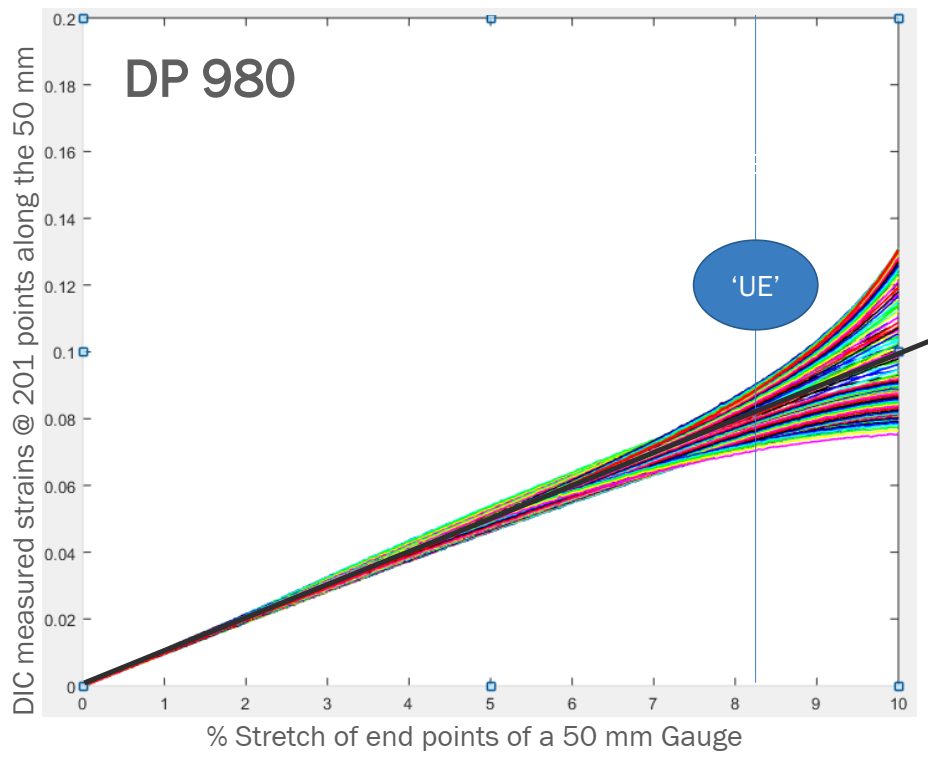
Figure 2: Strain evolution of the 201 points on the DP980 tensile-test specimen exhibits divergence beginning before uniform elongation—counter to conventional thinking.S-113