This article summarizes a paper entitled, “RSW of 22MnB5 at Overlaps with Gaps-Effects, Causes, and Countermeasures”, by J. Kaars, et al.K-12
This study aims to elaborate on the influencing mechanisms of gaps on the welding result. Welding experiments at artificial gaps and finite element analysis (FEA) of the welding process have been used to investigate the matter. In both methods, the same configuration of two 1.5-mm-thick 22MnB5+AS150 welded with electrodes of the type ISO 5821 B0-16-20-40-6-30 was considered. Tensile tests yielded an ultimate tensile strength (UTS) of the press-hardened material of 1481 ± 53 MPa with a strain to fracture of 7.5 ± 0.26%. A microsection of the coating morphology after heat treatment can be found in Figure 1.
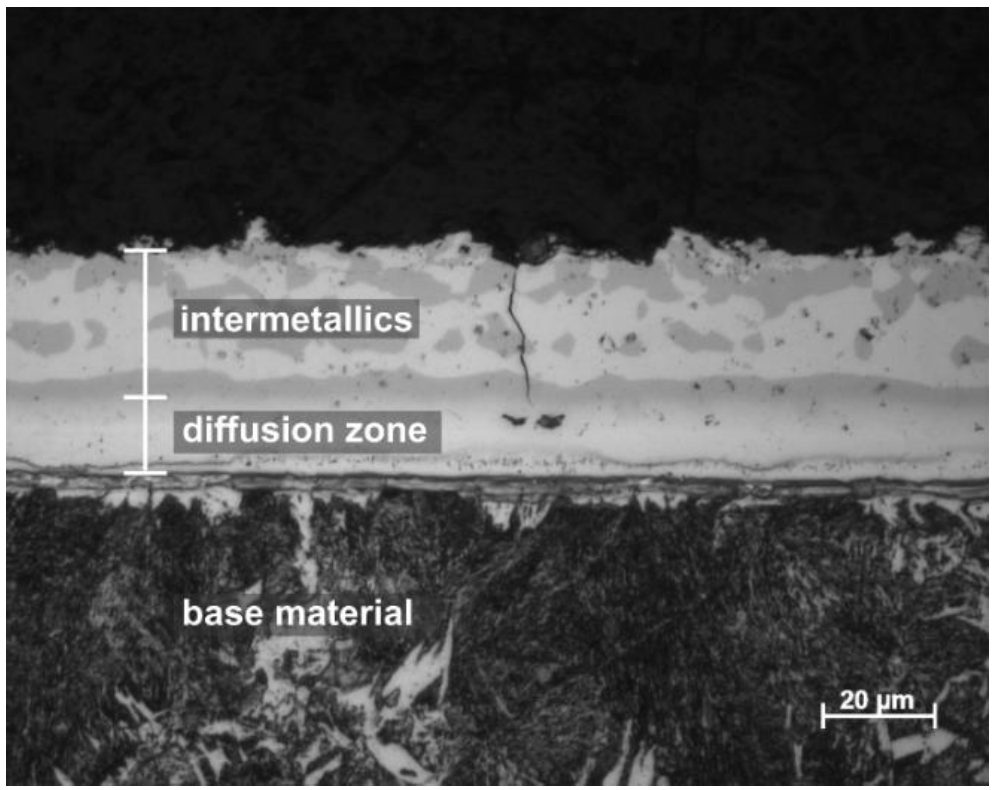
Figure 1: Morphology of the Aluminum-Silicon Coating.K-12
To set up an artificial and reproducible gap between the sheets, a dedicated fixture was used. It is displayed in Figure 2. All welding experiments were carried out with a 6-kN electrode force.
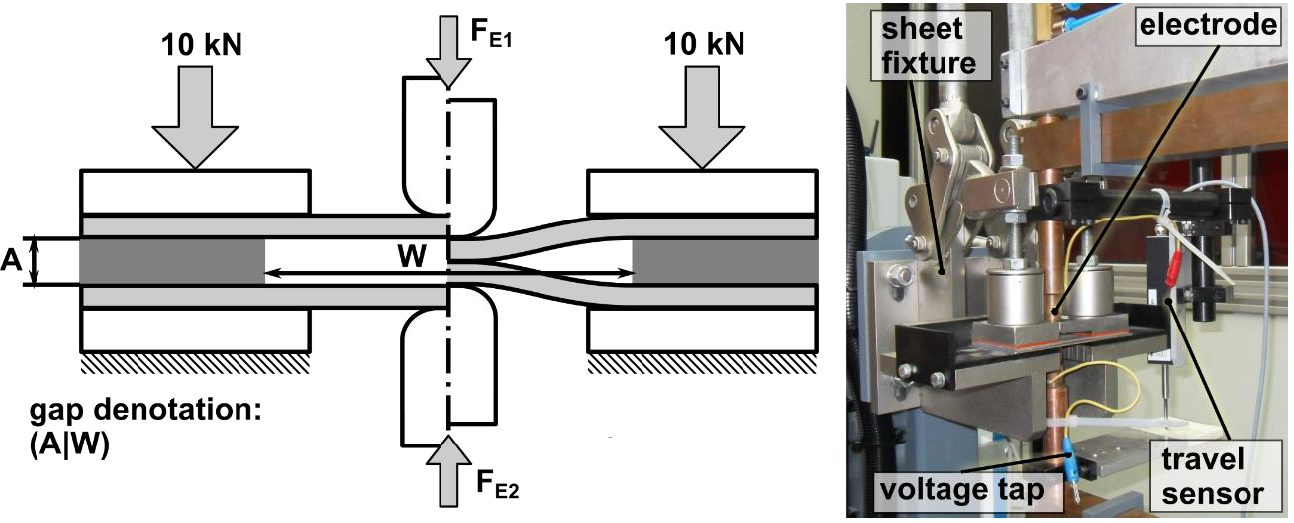
Figure 2: Fixture for Welding at Artificial Gaps, Definition of Quantities.K-12
In Table 1, the parameter variations of the gaps investigated in this work are presented.
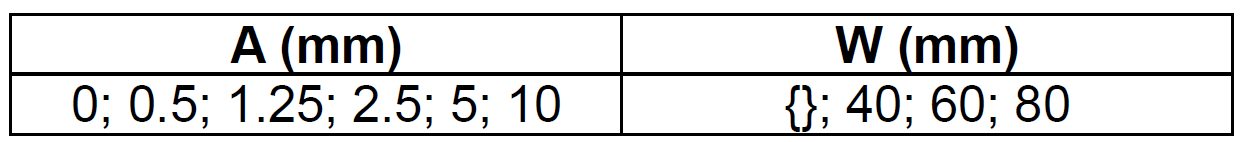
Table 1: List of Gap Parameters Investigated.K-12
A 7-kN maximum denting force was observed at the gap (10|60). With a gap of (10|40) the gap could not be closed with the machines’ 8-kN clamping force capacity. In comparative tests on mild steel for deep drawing a clamping force of about 2 kN was required to overcome the gap (10|60) (see Figure 3). The main effects diagram of the denting force clearly shows that the average denting force gets smaller with increasing support width and becomes larger with increasing gap clearance.
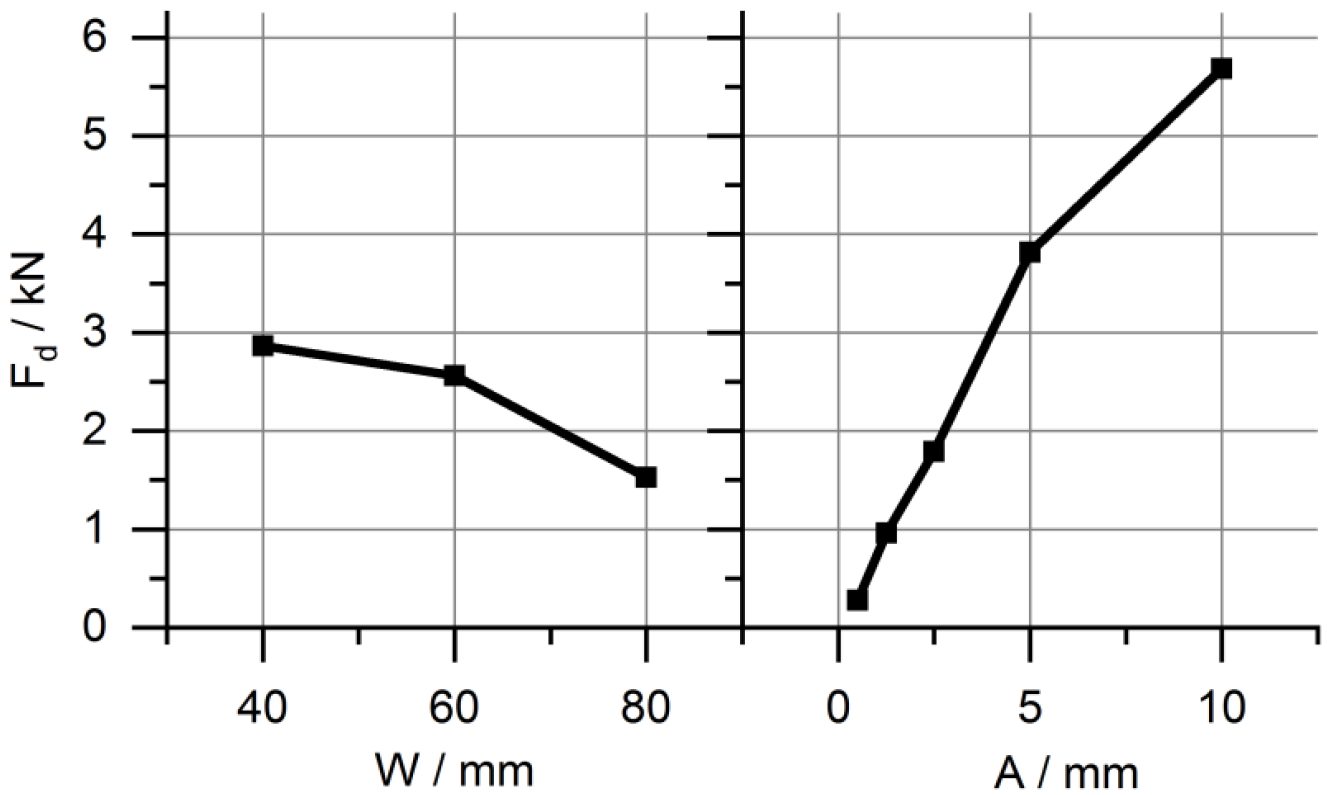
Figure 3: Main Effects Diagram of the Denting Force.K-12
In Figure 4, the achieved nugget diameters at different gaps using a constant machine setting of Iw,f = 6.4 kA are displayed.
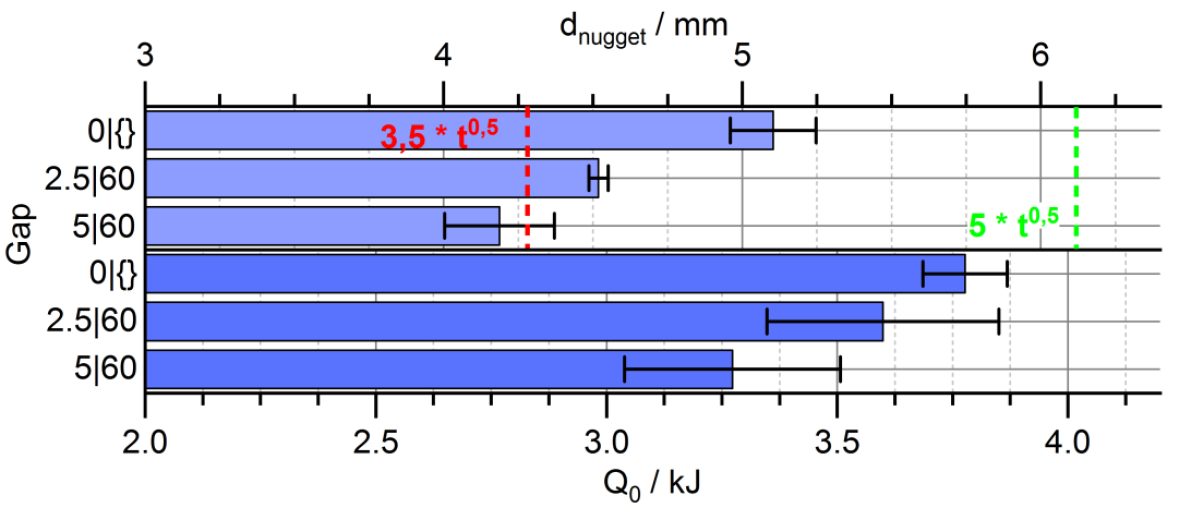
Figure 4: Effect of Gaps on Nugget Diameter, Absolute and Relative Results.K-12
A two-staged welding program, starting with a preheat current followed by a larger finishing current proved to yield the best welding results with the material used, cf., Figure 5. In Figure 5, the applied welding current program along with the measured and computed total resistance curve is displayed.
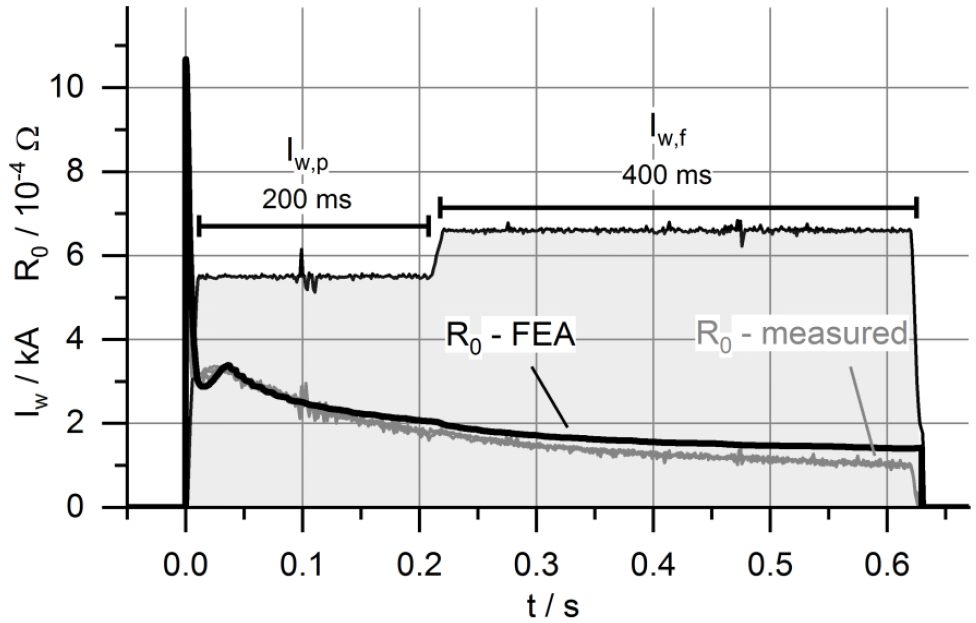
Figure 5: Exemplary Total Resistance Curve of a Weld without Gap, Measured and Computed Results.K-12
The FEA model can represent the welding process in terms of nugget diameter, dynamic resistance curve, and total electric energy with great accuracy. In Figure 6, the partial resistances of the weld as computed by FEA are composed.
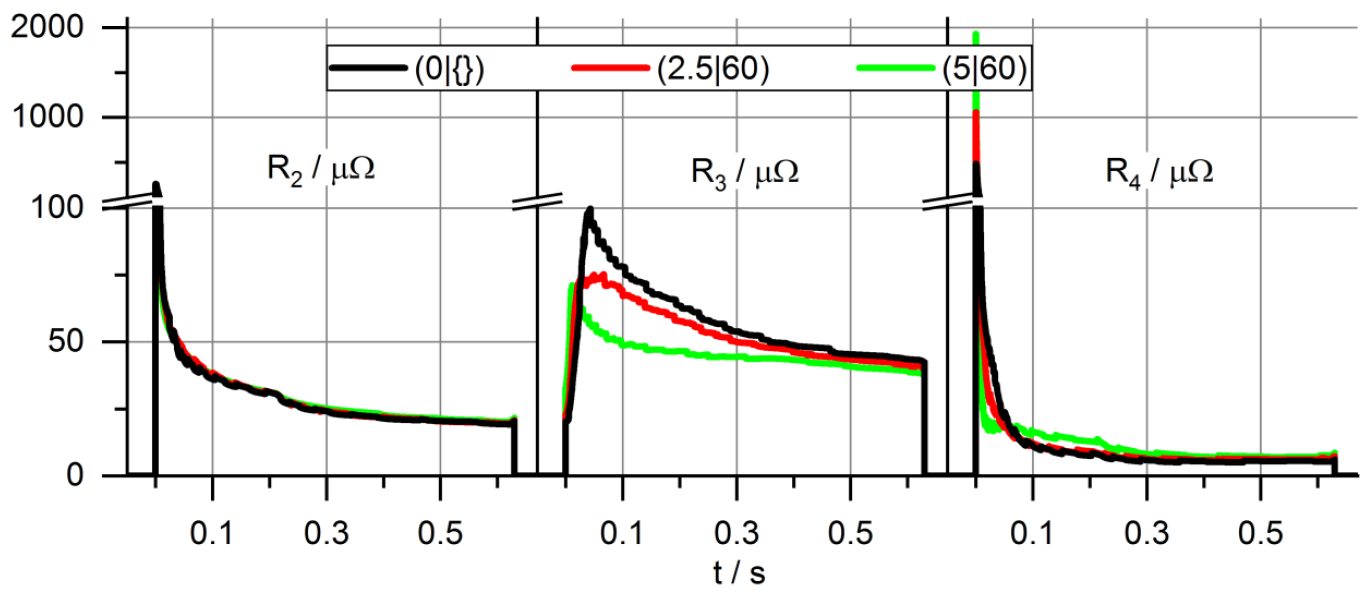
Figure 6: Partial Electrical Resistances at Different Gap Configurations.K-12
In the top section of Figure 7, the computed sheet thickness curve during the process for different gaps is presented. Increased electrode indentation during welding at gaps is the reason for reduced resistance and, therefore, results in reduced nugget diameters. The lower section of Figure 7 shows the plastic strains in the sheets along with a visibly reduced sheet thickness.
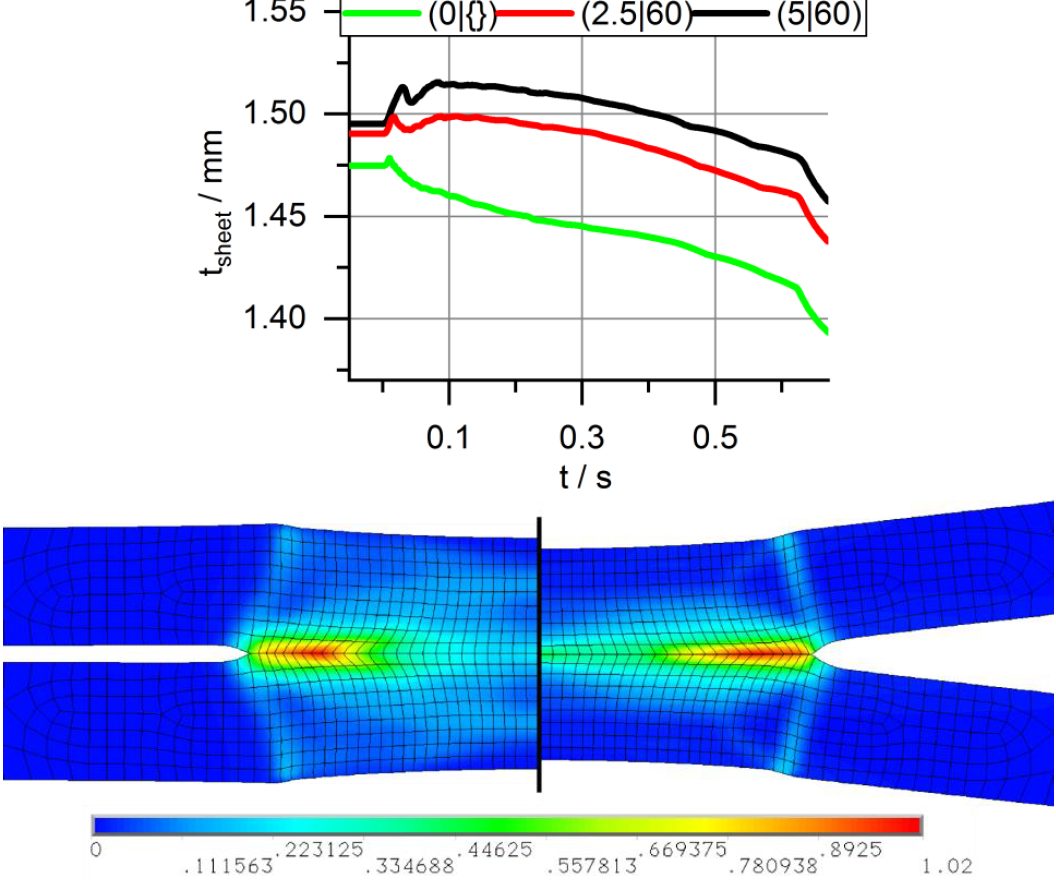
Figure 7: Dynamic Sheet Thickness (up) and Plastic Strain in millimeters at Different Gaps (low, to scale).K-12
Additional welding experiments were performed to clarify, if increased welding current can counter the gap effect and maintain the energy level of the weld. The results are shown in Figure 8. They prove that increased weld current is sufficient to not only maintain the nugget diameter at gaps, but moreover increase it.
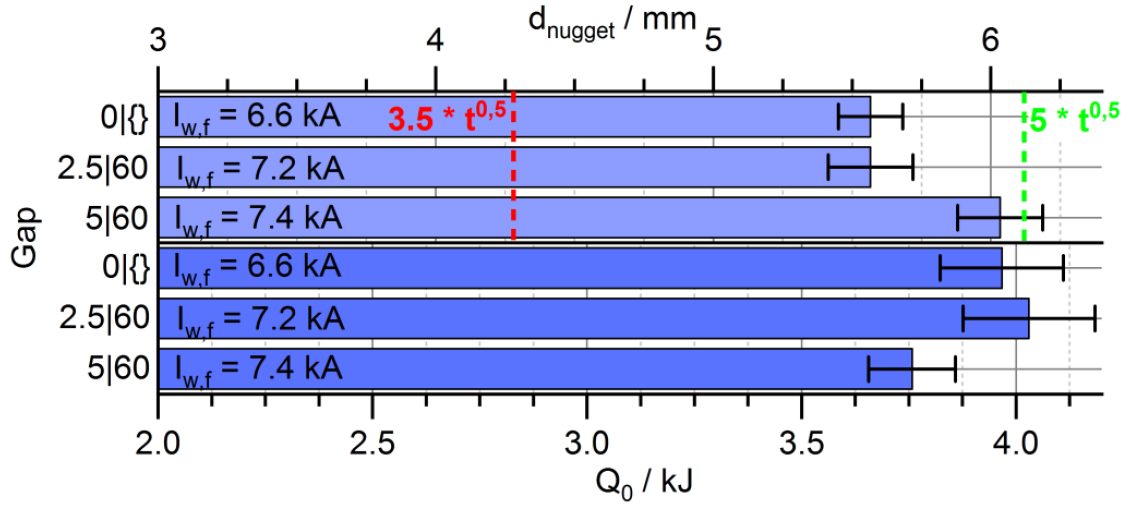
Figure 8: Nugget Diameter and Energy of Spot Welds near the Splash Limit at Overlaps with Gap.K-12
Results of further investigations on the weldability lobe of the joint are composed in Figure 9.. It is visible that with increasing gap the current range shifts toward larger currents and gets narrower.