Blog, homepage-featured-top, Joining, Joining Dissimilar Materials, main-blog, News, Resistance Spot Welding, Resistance Welding Processes, RSW Modelling and Performance, RSW of Dissimilar Steel
This blog is a short summary of a published comprehensive research work titled: “Peculiar Roles of Nickel Diffusion in Intermetallic Compound Formation at the Dissimilar Metal Interface of Magnesium to Steel Spot Welds” Authored by Luke Walker, Carolin Fink, Colleen Hilla, Ying Lu, and Wei Zhang; Department of Materials Science and Engineering, The Ohio State University
*****
There is an increased need to join magnesium alloys to high-strength steels to create multi-material lightweight body structures for fuel-efficient vehicles. Lightweight vehicle structures are essential for not only improving the fuel economy of internal combustion engine automobiles but also increasing the driving range of electric vehicles by offsetting the weight of power systems like batteries.
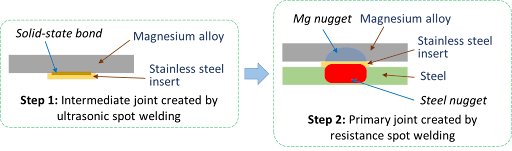
To create these structures, lightweight metals, such as magnesium (Mg) alloys, have been incorporated into vehicle designs where they are joined to high strength steels. It is desirable to produce a metallurgical bond between Mg alloys and steels using welding. However, many dissimilar metal joints form intermetallic compounds (IMCs) that are detrimental to joint ductility and strength. Ultrasonic interlayered resistance spot welding (Ulti-RSW) is a newly developed process that has been used to create strong dissimilar joints between aluminum alloys and high-strength steels. It is a two-step process where the light metal (e.g., Al or Mg alloy) is first welded to an interlayer (or insert) material by ultrasonic spot welding (USW). Ultrasonic vibration removes surface oxides and other contaminates, producing metal-to-metal contact and, consequently, a metallurgical bond between the dissimilar metals. In the second step, the insert side of the light metal is welded to steel by the standard resistance spot welding (RSW) process.
Cross-section View Schematics of Ulti-RSW Process Development
For resistance spot welding of interlayered Mg to steel, the initial schedule attempted was a simple single pulse weld schedule that was based on what was used in our previous study for Ulti-RSW of aluminum alloy to steel . However, this single pulse weld schedule was unable to create a weld between the steel sheet and the insert when joining to Mg. Two alternative schedules were then attempted; both were aimed at increasing the heat generation at the steel-insert interface. The first alternative schedule utilized two current pulses with Pulse 1, high current displacing surface coating and oxides and Pulse 2 growing the nugget. The other pulsation schedule had two equal current pulses in terms of current and welding time.
Lap shear tensile testing was used to evaluate the joint strength using the stack-up schematically, shown below. Note the images of Mg and steel sides of a weld produced by Ulti-RSW.
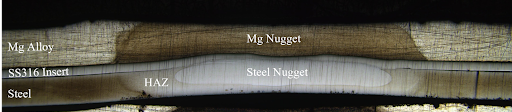
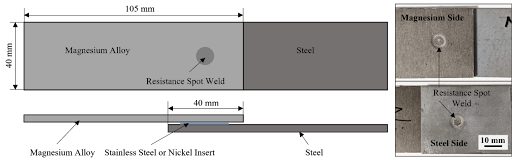 Lap Shear Tensile Test Geometry and the Resultant Weld Nuggets
An example of a welded sample showed a distinct feature of the weld that is comprised of two nuggets separated by the insert: the steel nugget formed from the melting of steel and insert and the Mg nugget brazed onto the unmelted insert. This feature is the same as that of the Al-steel weld produced by Ulti-RSW in our previous work. Although the steel nugget has a smaller diameter than the Mg nugget, it is stronger than the latter, so the failure occurred on the Mg sheet side.
Joint strength depends on several factors, including base metal strength, sheet thickness, and nugget size, making it difficult to compare how strong a weld truly is from one process to another. To better compare the dissimilar joints created by different processes, joint efficiency, a “normalized” quantity was calculated for various processes used for dissimilar joining of Mg alloys to steels in the literature, and those results, along with the efficiencies of Ulti-RSW with inserts, are shown together below. Most of the literature studies also used AZ31 as the magnesium base metal. The ones with high joint efficiency (about 53%) in the literature are resistance element welding (REW) and friction stir spot welding (FSSW). In our study, Ulti-RSW with SS316 insert was able to reach an excellent joint efficiency of 71.3%, almost 20% higher than other processes.
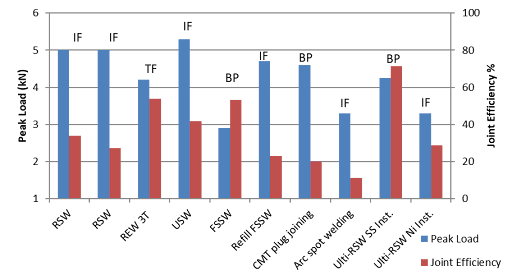 Process Evaluation and Comparison

Thanks are given to Menachem Kimchi, Associate Professor-Practice, Dept of Materials Science, Ohio State University, and Technical Editor – Joining, AHSS Application Guidelines, for this article.
Automotive Welding Process Comparison, Blog, Joining
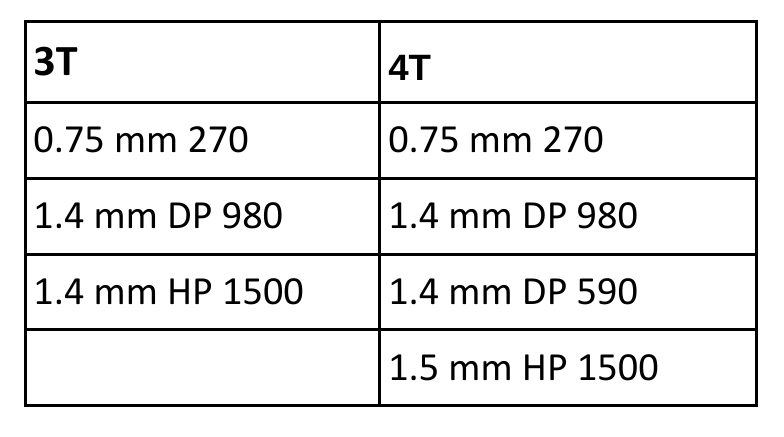
Car body-in-white (BIW) structures, such as pillars and rails, are increasingly made of complex stack-ups of advanced high-strength steels (AHSS) for vehicle lightweighting to achieve improved fuel efficiency and crashworthiness. Complex stack-ups comprise more than two sheets with similar/dissimilar steels and non-equal sheet thicknesses.
Resistance spot welding (RSW) of complex stack-ups can be challenging, especially when a thin sheet of low-strength steel is attached to multiple thick AHSS sheets with a thickness ratio of five or higher (thickness ratio = total thickness of the stack-up/thickness of the thinnest sheet). In such a case, the heat loss is much faster on the thin sheet side than on the thick sheet side, and consequently, obtaining sufficient penetration into the thin sheet without expulsion on the thick sheet side can be challenging.
An example of two automotive applications involving complex AHSS steel stack-ups is shown below.
Examples of automotive applications involving complex AHSS steel stack-ups
For welding 2T steel stack-ups, the weld schedule may be relatively simple and utilize just one current pulse with a specific weld time. However, typical RSW machines and controllers can customize and precisely control each parameter indicated in Figure 1.
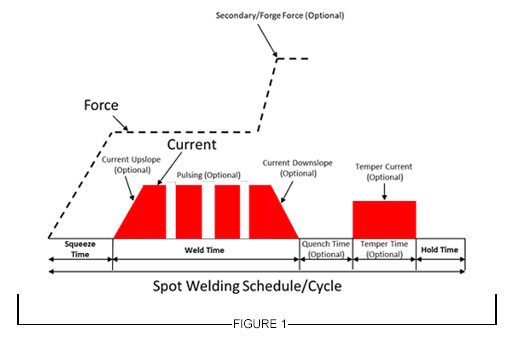
Figure 1: General Description of Resistance Spot Welding Schedule
For RSW 3T and 4T applications, more advanced schedules are needed to achieve good weld nugget penetration through all the interfaces in the stack-up. To achieve this objective, the use of multiple current pulses with short cool time in between the pulses showed to be most effective, and in some cases, the application of a secondary force showed to be beneficial.
Figure 2 describes a method for joining the 3T stack-up using two current pulses. The first one is a short-time pulse that does not allow enough time for the electrode cooling to dominate at the top sheet, so a weld can easily form between the top and middle sheet. Once that nugget has formed, the second pulse utilizes a lower current and longer time to form the second nugget, which then grows into the first nugget to form a single weld.
This approach can be also used with electrode force variation during the welding cycle to provide additional control of the contact resistances, but of course, it is limited to machines that are capable of varying force during the weld cycle.
Typical pulse times are 50 – 350 ms with cool times of 20 – 35 ms and current levels between 8 – 15 KA, depending on materials type and thickness.
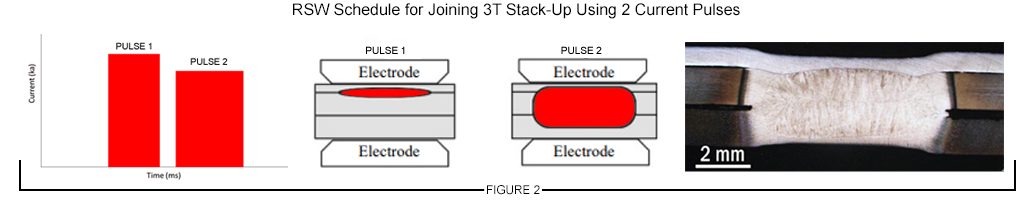
Figure 2: Example of RSW Schedule for Joining 3T Stack-Up Using 2 Current Pulses
A 4T stack-up example is shown in Figure 3. In this case, a similar approach was used with three current pulses applied during the weld cycle to produce a weld through all interfaces.
The common theme in resistance spot welding all complex stack-ups is using a complex, multi-pulse weld cycle. These more complex schedules should be developed experimentally and potentially with computational modeling. Another consideration that may be beneficial in some cases is to vary the top and bottom electrode face diameter, such as that the smaller electrode face is on the thinner material side of the stack-up.
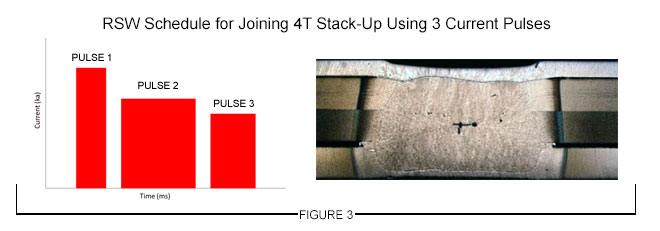
Figure 3: Example of an RSW Schedule for Joining 4T Stack-Up Using 3 Current Pulses
Thanks is given to Menachem Kimchi, Associate Professor-Practice, Dept of Materials Science, Ohio State University and Technical Editor – Joining, AHSS Application Guidelines, for this article.
RSW of Dissimilar Steel
This article summarizes a paper entitled, “Higher than Expected Strengths from Dissimilar Configuration Advanced High-Strength Steel Spot Welds”, by E. Biro, et al.B-6
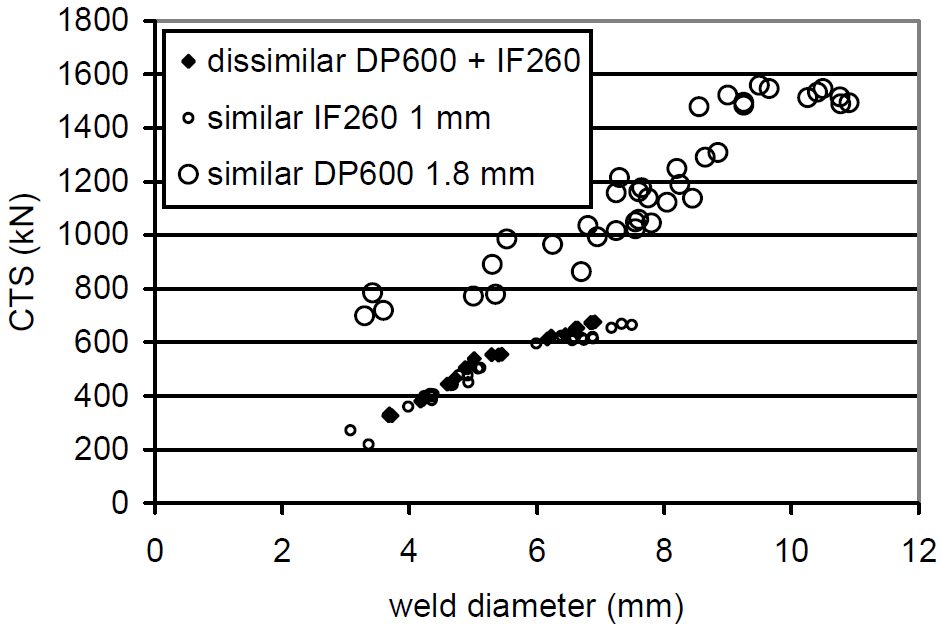
This study shows that the cross tension strength (CTS) is always higher than the strength expected from the lower strength material in the joint. Figure 1 verifies the assumption that the load bearing capacity of a heterogeneous configuration is supposed to equal the minimum strength of both homogenous assemblies. Material used in this study was a 1 mm low carbon equivalent Dual Phase 980 (DP980 LCE) steel.
Figure 1: Example of dissimilar configuration with CTS matching the “minimum rule”.B-6
The materials chosen for this study are in Table 1.
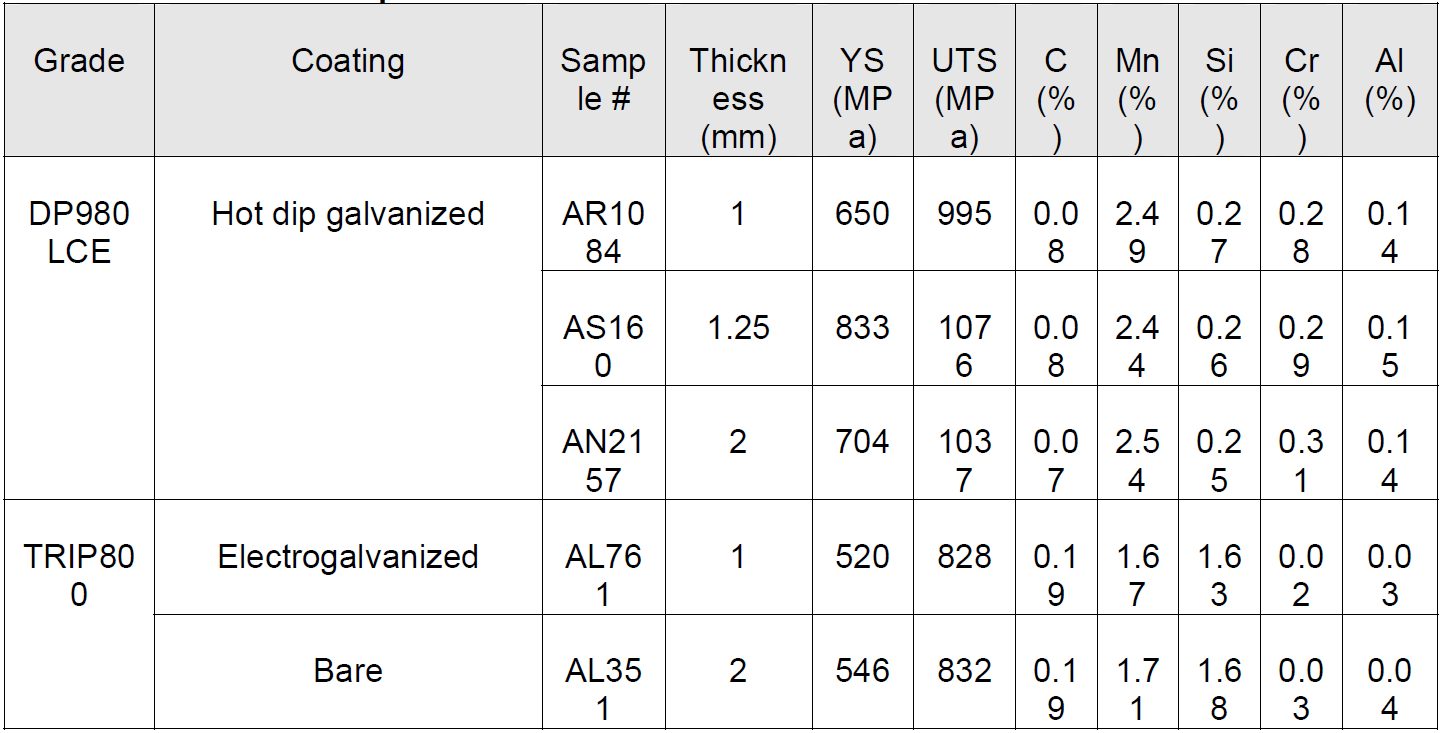
Table 1: Steel sheet samples.B-6
The material thickness combinations for all of the two sheet joints are shown in Table 2.
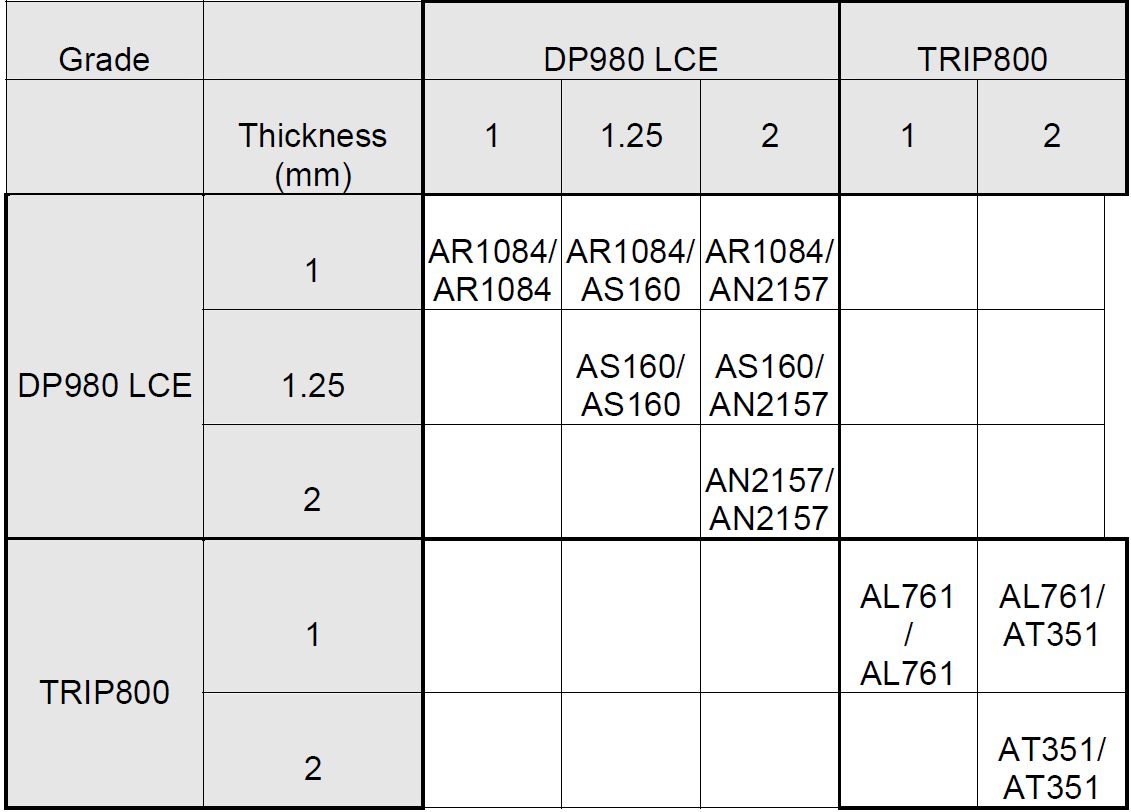
Table 2: Welded 2-sheet configurations.B-6
The three-sheet stackups all were made using the 1 mm DP980 LCE. These configurations were designed to understand what happens in such cases, knowing that three-sheet welding is very common in car body manufacturing. The three-sheet stackup configurations are shown in Figure 2 and are as were follows:
- a square DP980 coupon (patch) is inserted between the two classical cross-tension coupons for welding (1+patch+1 mm);
- two coupons oriented the same way welded with one coupon oriented in the transverse direction to form a cross-tension sample (1+[1+1] mm);
- same configuration as a) but the external coupon is removed by manual torsion before cross-tension testing (1+1+0 mm);
- same configuration as a), but the two coupons oriented the same way are first spot welded together strongly (with several spots) in the extremities, before the actual 3-sheet spot weld is done ([1++++1]+1 mm).
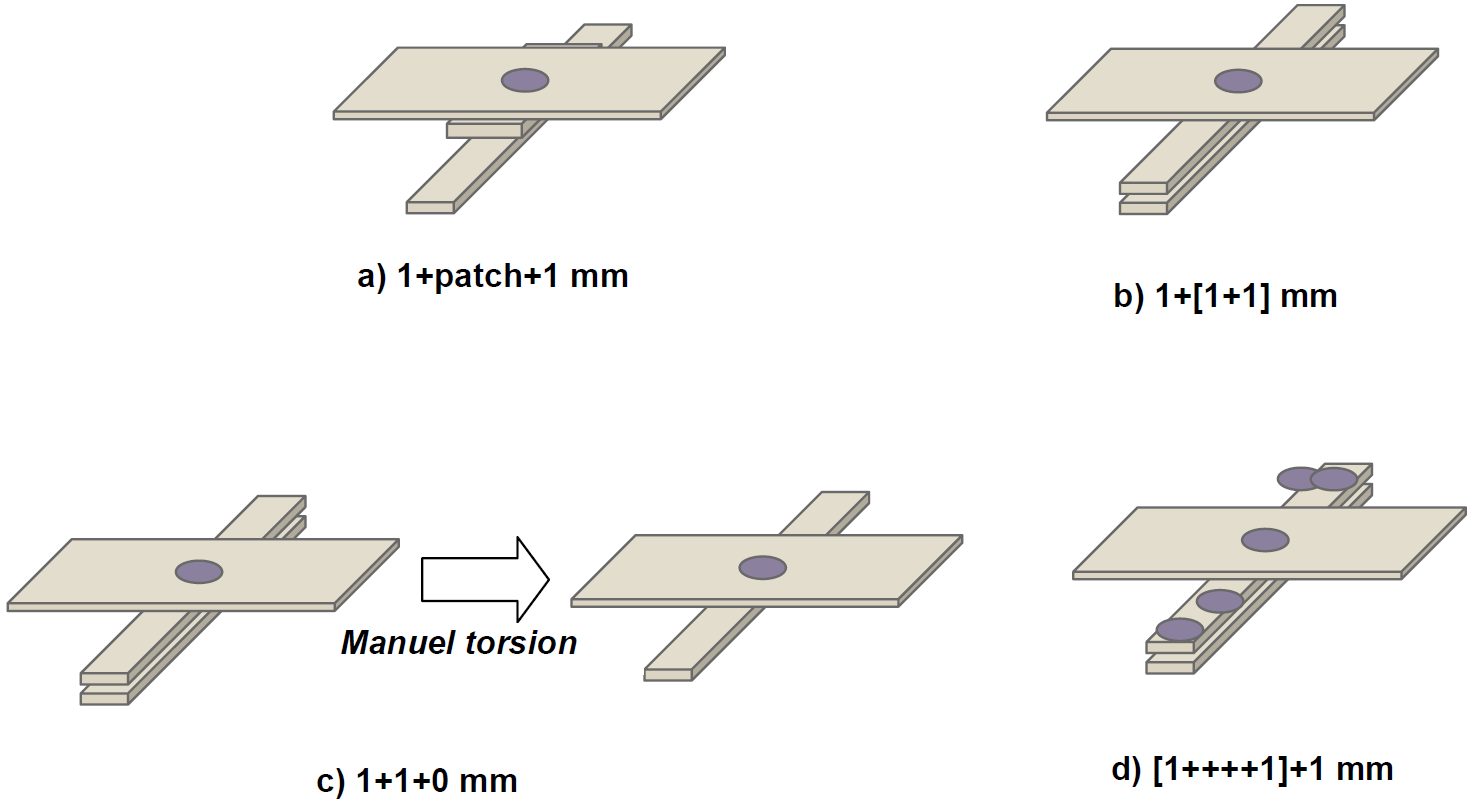
Figure 2: Three-sheet configurations based on 1mm DP980 LCE sample.B-6
The welding parameters for each configuration are listed in Table 3.
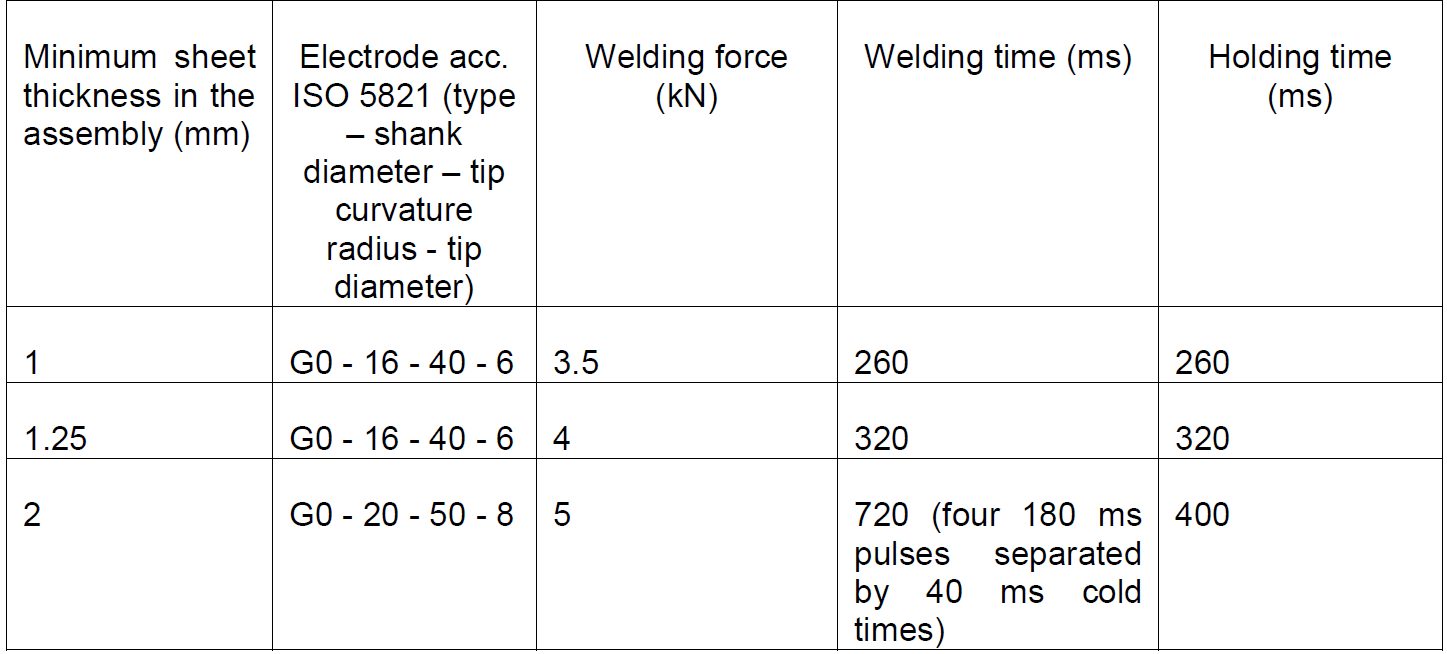
Table 3 : Welding parameters.B-6
CTS is strongly dependent on weld diameter (Figure 3).
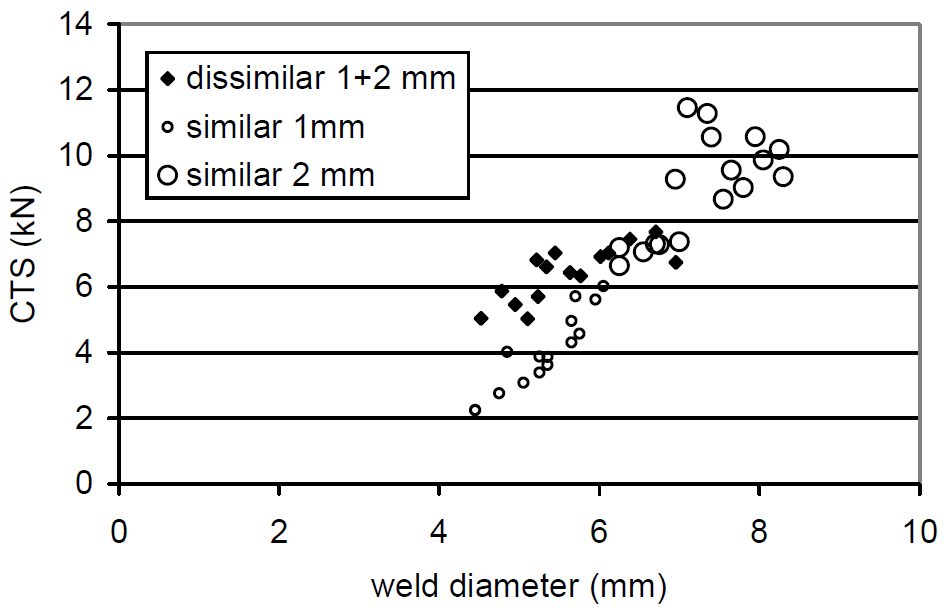
Figure 3: Cross-tension Strength for TRIP800 configurations.B-6
CTS for the main DP980 configurations are shown as a function of weld diameter in Figures 4 and 5.
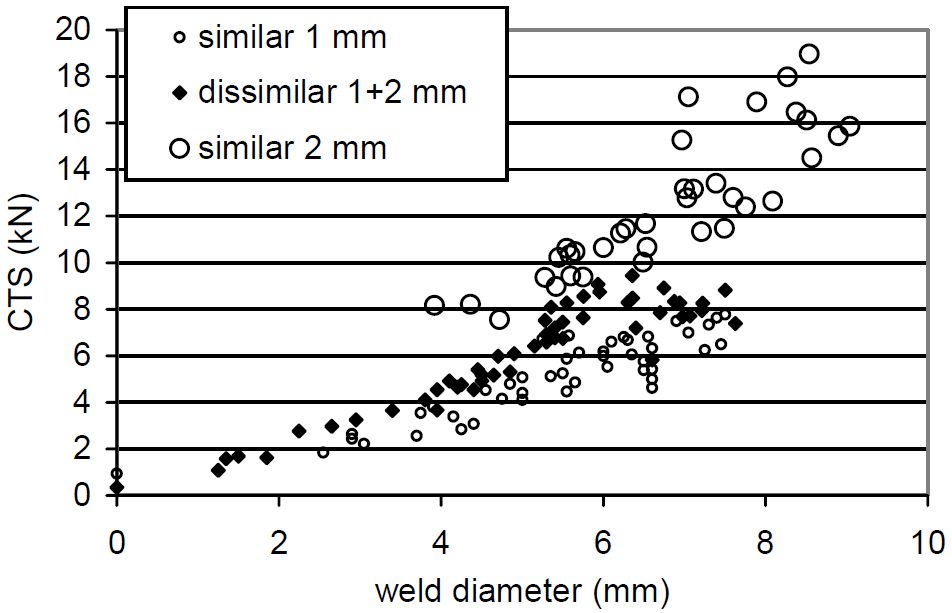
Figure 4: Cross-tension Strength for DP980 1+1, 1+2 and 2+2 configurations.B-6
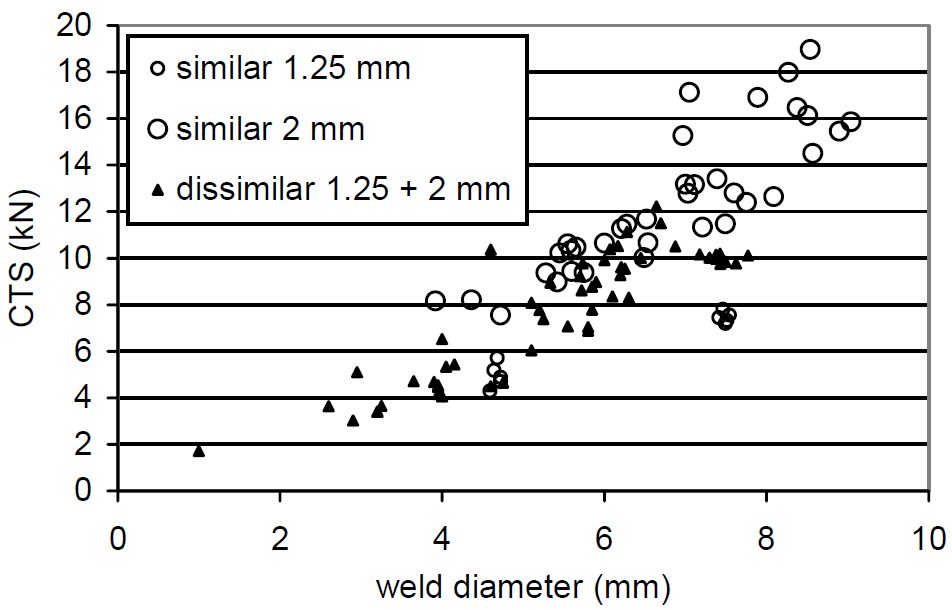
Figure 5: Cross-tension Strength for DP980 1.25+1.25, 1.25+2 and 2+2 configurations.B-6
The three-sheet configurations based on 1mm DP980 LC results are shown in Figures 6 and 7. These results again verify that dissimilar configuration performances appear above the “minimum rule” assumption described in Figure 1.
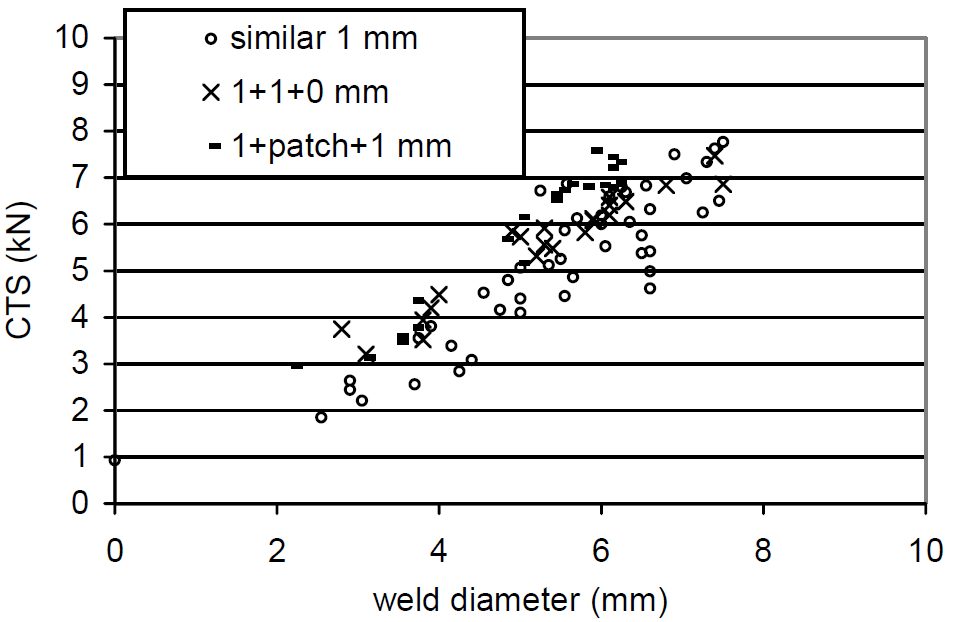
Figure 6: Cross-tension Strength for DP980 1+1, 1+1+0 and 1+patch+1 configurations.B-6
![Figure 7: Cross-tension Strength for DP980 1+1, 1+2, 1+[1+1]and [1+++1]+1 configurations.](https://ahssinsights.org/wp-content/uploads/2020/07/3114c_Fig7.jpg)
Figure 7: Cross-tension Strength for DP980 1+1, 1+2, 1+[1+1]and [1+++1]+1 configurations.B-6
The observation that CTS is greater than predicted by the “minimum rule” has been called a “positive deviation” from the expected strengths.
This work concluded that while material qualification tests are frequently based on similar welding configurations, real car body applications are quite systematically dissimilar configurations. For spot welds failing in plug mode, the strength of the assembly only depends on the weakest material strength. In case of AHSS+AHSS welded combinations, however, things turn out to be different. Similar grade but dissimilar thickness High-Strength Steel configurations have been spot welded and tested in Cross-Tension. The following main conclusions can be highlighted:
- For dissimilar thickness configurations, the cross-tensile strength is above the standard “minimum rule” assumptions, this phenomenon being called a “positive deviation”;
- Limited thermal and notch location effects can explain part of this positive deviation, but the main reason is mechanical;
- As evidenced through several analytic and numerical studies, this mechanical effect is due to the less severe local stresses at the notch in case of uneven thickness, and improves the positive deviation when the thickness ratio increases. Although widely used for material qualification and scientific purposes, similar configurations appear as the worst case in terms of cross-tension performance for high strength steels. Actual vehicle design should consider positive deviation in dissimilar configurations to maximize the potential strength of spot welds in High-Strength steels.
Joining Dissimilar Materials, Resistance Welding Steel to Aluminium
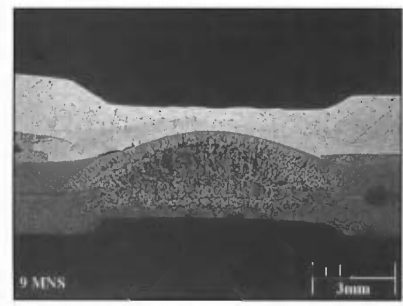
In order to reduce the thickness of brittle intermetallic compound (IMC) formed at Aluminium/Steel interface to improve the mechanical properties of resistance spot welding of Aluminium/Steel, different interlayers, such as Al-cladded steelS-16, O-3, Y-4, Al-Si alloyW-15, Al-Mg alloyI-6, pure Al W-16, Zn coating.M-10, U-4, A-21 Sun et al.S-16 has done resistance spot welding of 1.4-mm SAE 1008 mild steel with 2-mm 5182-O aluminium alloy using 1 mm/1.5 mm cold rolled aluminium-clad steel as a transition metal with Aluminium/Steel thickness ratio of 20/80 (thickness ratio was not optimized). The formation of IMC cannot be observed at the interface for cold rolled aluminium-clad steel. The electrodes used were Class 2 30-deg truncated cone with 8-mm surface diameter and 3-inch face radius on the aluminium side and 30-deg truncated cone with 8-mm flat surface diameter on the steel side. Two separate nuggets created the aluminium and steel sides with a final nugget diameters of 10.1 mm and 8.2 mm, on aluminium and steel sides respectively, at the end of the 3rd pulse (Figure 1). With increasing welding time from 1 pulse to 3 pulses, the intermetallic compound layer thickness increased from 0 µm to 8.5 µm. As a comparison, the IMC layer thickness was approximately 65 µm for resistance spot welding of 1-mm AA 5052 and 0.8-mm low carbon steel without transition metal. The static and dynamic strength of the RSW samples in cross-tension and coach peel test were comparable to those of the peak load of self-piercing rivets (SPR). However, lap shear tensile testing of RSW samples had lower energy absorption than dissimilar SPR samples due to different failure modes (interfacial fracture may occur). Fatigue strength of RSW samples were lower than those of SPR samples due to stress concentration and tensile residual stress at the notch tip.
Figure 1: Cross-sectional macrostructure of resistance spot welding of SAE1008/A5182-O with 3 pulses of 12 cycles and welding current of 13.6 kA.S-16
Oikawa et al.O-3 have done resistance spot welding of 0.4 mm-thick cold rolled steel with 0.6 mm-thick pure aluminium with 0.77 mm-thick aluminium-clad steel sheet as the insert metal. Fe-Al IMCs have not been noted at the Aluminium/Steel interface of aluminium-clad steel sheet and a peel strength of 32.1 N/mm can be achieved. IMC layer thickness was about 5 µm at Al/steel interface when aluminium alloy and steel was resistance spot welded with aluminium clad steel sheet as insert. However, the tensile shear strength (Figure 2) and U-tension strength (Figure 3) can be 3.6 kN and 1.5 kN which were similar to Al/Al resistance spot weld joint and were much higher than direct resistance spot welding of 2.4 kN and 0.6 kN. However, it should be noted that resistance spot welding with aluminium-clad steel added weight, and difficulties in hot rolled aluminium cladding process result in high cost. Thus, more investigations have been done recently on improving the cladding method and using thinner and lighter metals as interlayers.
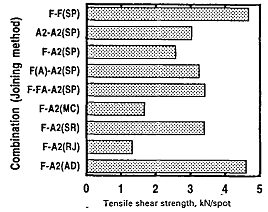
Figure 2: Comparison of tensile shear strength of Al/steel joints by various methods (SP-spot welding; MC-mechanical clinching; RJ-rivet joining; AD-adhesion bonding).O-3
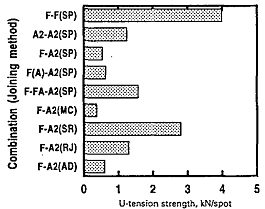
Figure 3: Comparison of U-tension strength of Al/steel joints by various methods (SP-spot welding; MC-mechanical clinching; RJ-rivet joining; AD-adhesion bonding).O-3
In order to reduce the IMC layer thickness, Zhang et al.W-15 used 4047 AlSi12 as an interlayer to suppress the IMC growth during resistance spot welding of 1 mm H22YD-Z100 Zn-coated high-strength steel sheets with 1.5 mm EN AW 6008-T66 aluminium alloy sheets. The effect of different interlayer thickness, i.e. 100 µm, 200 µm, 300 µm, 400 µm, on IMC growth behavior and mechanical properties were investigated. IMCs consisted of Fe2(Al,Si)5 and Fe4(Al,Si)13 and the thickness of IMCs reduced from 1.8 µm to 0.6 µm as the thickness of AlSi12 interlayer, increasing from 100 µm to 400 µm. But all were much thinner compared to 4 µm for spot welds without an interlayer. Nugget diameter reduced with increasing interlayer thickness and maximum tensile shear strength of 6.2 kN and pull-out failure mode were obtained with an interlayer thickness of 300 µm.
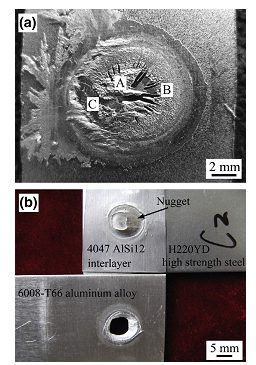
Figure 4: Fracture modes of H220YD high-strength steel/6008-T66 resistance spot weld joints (a) interfacial fracture without interlayer and (b) pull-out failure with 4047 AlSi12 interlayer thickness of 300 µm. W-15
Ibrahim et al.I-6 had investigated resistance spot welding of 2 mm A6061-T6 and 2 mm type 304 austenitic stainless steel with 80 µm thick Al-Mg alloy (80 wt % Al and 20 wt% Mg). Under the same welding condition, lap shear tensile strength was higher for welds with an Al-Mg interlayer than without the interlayer, and a peak strength of 8.4 kN can be obtained with welding current of 16.1 kA and welding force of 9.3 kN. A thin IMC layer of approximately 2 µm can be observed, which lead to a high strength. Fatigue strength of dissimilar RSW Aluminium/Steel samples were higher than Friction Stir Spot Welding samples. The failure mode depended on the load level. Pull-out failure occurred at high load (Pmax > 3 kN), shear fracture at 2.25 kN < Pmax <3 kN, upper Al sheet fracture at Pmax < 2.25 kN.
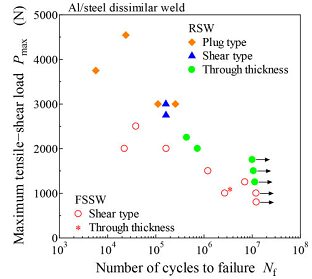
Figure 5: Relationship between peak load and number of cycles.I-6
Galvanized steel (GI) and Galvannealed steel (GA) are widely used in the automotive industry, and the presence of Zn layer may affect the weldability of Aluminium/Steel. Al-Zn eutectic liquid formed at Aluminium/Steel interface can efficiently remove oxide film and squeezed outside by electrode force. Thus, metallic surface of aluminium and steel can be revealed, and the Al-Fe IMC layer formed and a metallurgical bond was created.M-10, U-4 Arghavani et al.A-21 have investigated the resistance spot welding of 2 mm Al-5052 to 1 mm low carbon galvanized steel (ASTM A653 CS Type B-G60) (GI/Al) and compared that with the weldability of Al 5052 to uncoated steel DC01 (PS/Al). It showed the IMC layer at the GS/Al interface with the tongue-like layer of Fe2Al5 on the steel side and needle-like FeAl3 on the aluminium alloy side, as normally observed in Aluminium/Steel dissimilar welding (Figure 6).Z-3, U-4 GI/Al joints had thinner IMC layers at almost all the welding currents compared to PS/Al joints. And the IMC layer thickness in GI/Al increased initially with increasing welding current up to 12 kA and then decreased beyond it, which was due to heat consumption with Zn evaporation at higher welding current (I > 12 kA). Tensile shear strength of GI/Al welds were lower than PS/Al welds at welding current less than 12 kA since lower current led to incomplete nugget at GI/Al welds. However, tensile shear strength of GI/Al welds exceeded PS/Al welds at higher welding current since IMC layer thickness was over the critical value of approximately 5.5 µm for PS/Al joints at the higher welding current (Figure 7). Both GI/Al and PS/Al had an interfacial fracture mode with crack initiation at the peripheral regions of the weld and propagated through the IMCs layer/aluminium sheet.
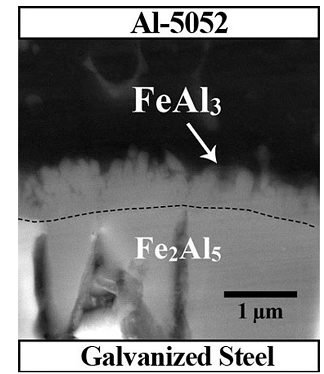
Figure 6: SEM image of IMC layer in GS/Al specimen.A-21
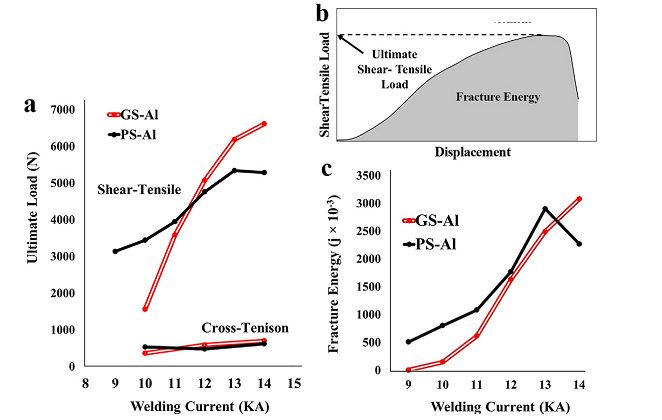
Figure 7: (a) Ultimate tensile shear and cross-tension strength vs welding current; (b) schematics of load-displacement curve and fracture energy calculation for tensile shear testing; (c) Fracture energy vs welding current.A-21

Joining Dissimilar Materials, Resistance Welding Steel to Aluminium
Capacitive Discharge Welding (CDW) is a similar process to RSW except large amount of energy is released in relatively a short amount of time. A research group at The Ohio State University working under supervision of Dr. Menachem Kimchi and Jerry Gould from EWI has investigated the feasibility of Al/Steel joining via this process. Figure 1 shows the current waveforms at 1.3ms & 2.5 and their mechanical strength results.
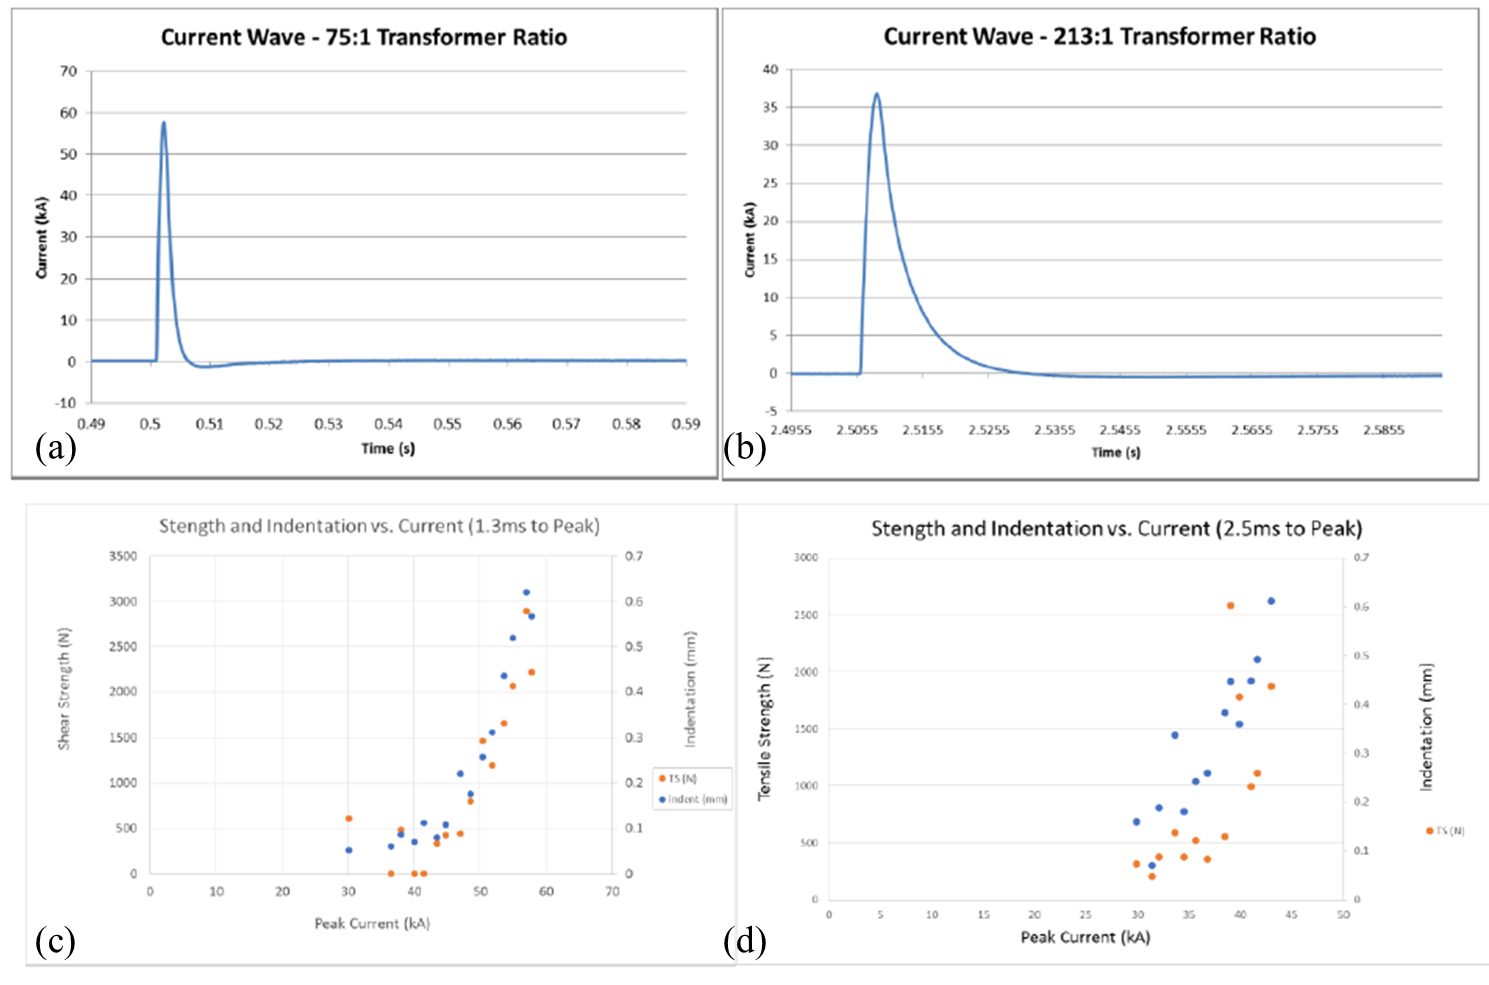
Figure 1: (a) Current waveform for 1.3ms to reach peak value, (b) Current waveform at for 2.5ms to reach peak value (c-d) Lap shear tensile strength and indentation as a function of current and time to reach peak current.
A shorter amount of time can significantly suppress the growth of the intermetallics. The group reported that higher amount of current in short duration of time could result in stronger welds. Figure 15 shows the effect of time on the growth of intermetallic (IMC) and solidification pattern. At 1.3 ms IMC layer thickness is less than 3 microns whereas at 2.5 ms the IMC layer thickness was reported greater than 3 microns. If IMC layer is less than 3 microns it results in nugget pull out failure mode whereas IMC layer of 3 microns or greater mostly result on interfacial failure.P-10
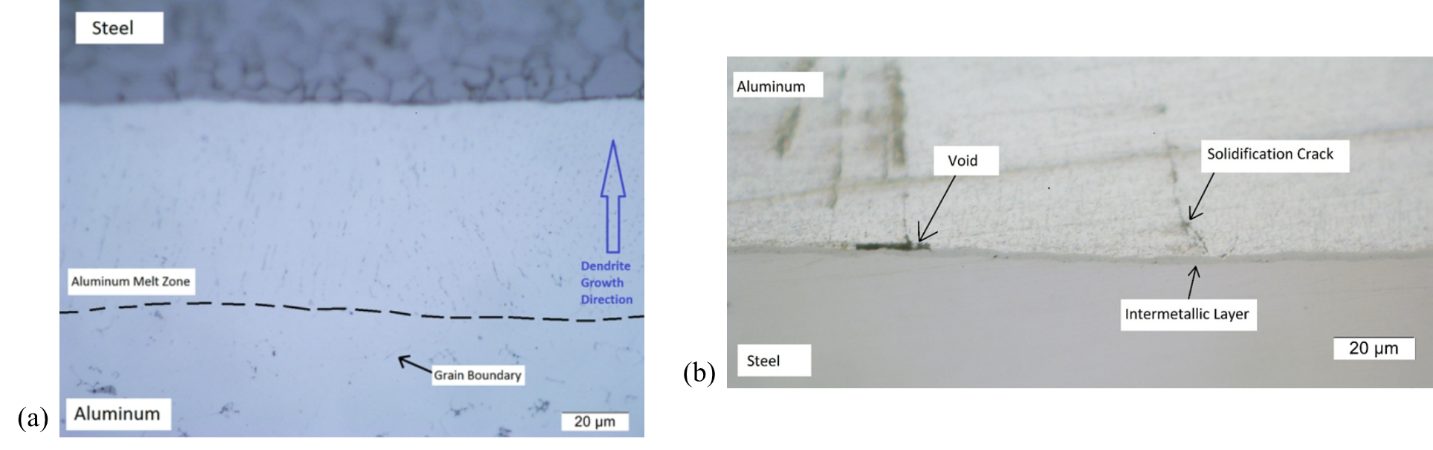
Figure 2: Effect of the ramp up time on the intermetallic layer thickness (a) 2.5ms & (b) 1.3ms.