News
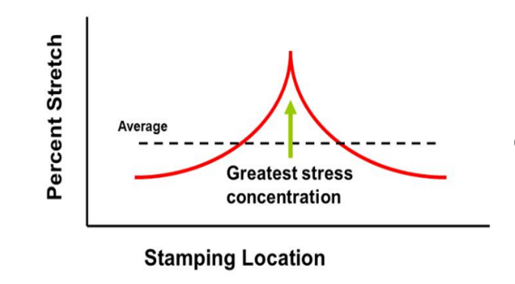
To understand the difference between localized and global fractures, you must first understand strain gradients (see the article in our blog, AHSS Strain Hardening and Gradients). Gradients can result in highly concentrated strains (peak strain condition) that typically occurs in an embossment or character line where the deformation mode is in plane strain. Peak strains can develop rapidly in a very localized area (Figure 1). Under additional loads, this can result in the onset of localized necking, which means the material has reached its tensile strength and will fail at its weakest point or highest strain. When a slight increase in strain is applied, the material will fracture, sometimes at deformation levels less than predicted. This condition can be found in AHSS products, where multiple phases exist within the steel’s microstructure, each with different properties. A global fracture also typically occurs in plane strain, but more commonly down a sidewall or other area with more moderate geometry complexity.
Figure 1: Peak strain in the localized area or embossment
Peak (concentrated) strains are susceptible to localized fractures when even slight variation exists in the forming process. Examples of variation include lubrication pattern and volume, die recipe including blank position, press conditions, and material characteristics.
A localized neck and/or fracture (Figure 2) reduces the sheet metal’s thickness, reducing part strength, and compromising functional performance such as fatigue life, crash worthiness, and stamping stiffness. There are a number of formability analysis tools that can differentiate localized and global fractures and enable die makers to implement die and process improvements that minimize fracture susceptibility. The result is a more robust stamping process.
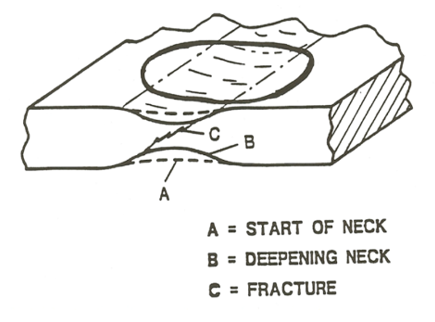
Figure 2: Schematic of Localized Necking and Fracture
Process control is critical; die recipe discipline is needed to minimize tinkering with die recipe, press settings, and lubrication settings. Mechanical properties of the sheet metal should be tracked to identify trends or variations in the material, and establish the material forming window. Typical mechanical properties that are available from the steel supplier are yield strength, tensile strength, n-value, total and uniformed elongation, and sheet thickness. Additional properties that should be determined include hole expansion and deep cup draw ratios. Failure to identify strain levels, process variables and variation will lead to a reactionary approach to controlling the output. This will lead to an increase in scrap, die-related downtime, and of course, costs.
Contributions made by Phoenix Group.
Blog, homepage-featured-top, main-blog, News
WorldAutoSteel periodically invites outside experts to contribute their knowledge on pertinent topics. Here, Danny Schaeffler, President of Engineering Quality Solutions and our Technical Editor for Metallurgy and Forming, worked with Trey Leonard, Ph.D. Founder and CEO, Standard Mechanics, LLC to bring you this overview of several aspects of High Strain Rate testing. You’ll find portions of this content as part of our page on High Strain Rate Testing, but this month, we want to highlight it in our AHSS Insights blog.
High strain rate testing is not an abstract materials exercise in the automotive industry—it is a targeted characterization tool used to ensure that advanced high-strength steels (AHSS) perform as expected during forming and crash events. In the context of automotive body structures, the relevant question is not simply “what is the strength of this steel,” but rather “how does this steel behave when deformed at rates representative of an actual event?”
Why Strain Rate Sensitivity Matters for AHSS Crash Performance
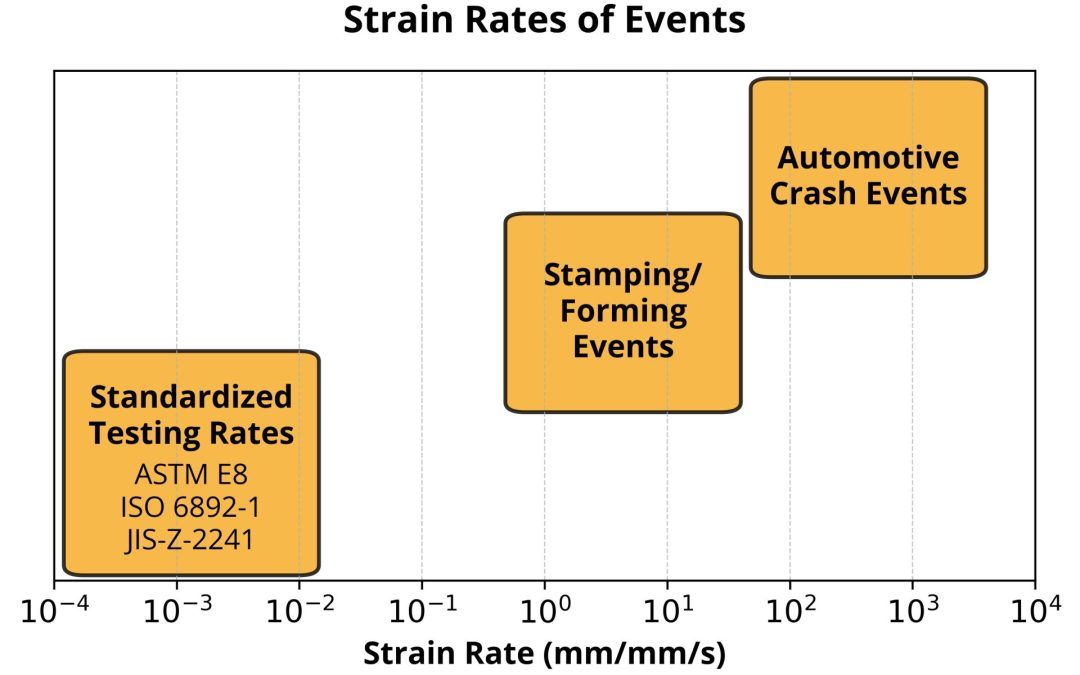
Modern vehicle structures rely heavily on AHSS grades to meet increasingly stringent requirements for crashworthiness and mass reduction. Components such as B-pillars, rocker reinforcements, crash rails, and door intrusion beams are designed to absorb energy through controlled deformation. During a crash, these components experience strain rates on the order of 10² to 10³ s⁻¹ —several orders of magnitude higher than the ~10⁻⁴ s⁻¹ strain rates in conventional tensile testing (Figure 1). As a result, properties like yield strength and ultimate tensile strength derived from these quasi-static tests are insufficient descriptors of in-service behavior.
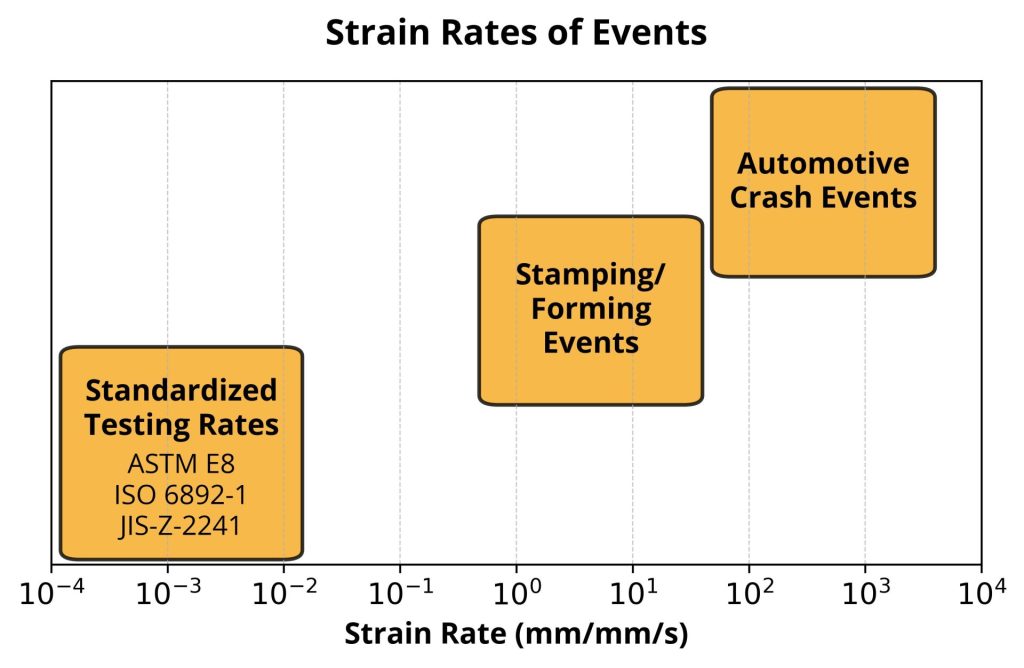
Figure 1 Strain Rates of Various Events Including Testing, Forming, and Crash
For steels used in these applications, strain rate sensitivity becomes a primary material characteristic. Most automotive steels exhibit positive strain rate sensitivity, meaning their flow stress increases with increasing strain rate. From a design standpoint, this could be advantageous: higher dynamic strength translates to improved energy absorption and greater resistance to intrusion during a crash. However, the magnitude of this effect varies across steel families. Dual-phase (DP) steels, for example, can show a more pronounced increase in flow stress compared to transformation-induced plasticity (TRIP) steels, while martensitic grades may exhibit relatively lower sensitivity. These differences must be quantified experimentally to ensure that simulation models accurately capture the structural response.
Modeling Strain Rate Sensitivity — Cowper-Symonds vs. Johnson-Cook
This is where high strain rate testing becomes directly integrated into the material characterization workflow. Automotive OEMs and suppliers generate stress-strain curves across a range of strain rates, typically spanning quasi-static (~10⁻⁴ s⁻¹), intermediate (~1 to 10² s⁻¹), and high-rate (~10² to 10³ s⁻¹) regimes. These datasets are then used to calibrate constitutive models implemented in crash simulation software such as LS-DYNA or Abaqus. Models like Cowper–Symonds or Johnson–Cook incorporate strain rate terms that scale the flow stress, but their predictive capability depends entirely on the quality and range of the underlying experimental data (Figure 2, Figure 3, Figure 4).
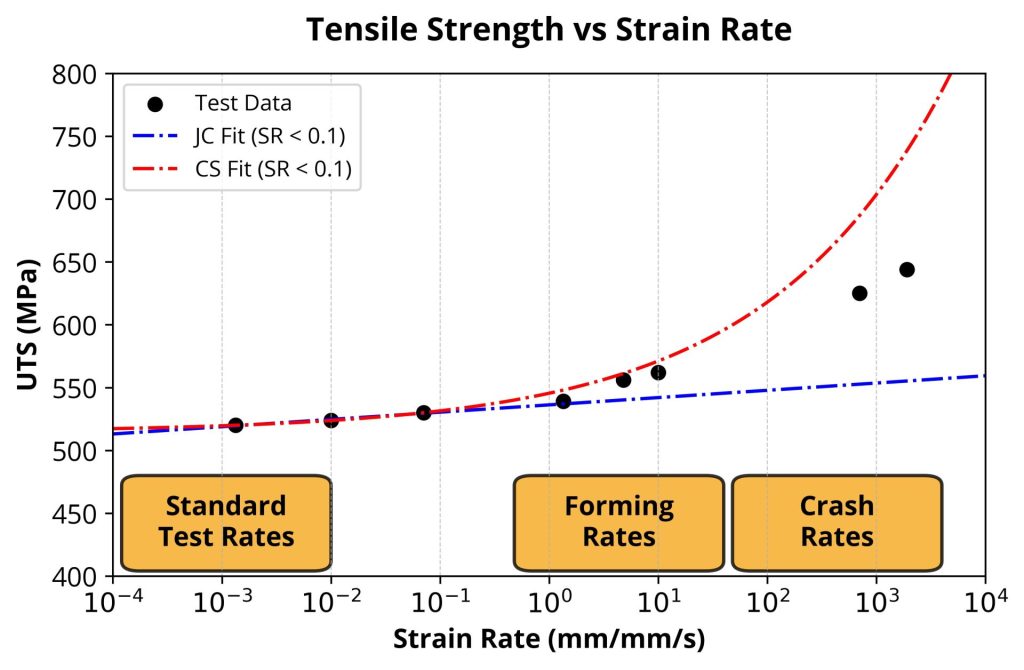
Figure 2 Cowper-Symonds and Johnson-Cook Strain Rate Sensitivity Model fit to Low-Rate Experimental Data
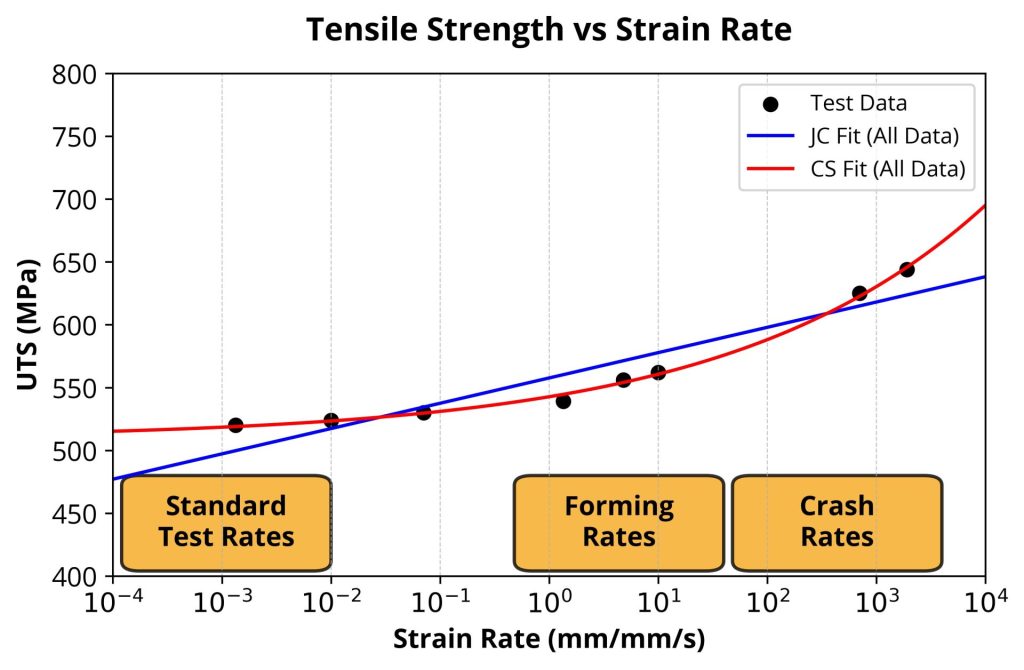
Figure 3 Cowper-Symonds and Johnson-Cook Strain Rate Sensitivity Model fit to All Experimental Data
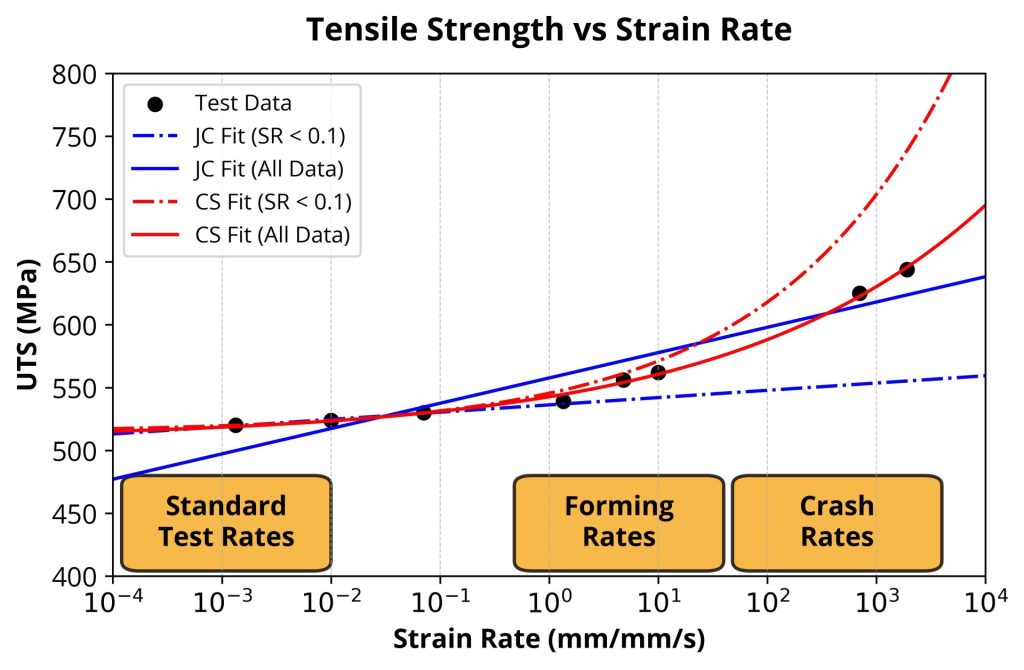
Figure 4 Cowper-Symonds and Johnson-Cook Strain Rate Sensitivity Model fit to Low-Rate and All Experimental Data
Testing Methods — From Servo-Hydraulic Systems to Split Hopkinson Bar
The testing approach itself is tailored to the strain rate regime of interest. For intermediate rates relevant to forming-to-crash transitions, servo-hydraulic test systems are commonly used. These systems are modified with high-flow servo valves and low-compliance load trains to achieve rapid loading. For higher strain rates typical of crash events, split Hopkinson bar techniques are employed.
Specimen Design and Digital Image Correlation (DIC) Strain Measurement
Specimen geometry and preparation are also influenced by the intended application. Sheet steels used in automotive structures are typically tested in configurations that preserve their rolling direction and thickness, as anisotropy can influence both strength and failure behavior. In addition, special specimen geometries that induce non-uniaxial stress conditions (notched-tensile and tensile-shear specimens) are critical to understand failure modes such as fracture strain and localization, both of which directly impact crash performance.
As a result, full-field strain measurement techniques like digital image correlation (DIC) are widely adopted (Figure 5). DIC enables accurate capture of strain localization and strain rate distribution across various specimen geometries, which is particularly important for calibrating damage and failure models such as Hosford-Coulomb and General Incremental Stress-State dependent Damage Model (GISSMO).

Figure 5. Example of Full Field Digital Image Correlation Strain Mapping of High Strain Rate Tensile Test
Inertia, Stress Wave Propagation, and Load Ringing
Perhaps the most important factor in high strain rate testing is inertia and stress wave propagation. Automotive steels are typically tested in sheet geometries that are relatively thin. Thin specimens gripped with bulky grips often create non-uniform stress states during rapid loading. Non-uniform stress states produce oscillations (often called “load ringing”) in the resulting stress data (Figure 6). Ensuring stress equilibrium within the specimen is essential for obtaining valid data. This often requires careful design of the test setup, including grip size and specimen length.
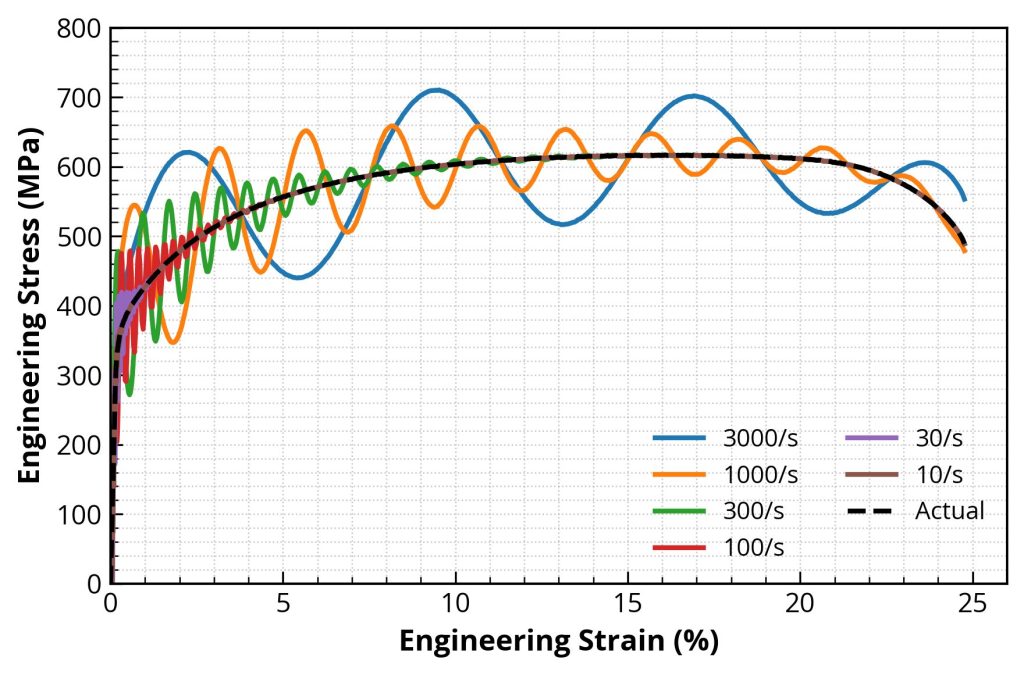
Figure 6 Example of Growth of Load Ringing in High-Strain-Rate Test Data
From Material Data to Crash Performance Prediction
From an application standpoint, the ultimate goal of high strain rate characterization is to enable accurate prediction of component-level and system-level crash behavior. For example, in a frontal collision, the progressive folding of a front rail or crash box depends on the dynamic flow stress of the steel, as well as its strain hardening and failure characteristics. Similarly, side-impact performance is heavily influenced by the behavior of B-pillar reinforcements under high-rate loading. Without accurate high strain rate data, simulations may underpredict or overpredict intrusion, energy absorption, and failure, leading to suboptimal designs or costly physical test iterations.
Standardization Challenges — ISO 26203 and Lab-to-Lab Variability
Standardization efforts, such as ISO 26203, have helped bring consistency to high strain rate tensile testing, but variability still exists across laboratories. Many factors contribute to these variances: unstandardized specimen geometries and gripping methods, variances in specimen loading conditions, lower quality strain measurement techniques, and non-optimized fixturing for wave transmission and measuring. For automotive applications, this variance places a premium on internal validation—correlating material test data with component-level crash tests to ensure that the material model behaves correctly within the simulation environment.
Key Takeaways
High strain rate testing is a foundational tool in the characterization of automotive steels, directly linking material behavior to vehicle safety performance. It provides the data necessary to describe how steels respond under crash-relevant loading conditions, informs the calibration of constitutive and failure models, and ultimately enables engineers to design lighter, safer vehicle structures with confidence in their predictive simulations.
For additional information, please visit our page on High Strain Rate Testing.
Many thanks to our authors, Trey Leonard and Dr. Danny Schaeffler.

Trey Leonard is the founder and CEO of Standard Mechanics, LLC, where he delivers advanced mechanical testing services and solutions across a wide range of applications, with expertise spanning static and dynamic formability, fatigue, and strain rate sensitivity testing.
 Danny Schaeffler is the Metallurgy and Forming Technical Editor of the AHSS Applications Guidelines available from WorldAutoSteel. He is founder and President of Engineering Quality Solutions (EQS). Danny is passionate about training new and experienced employees at manufacturing companies about how sheet metal properties impact their forming success.
main-blog, News
Introduction: Welding with Micro-Alloyed Wire
In automotive vehicle assembly, gas metal arc welding (GMAW) plays an important role: Unlike the dominant resistance spot welding, it is not used as a bulk joining process, but rather specifically to meet the unique requirements of selected components in modern vehicle structures. GMAW of AHSS causes grain coarsening and a brittle weld zone mechanical behaviour.
To reduce this effect, GMAW filler wires are typically alloyed with Nickel (Ni), enabling a more ductile weld structure. To strengthen the welds even further, new alloying concepts have been developed that utilizie micro-alloying of Silicon (Si), as well as Niobium (Nb) and Chromium (Cr) to create finer, more interlocked weld microstructures with an increased fraction of retained austenite (e.g. Posco PosZET® and PosZET® GIGA process).
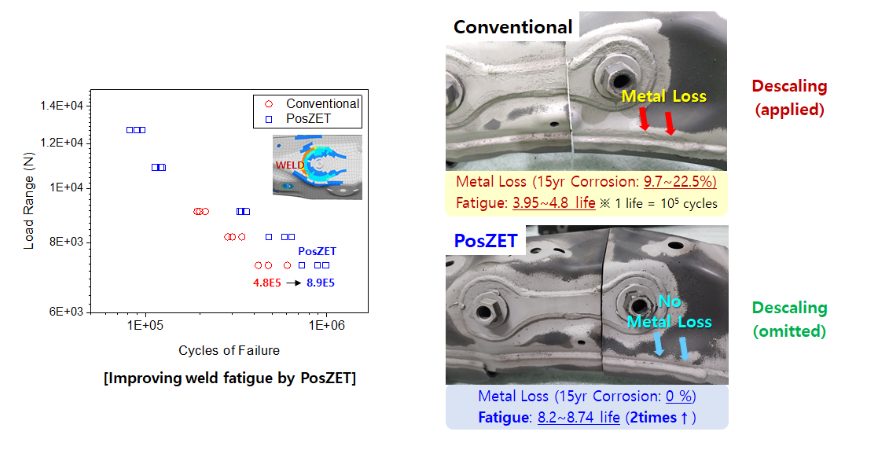
Fig. 1. Improved corrosion and fatigue achieved with micro-alloyed welding wire
Fig. 1 illustrates an application of micro-alloyed welding wire to a lightweight cradle chassis part. A significant improvement in corrosion behaviour is observed even though the extra cleaning (acid de-scaling) step is not applied to the sample using the new wire. When manufactured parts can withstand corrosion, this acid descaling process can be removed, helping to reduce production cost and rendering the production process more eco-friendly.M-71
Due to the relatively stronger arc (thermal pinch) force when using GMAW filler wires, which improves the efficiency of weld penetration, the input current during welding can be lowered. The width of the weld heat-affected zone (HAZ) is therefore reduced, improving weld fatigue (see left graph of Fig. 1).
The advantages of micro-alloying also apply to the highest strength levels in AHSS welding. Achieving strength of the welded part is of paramount concern, particularly because the use of ultra-high-strength steels enables significant weight reduction through material thickness reduction while maintaining structural performance. This is especially critical in electric vehicles (EVs), where battery weight increases overall vehicle mass and creates strong pressure for lightweight design in other structural components. To this end, some high-strength welding wires that were previously cost-prohibitive for application in the automotive market have recently been mass-produced to meet electrical vehicle (EV) weight reduction pressures.
Metallurgical effects of micro-alloying
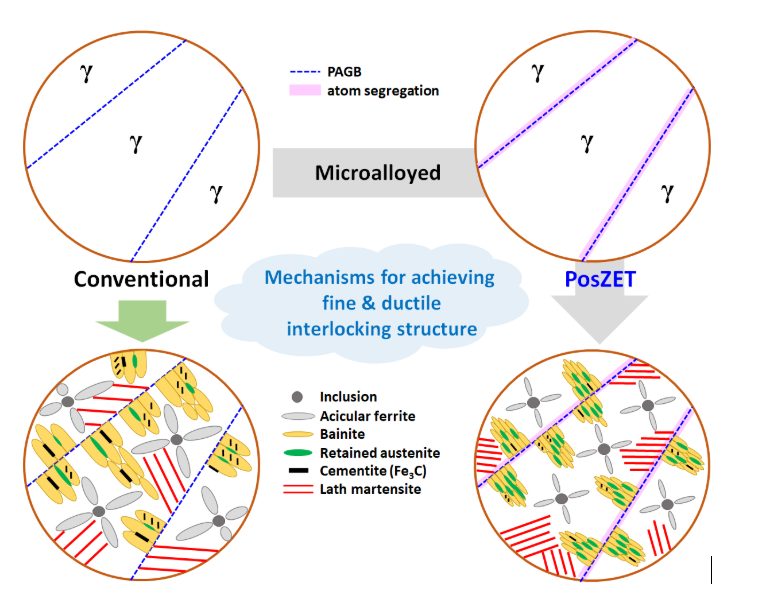
During the welding process, mechanical properties deteriorate; the degradation is caused by grain coarsening or the formation of brittle phases that compromise product longevity. Fig. 2 illustrates the concept of utilizing the micro-alloying elements (e.g. Cr + Nb), in lieu of Ni. During the transition from austenite to acicular ferrite and bainite, the specific alloying design lowers the phase transformation temperature by increasing hardenability and segregating specific element atoms along the prior austenite grain boundaries, rendering finer interlocking microstructures in welds.
Fig. 2. Grain refinement through the addition of Niobium and Chromium
(PAGB: Prior Austenite Grain Boundaries)
In addition, the reduced phase transformation temperature impedes the formation of cementite during bainite transformation; therefore, retained austenite fraction increases. The addition of micro–alloying elements also discourages the activity of carbon atoms, suppressing the precipitation of cementite. The outcome is shown in schematically Fig. 2. By forming the finer interlocking microstructure and the higher fraction of film-like retained austenite, the new alloying design creates ultra-strong and ductile steel welds with enhanced tensile properties, impact toughness, and fatigue strength aiming to improve GMAW weldability of 980 MPa or higher strength steels.
These enhancements are achieved at 45% lower material cost and reduced environmental impact because Ni, a costly metal, is removed. The retained austenite absorbs initial strain during tensile deformation; hence, through the transformation-induced plasticity (TRIP) effect during austenite transformation to martensite, ductility is improved. These remarkable improvements in the impact and fatigue properties of the welds are associated with the refinement of the interlocking microstructure with high fraction film-like retained austenite. In other words, refined hierarchical interlocking microstructure and the interruption of crack propagation supported by ductile retained austenite films (as shown in Fig. 3) contribute to greater impact toughness and fatigue resistance properties.
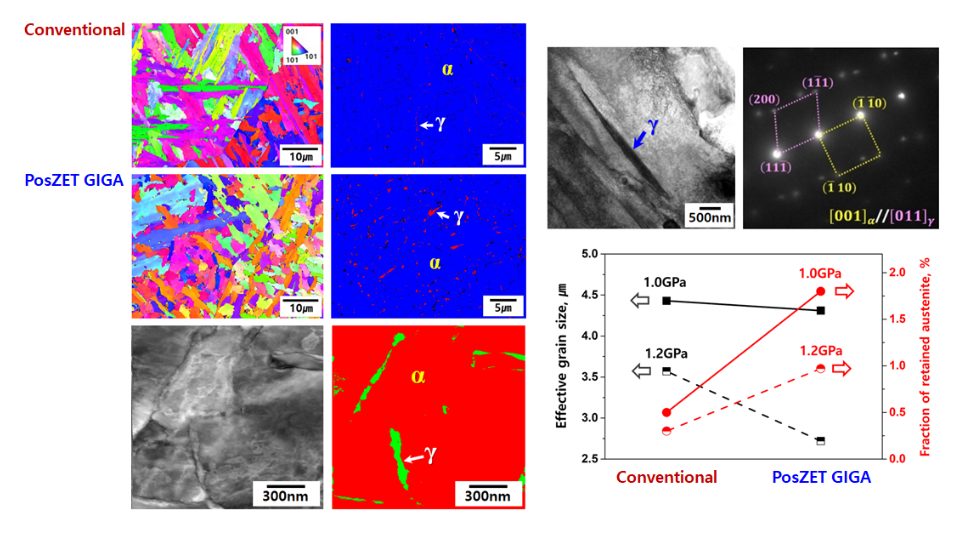
Fig. 3. Hierarchical architecture of the ultrastrong and ductile steel welds
Market solution and application to wheel hub welding
Nb and Cr micro-alloyed welding wires are commercially available from POSCO under the PosZET® GIGA brand for strength levels of 980 MPa and higher. These welding wires are currently in the final stages of approval for serial production by global OEMs for application in their new vehicle line-ups.
For strength levels up to 780 MPa, a micro-alloyed wire with low Si is available under the PosZET® AHSS brand from POSCO. Fig. 4 illustrates an application study of the welding wire used for the weld of a lightweight wheel hub. In hot-rolled (HR) steel plates for wheels, thermal decomposition and gasification of the surface scale can cause porous defects in the welded part, requiring occasional repair welding.
Using micro-alloyed wire removes the need for such repairs. Secondly, spatter adhesion inhibitors are often applied due to welding spatter; with the newly developed wire, spatter generation declines by 80%, removing the need for inhibitors, thereby cutting cost. In addition, the arc force is enhanced, improving weld penetration efficiency; therefore less welding power (i.e., lower welding current/voltage) is required for greater welding productivity (i.e., faster welding speed). An approximate 10 % productivity gain is observed with 15% power reduction, resulting in lower CO2 emissions.
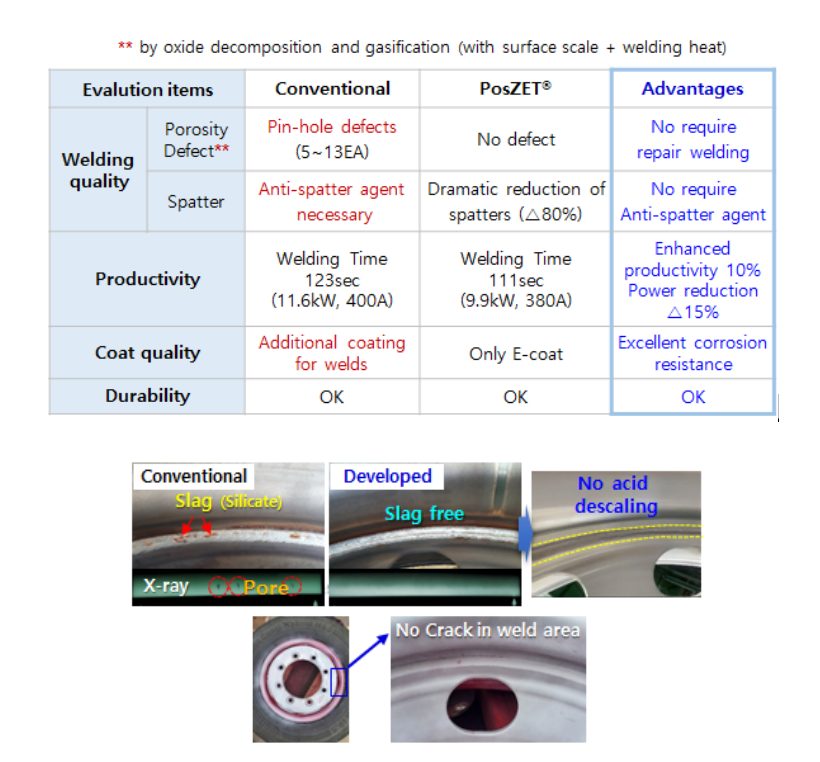
Fig. 4. Crack- and slag-free welds demonstrated on a commercial wheel hub weld
Welding an EV lightweight cradle with micro-alloyed wire
Fig. 5 depicts an application of low Si micro-alloyed wire to the lightweight cradle parts of mass-produced vehicle models, revealing the result after a 15-year corrosion test. The samples exhibit significant corrosion in the weld using conventional welding wire and no corrosion when utilizing the micro-alloyed wire.
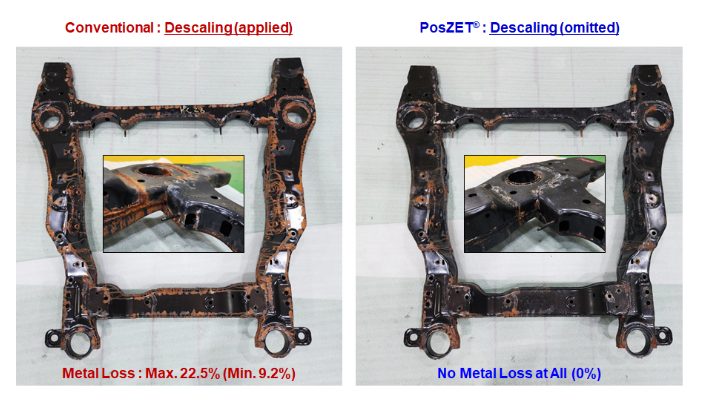
Fig. 5. Corrosion test result for lightweight cradle part of an EV
Outlook
GMAW of AHSS using micro-alloyed filler wires offers significant potential for automotive manufacturing. Targeted microalloying allows for the optimization of strength, toughness, and the heat-affected zone of the welds, which is crucial for crash performance and corrosion resistance. This technology opens new possibilities for lightweight construction and series production, particularly for electric vehicles, modular body structures, and safety-critical components.

A special thank you to our author, Dr. Gyuyeol Bae. Bae is the Team Lead of the Automotive Materials Solution Research Group Solution R&D Center in the Technical Research Laboratories of POSCO in South Korea.
homepage-featured-top, main-blog, News
How Advanced High-Strength Steels Solve Cold Stamping Challenges in Automotive Body Structures
Introduction
In the automotive industry, manufacturing complex, high-strength deep-drawn parts using cold forming processes can create new challenges not previously encountered with body structures made from historically available conventional steels.
Compared with even a decade ago, automotive engineers today have significantly more steel grades to choose from in their quest to balance properties, performance, manufacturability, sustainability, and cost. The use of modern, 3rd-generation Advanced High-Strength Steel (AHSS) grades, for example, offers a combination of high strength and ductility that presents manufacturers with an alternative to Press Hardening Steels (PHS).
Advanced High Strength Steels
- Conventional Dual Phase Steels — Feature a microstructure of ferrite and martensite, offering excellent formability in the drawing and stretching deformation modes. However, the characteristics of this phase combination that work very well in these deformation modes lead to challenges in bending and edge-stretch deformation.
- Complex Phase Steels — Offer superior performance in bending and edge-stretch deformation due to their more homogenous microstructure and reduced hardness gradients, but do not match comparable-strength dual phase steels in drawing and stretching performance.
- 3rd Generation Advanced High-Strength Steels —A family of grades engineered to combine the best features of dual phase and complex phase steels while minimizing their respective limitations — making them a compelling option for challenging automotive stampings.
Industrial applications of advanced-grade sheet metal for vehicle bodies can require different techniques and approaches than those used to successfully form parts from high-strength low-alloy (HSLA) steels.
Manufacturing Challenges for Cold-Stamped B-Pillars
B-Pillars — also called center pillars — are among the most challenging components for cold stamping applications in modern vehicle design. Current IIHS side impact crash requirements, which simulate a collision with an SUV, are particularly stringent and pose a dual engineering challenge:
- The upper section must be of sufficiently high strength to prevent cabin intrusion during a side impact.
- The lower section must maintain at least moderate ductility to absorb crash energy.
One approach to increase pillar stiffness is to realize a deeper draw depth and more complex shape, yet the necessary formability to achieve these are typically limited by the high strength requirements for crash performance.
The door opening regions require flanges to facilitate the joining of outer and inner shell components. Manufacturing cycle times and cost sensitivity dictate that blank edges are typically formed by mechanical shearing rather than laser cutting—a process that generally reduces edge quality. Forming the targeted part shape places these shear-cut edges in tension, exposing higher-strength steels to the risk of edge cracking.
The combination of these challenges often results in auto manufacturers forming B-Pillars and even entire door rings by hot stamping PHS. This manufacturing method enables complex-shaped sheet designs that meet stringent crash requirements while minimizing the splitting problems or formability limitations complicating production.
Given the global commercial availability of 3rd Generation AHSS, cold stamping approaches can again be considered for the production of crashworthy B-Pillar components.
Case Studies: Cold-Stamped B-Pillars Using AHSS
B-Pillar Upper — Solving Edge Cracking with High Hole Expansion Steel
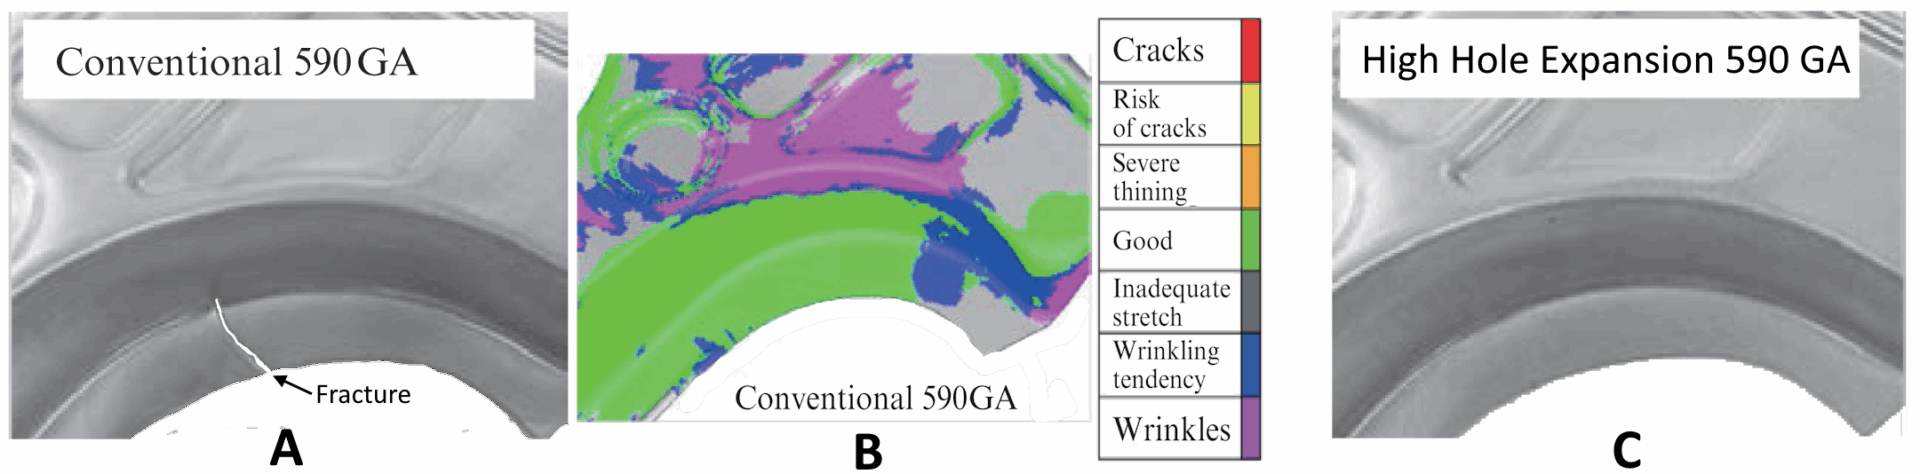
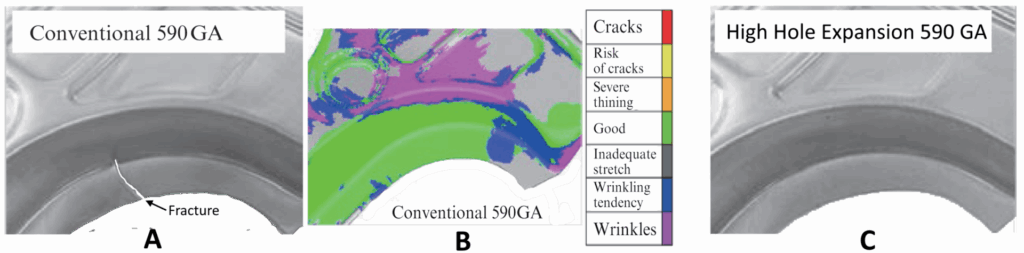
When forming shear-cut blanks into B-pillar upper shapes, metal flow places cut edges into tension along the highly arched front- and rear-door opening regions adjacent to the B-pillar. Edge cracking propagating into the part — as seen in Figure 1A — is a frequent outcome.
Adding to this complexity is that forming simulations have difficulty predicting the failure risk of shear-cut edges. A contour plot of a forming simulation (Figure 1B) may give a false impression of no cracking or splitting risk in this critical area.
Blank design countermeasures alone can only accomplish so much. However, the steel industry now offers AHSS options at the same tensile strength—with up to twice the cut-edge ductility as conventional dual-phase steel. This can be verified using the hole expansion test. The same part and process design with the high hole expansion steel is capable of achieving the targeted part dimensions and characteristics as shown in Figure 1C.
Figure 1: B-Pillar Upper stamped from 590 GA (a conventional galvannealed steel with 590 MPa minimum tensile strength, shown in A) and HHE 590 GA (a steel with 590 MPa minimum tensile strength engineered for high hole expansion, shown in C). The simulation of the conventional 590 GA does not indicate forming issues, as shown in image B. [Citations J-30, S-125]
B-Pillar Lower — Overcoming Split Risk with 3rd Generation AHSS
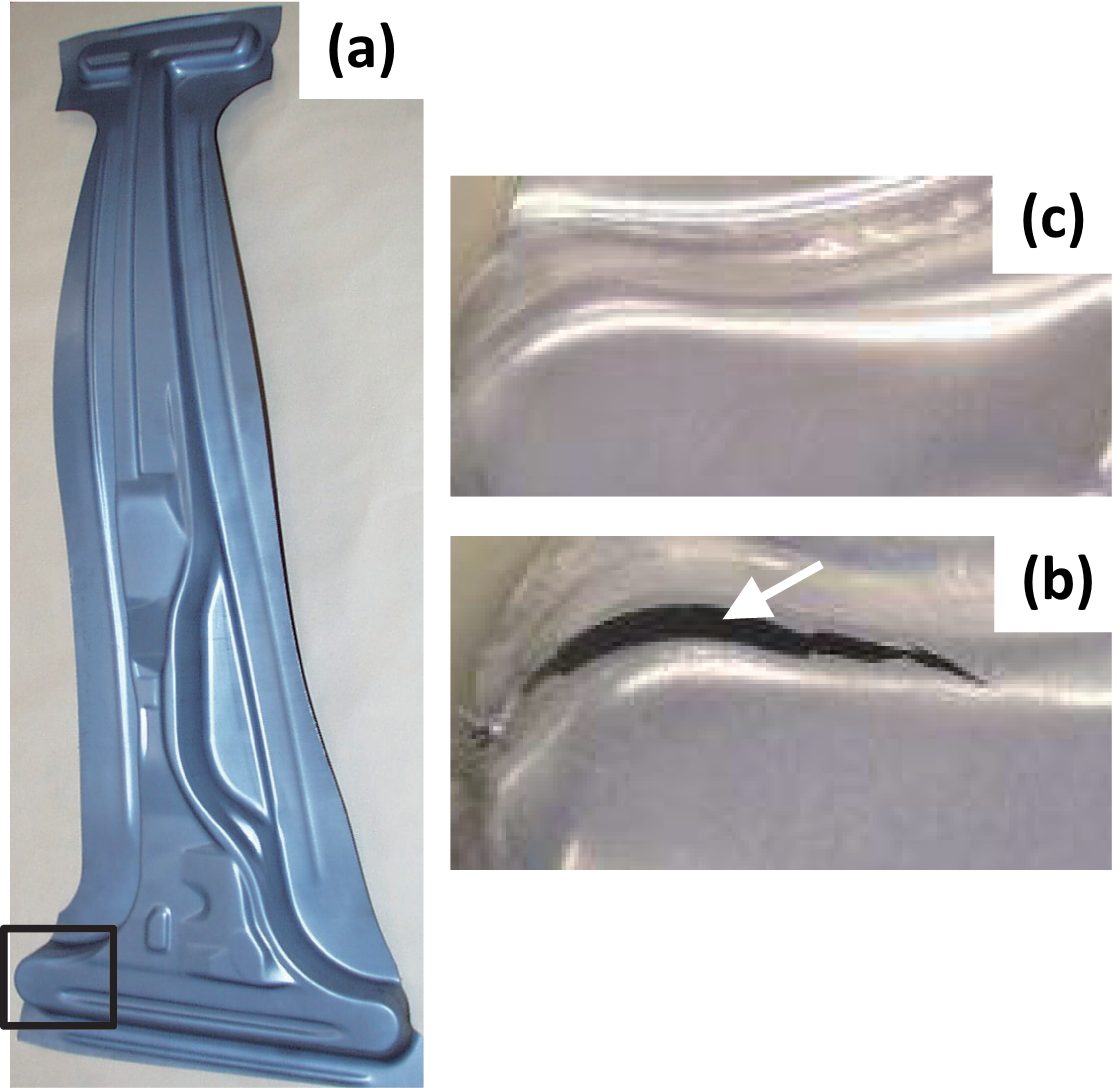
In B-Pillars, controlled structural deformation to targeted loading levels is required to absorb the kinetic energy of an impacting body. OEMs typically design B-Pillar Lowers (Figure 2A) to absorb side impact crash energy, while the upper section counteracts load on the body structure to minimize intrusion into the passenger cell.
The lower horizontal area of the B-Pillar supports the rocker assembly, requiring a relatively deep draw depth to follow the contours of adjacent components and create a solid hinge connection for B-Pillar kinematics. From a formability perspective, these deep draws and complex geometries put stampings at significant risk of splits due to insufficient elongation and n-value. An example of a split in this area is shown in Figure 2B.
After switching to a 3rd Generation AHSS grade of equivalent tensile strength—but with greater elongation and n-value—the same deep-draw part design can be stamped without splits (Figure 2C).
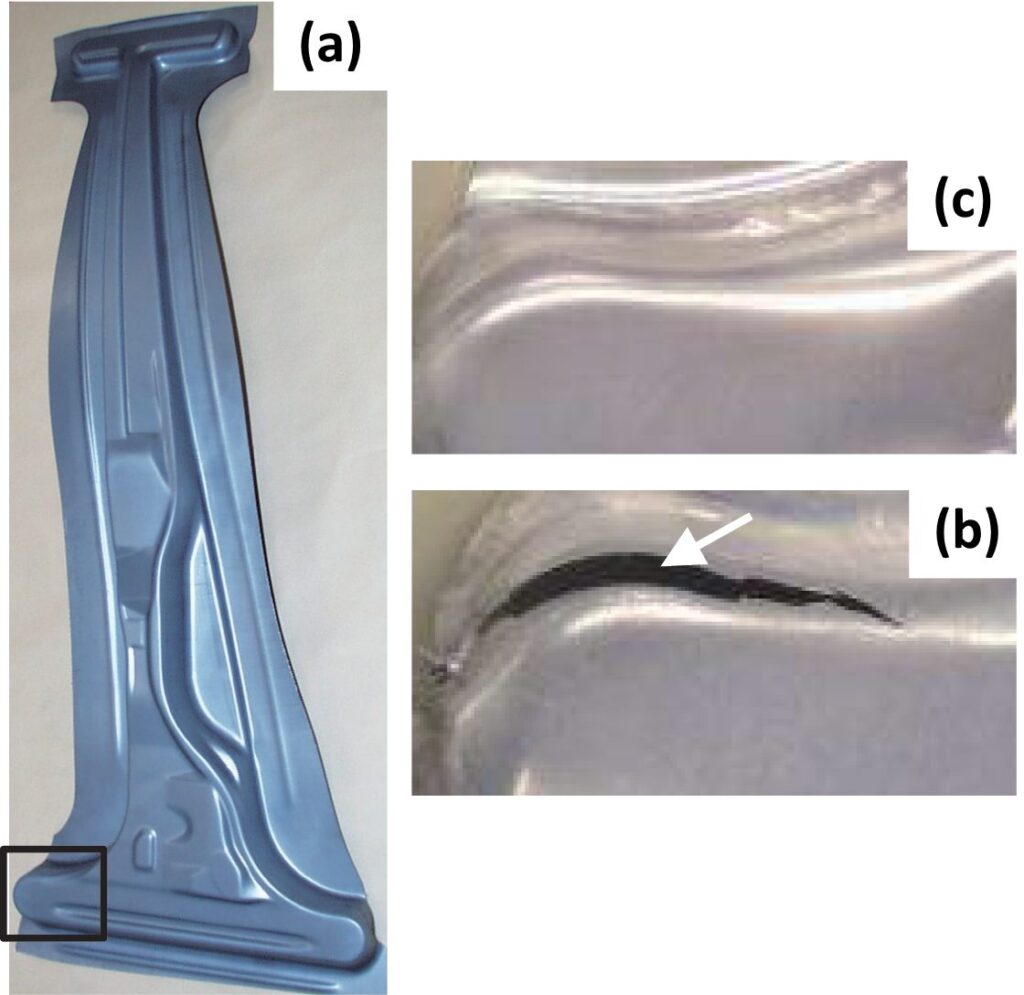
Figure 2: B-Pillar Lower (shown in A) splits when made from a 1st Generation AHSS grade with 980 MPa minimum tensile strength (shown in B), yet remains split-free when made from 3rd Generation AHSS of the same tensile strength (shown in C). [Citations J-30, S-125]
3rd Generation AHSS in Automotive Series Production
Despite the dominance of PHS in B-Pillar and door ring construction, 3rd Generation AHSS solutions are a viable alternative and have been deployed in production vehicles. Recent model year examples include:
2023 Suzuki Fronx: B-Pillar [C-49, S-131]
2023 Chevrolet Blazer EV: B-Pillar [E-14]
2022 Nissan Ariya: B-Pillar [N-35, N-36]
2022 Toyota bZ4X/Subaru Solterra: Lower B-Pillar. [I-28, S-132]
Third Generation AHSS are also found in other parts which have rigorous mechanical load requirements and high drawing ratios, such as front longitudinal beams and seat cross members.. These applications compete with PHS but with a much greater spread in series production than in B-Pillars.
Explore More AHSS Alloy Selection Guidance
For additional case studies on other automotive parts and detailed guidance on aligning your steel grade selection to the needs of the part, visit: Case Studies in Alloy Selection
Danny Schaeffler is the Metallurgy and Forming Technical Editor of the AHSS Applications Guidelines available from WorldAutoSteel. He is founder and President of Engineering Quality Solutions (EQS). Danny wrote the monthly “Science of Forming” and “Metal Matters” column for Metalforming Magazine, and provides seminars on sheet metal formability for Auto/Steel Partnership and the Precision Metalforming Association. He has written for Stamping Journal and The Fabricator, and has lectured at FabTech. Danny is passionate about training new and experienced employees at manufacturing companies about how sheet metal properties impact their forming success.
Blog, homepage-featured-top, main-blog, News
Resistance spot welding (RSW) is the most utilized joining process in car body assembly with exceptionally high demands on quality and reproducibility. Expulsion in RSW leads to ejection of metal from the weld and can cause equipment deterioration and re-working.
As the RSW process has many variables both from the process itself and from the to-be-welded component, prediction and avoidance of expulsion is challenging. This creates a large demand for new technologies that allow for RSW of steels with improved expulsion control.
Recent developments aim to predict – and ultimately avoid – expulsion using artificial intelligence data analysis. Process data on current, voltage and dynamic resistance are readily available in RSW and can be augmented with simulation data for non-measurable phenomena such as the nugget growth rate to create predictive algorithms that eventually aim to avoid expulsion altogether.
An Introduction to AI Expulsion Prediction
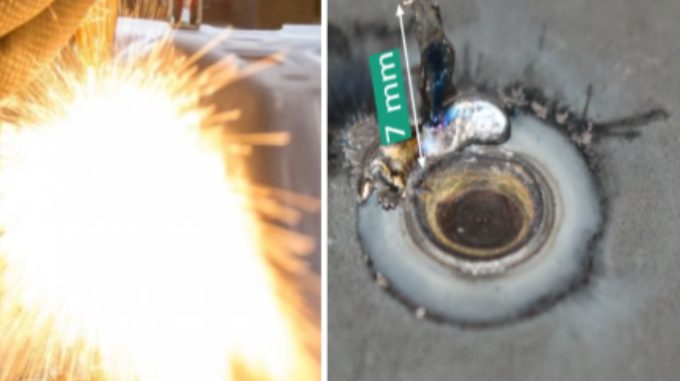
This work focuses on utilizing artificial intelligence modeling for the prediction of expulsion during resistance spot welding (see Figure 1 for an image of expulsion on the left and metal residue on the surface after expulsion on the right). The primary objective is to forecast the formation of expulsion before it occurs, with the aim of improving the quality of the welding process. This effort is supported by a dataset of 500 welded spots of 2-sheet stack-ups made from one advanced high-strength steel (AHSS) and one mild steel joining partner. Two sequential AI models are trained: one for nugget growth prediction and another for spatter prediction.
Figure 1: Left: Expulsion leads to the ejection of molten metal. Right: Residues may form on the surface after expulsion.
Feature Engineering
A key aspect is the integration of multi-source data: The models leverage both static and dynamic inputs. Static inputs include input process parameters such as current, force, and weld time, which are set at the machine in accordance with a pre-determined weld lobe. Dynamic inputs encompass transient process signals like dynamic resistance and electrode force. In resistance spot welding, this data is usually readily available, because the welding power source measures electric flow and weld gun opening and forces. A further step is to include non-measurable data from simulation results concerning nugget growth rate.
To give time for process intervention, the predictive quality of the models was determined after only 30 ms of welding time, depicted in Figure 2.
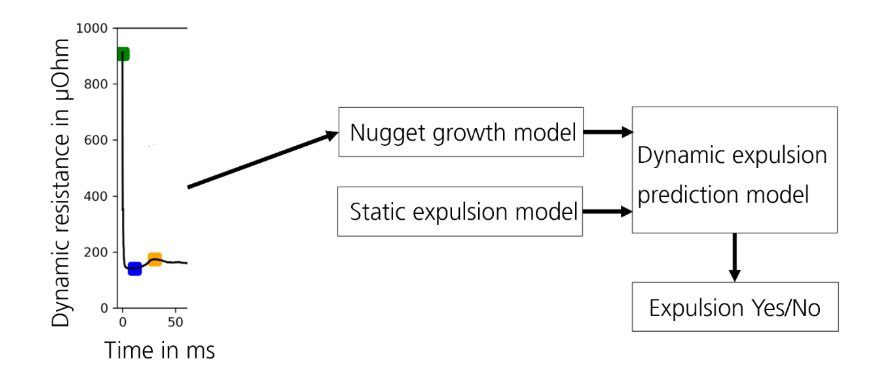
Figure 2: Only 30 ms of dynamic resistance measurements are used as input for the AI models.
Data evaluation and feature engineering are critical components of the modeling process. A welding and data-science expert needs to identify significant features from sensor time series data as input for the neural network AI models. These features can be physically meaningful, such as the minimum resistance during the process, or purely statistical with values such as longest continuous time above the average resistance.
The simulation of resistance spot welding allows for the extraction of the non-measurable nugget growth rate. It is well documented that the nugget growth rate strongly correlates with expulsion formation and conducting simulations for different welding cases (gaps, misalignments, slightly changed contact resistances…) can add this physical behavior to the data-driven AI model. Figure 3 depicts different nugget growths extracted from the simulation with different welding currents. High currents lead to significantly faster growth rates and facilitate expulsion.
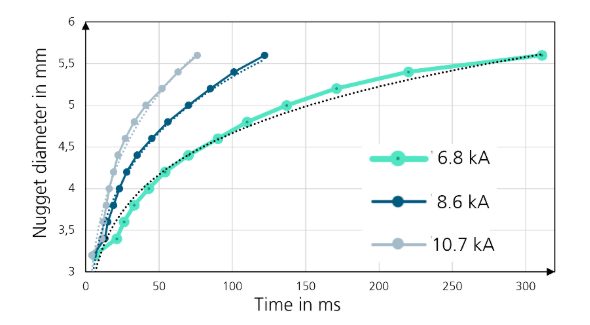
Figure 3: Weld nugget growth behavior for different welding currents extracted from a numerical welding simulation. Solid lines are simulation results; dashed lines depict a polynomial fit used to reduce data for AI input.
Model Accuracy
Figure 4 depicts the confusion matrices for the three different models. The bottom left and top right fields are the desired predictions, and the other fields depict false results of the models. The first model stage, which relies solely on static inputs, yields moderate prediction quality. However, when dynamic data from experiments and simulations are included, the prediction quality jumps to approximately 96%. The analysis focusing on the first 30 milliseconds to give time for subsequent intervention in the process, achieves a reduced, but still good, result quality of around 90%. Further improvements in prediction accuracy are expected with additional data.
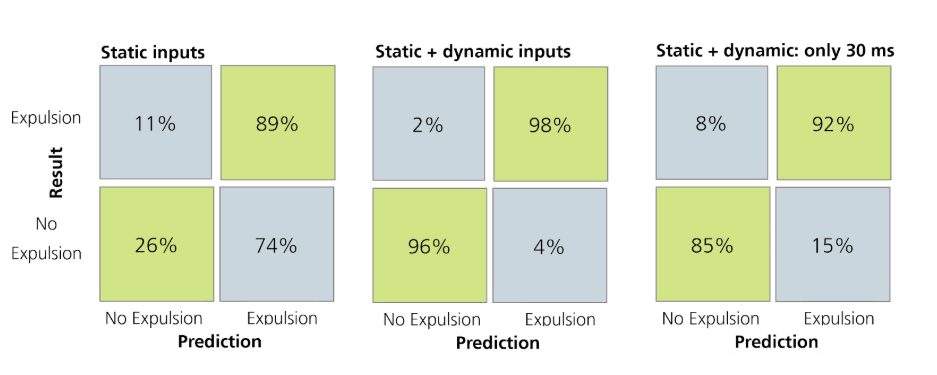
Figure 4: Confusion matrices for static, static and dynamic and static and dynamic: only 30 ms inputs. A reliable prediction is possible using dynamic process and simulation data. If only 30 ms of dynamic data are utilized the predictive quality decreases.
The presented approach uses a data-driven AI model with different levels of input data to predict resistance spot welding expulsion. The data-gathering and feature engineering procedures are highlighted, explaining a need for in-depth knowledge of the welding process as well as data engineering. The approach yields a neural network with excellent predictive quality, if dynamic data is included in the model. Even if only 30 ms of transient data are used to allow for a subsequent process intervention, the result quality is still good. It is expected that the predictive quality improves when the data set is increased and additional data sources both from measurements and simulations are included. This approach can improve the control of automotive welding systems and ultimately avoid excessive re-working and equipment wear due to expulsion in resistance spot welding of advanced high-strength steels.