Tensile Testing: Engineering Stress-Strain Curves vs. True Stress-Strain Curves
Metal forming simulation is particularly beneficial on the value-added parts made from advanced high strength steels, since accurate simulations allow for optimal processing with minimal recuts … at least when the right information is used as inputs.
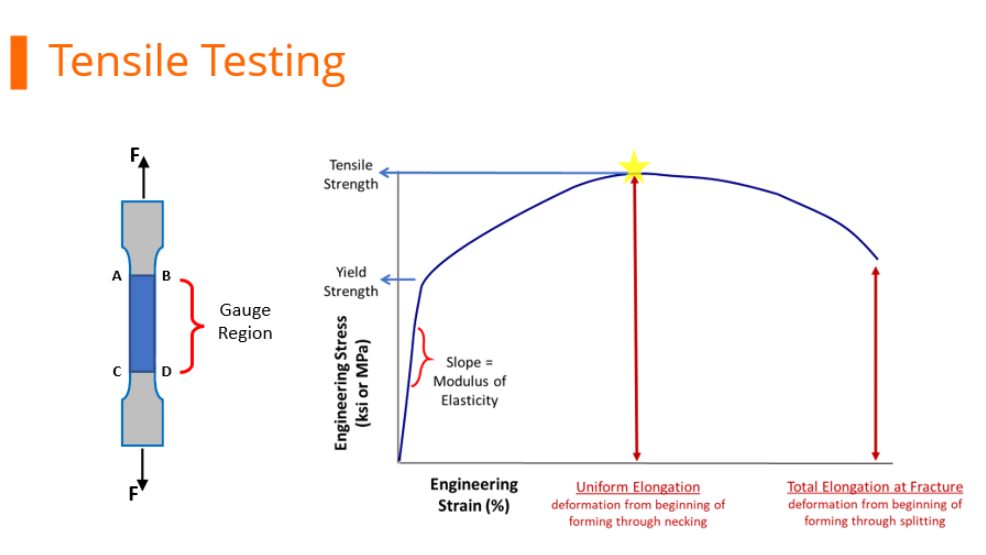
Tensile Testing
During tensile testing, a standard sample shape called a dogbone is pulled in tension. Load and displacement are recorded, and which are then converted to a stress-strain curve. Strength is defined as load divided by cross-sectional area. Exactly when the cross-sectional area is measured during the test influences the results.
Before starting the pull, it’s easiest to measure the width and thickness of the test sample.
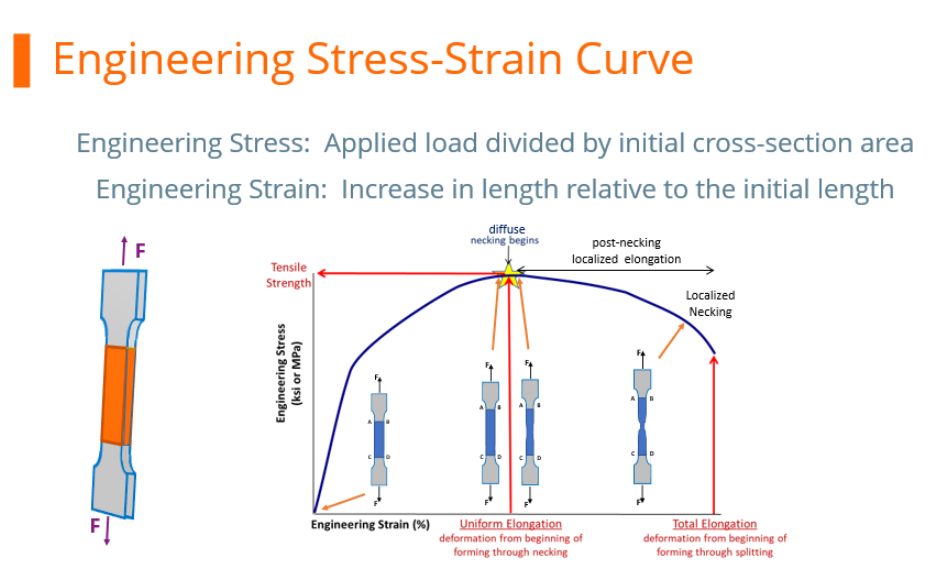
Engineering Stress-Strain Curve
At any load, the engineering stress is the load divided by this initial cross-sectional area. Engineering stress reaches a maximum at the Tensile Strength, which occurs at an engineering strain equal to Uniform Elongation. After that point, engineering stress decreases with increasing strain, progressing until the sample fractures.
However, metals get stronger with deformation through a process known as strain hardening or work hardening. As a tensile test progresses, additional load must be applied to achieve further deformation, even after the “ultimate” tensile strength is reached. Understanding true stress and true strain helps to address the need for additional load after the peak strength is reached.
During the tensile test, the width and thickness shrink as the length of the test sample increases. Although these dimensional changes are not considered when determining the engineering stress, they are of primary importance when determining true stress. At any load, the true stress is the load divided by the cross-sectional area at that instant.
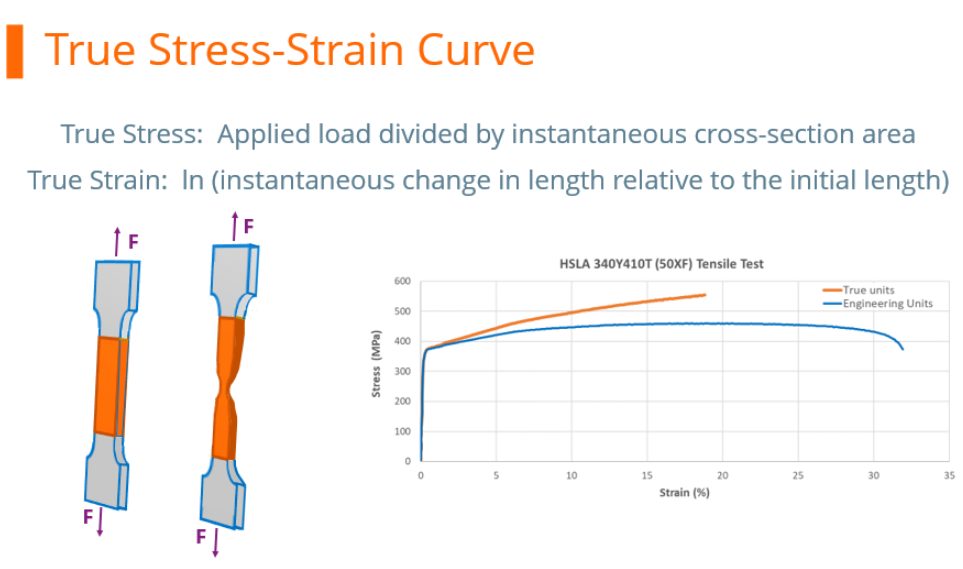
True Stress-Strain Curve
The true stress – true strain curve gives an accurate view of the stress-strain relationship, one where the stress is not dropping after exceeding the tensile strength stress level.
True stress is determined by dividing the tensile load by the instantaneous area.
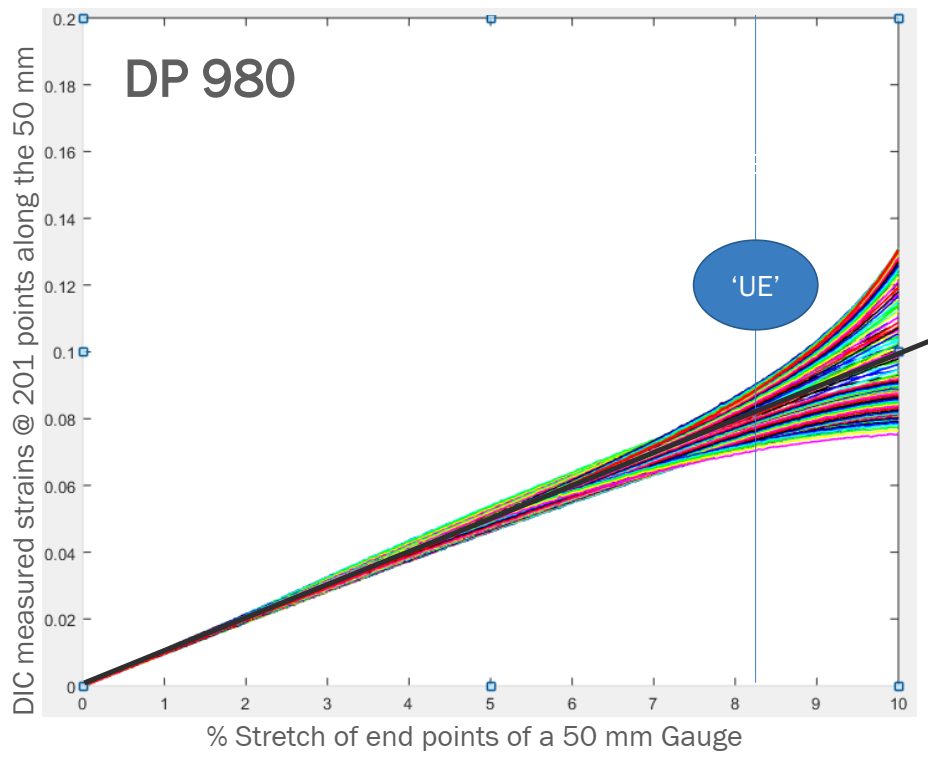
True stress-strain curves obtained from tensile bars are valid only through uniform elongation due to the effects of necking and the associated strain state on the calculations. Inaccuracies are introduced if the true stress-true strain curve is extrapolated beyond uniform strain, and as such a different test is needed. Biaxial bulge testing has been used to determine stress-strain curves beyond uniform elongation. Optical measuring systems based on the principles of Digital Image Correlation (DIC) are used to measure strains. The method by which this test is performed is covered in ISO 16808.
Stress-strain curves and associated parameters historically were based on engineering units, since starting dimensions are easily measured and incorporated into the calculations. These are the values you see on certified metal properties, also called metal cert sheets that you get with your steel shipments.
True stress and true strain provide a much better representation of how the material behaves as it is being deformed, which explains its use in computer forming and crash simulations.
It’s much more challenging to get accurate dimensional measurements once the test has started unless there are multiple loops of the operator stopping the test, remeasuring, then restarting the pull. This is not a practical approach.
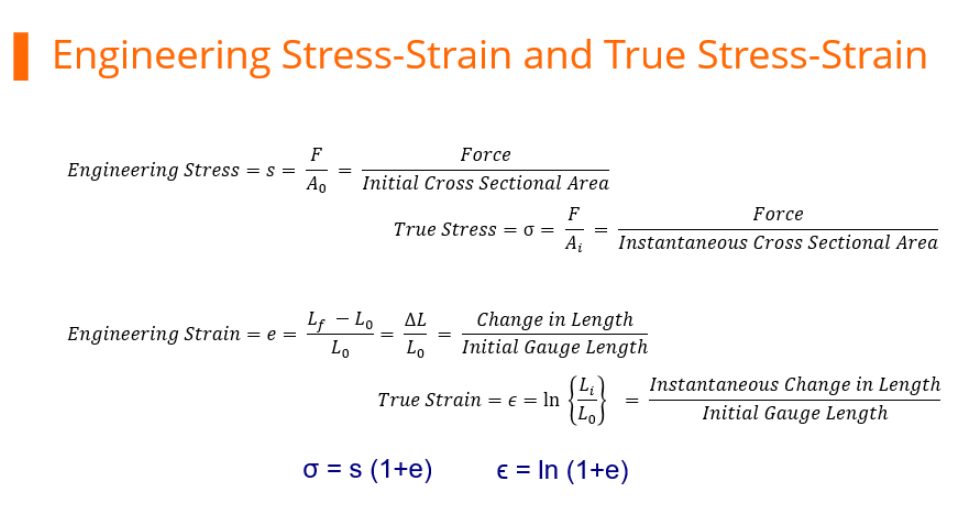
Fortunately, there are equations that relate engineering units to true units. Conventional stress-strain curves generated in engineering units can be converted to true units for inclusion in simulation software packages.
As the industry moves to more value-added stampings, metal forming simulation is done on nearly every part. The value-added nature of parts made from advanced high strength steels requires best practices be used throughout – otherwise the results from simulation drift further away from matching reality, leading to longer development times and costly recuts.

Danny Schaeffler is the Metallurgy and Forming Technical Editor of the AHSS Applications Guidelines available from WorldAutoSteel. He is founder and President of Engineering Quality Solutions (EQS). Danny wrote the monthly “Science of Forming” and “Metal Matters” column for Metalforming Magazine, and provides seminars on sheet metal formability for Auto/Steel Partnership and the Precision Metalforming Association. He has written for Stamping Journal and The Fabricator, and has lectured at FabTech. Danny is passionate about training new and experienced employees at manufacturing companies about how sheet metal properties impact their forming success.