Blog, homepage-featured-top, main-blog, News
Tailor-welded blanks (TWBs) allow the combination of different steel grades, thicknesses, and even coating types into a single blank. This results in stamping a single component with the right material in the right place for on-vehicle requirements. This technology allows the consolidation of multiple stampings into a single component.
One example is the front door inner. A two-piece design will have an inner panel and a reinforcement in the hinge area. As shown in Figure 1, a TWB front door inner incorporates a thicker front section in the hinge area and a thinner rear section for the inner panel, providing on-vehicle mass savings. This eliminates the need for additional components, reducing the tooling investment in the program. This also simplifies the assembly process, eliminating the need to spot weld a reinforcement onto the panel.
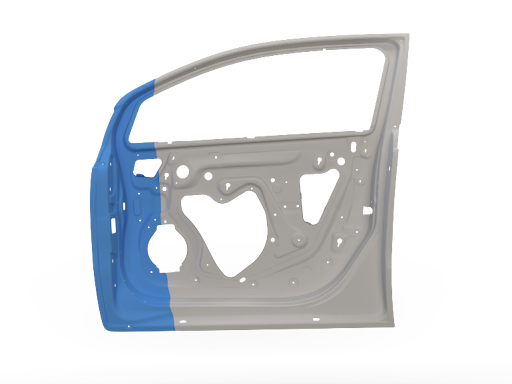
Figure 1 – Front Door Inner
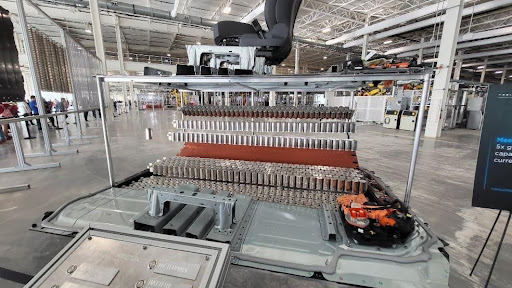
Today, large opportunities exist to consolidate components in a BEV in the battery structure. Design strategies vary from different automakers, including how the enclosure is constructed or how the battery mounts into the vehicle. The battery tray can have over 100 stamped components, including sealing surfaces, structural members, and reinforcements (Munro Live – Munro and Associates, 2023)M-68. As an idea, a battery tray perimeter could be eight pieces, four lateral and longitudinal members, and four corners. The upper and lower covers are two additional stamped components, for a total of ten stampings that make up the sealing structure of the battery tray. On a large BEV truck, that results in over 17m of external sealing surfaces.
Part consolidation in the battery structure provides cost savings in material requirements and reduced investment in required tooling. Another benefit of assembly simplification is improved quality. Fewer components mean fewer sealing surfaces, resulting in less rework in the assembly process, where every battery tray is leak-tested.
The deep-drawn battery tub is a consolidated lower battery enclosure and perimeter. This can be seen in Figure 2; a three-piece welded blank incorporates a thicker and highly formable material at the ends and in the center section, either a martensitic steel for intrusion protection or a low-cost mild steel. This one-piece deep-drawn tub reduces the number of stampings and sealing surfaces, resulting in a more optimized and efficient design when considered against a multi-piece assembly. In the previous example of a BEV truck, the deep-drawn battery tub would reduce the external sealing surface distance by 40%. To validate this concept, component level simulations of crash, intrusion, and formability were conducted. As well as a physical prototype built that was used for leak and thermal testing (Yu, 2024)Y-14 with the outcomes proving the validity of this concept, as well as developing preliminary design guidelines. Additional work is underway to increase the depth of the draw while minimizing the draft angle on the tub stamping.
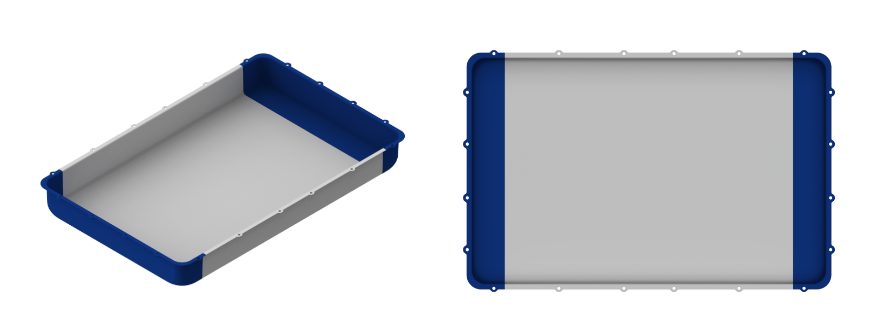
Figure 2 – Deep Battery Tub
In most BEVs today, the passenger compartment has a floor structure common in an ICE vehicle. However, the BEV also has a top cover on the battery assembly that, in most cases, is the same size as the passenger compartment floor. In execution of part consolidation, the body floor and battery top cover effectively seal the same opening and can be consolidated into one component. An example is shown below, where seat reinforcements found on the vehicle floor are integrated into the battery top cover, and the traditional floor of the vehicle is removed. Advanced high-strength steels are used in different grades and thicknesses. Figure 3 and Figure 4 show what the TWB battery top cover looks like on the assembly.
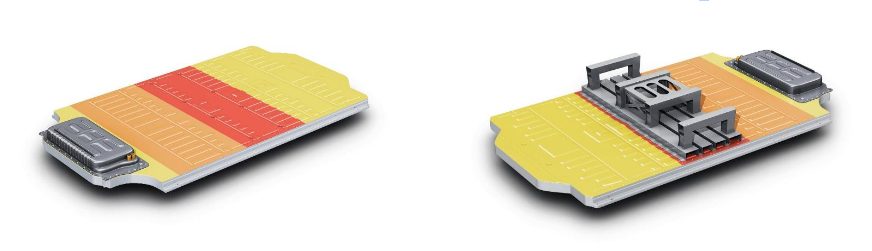
Figure 3 + Figure 4 – TWB Battery Top Cover
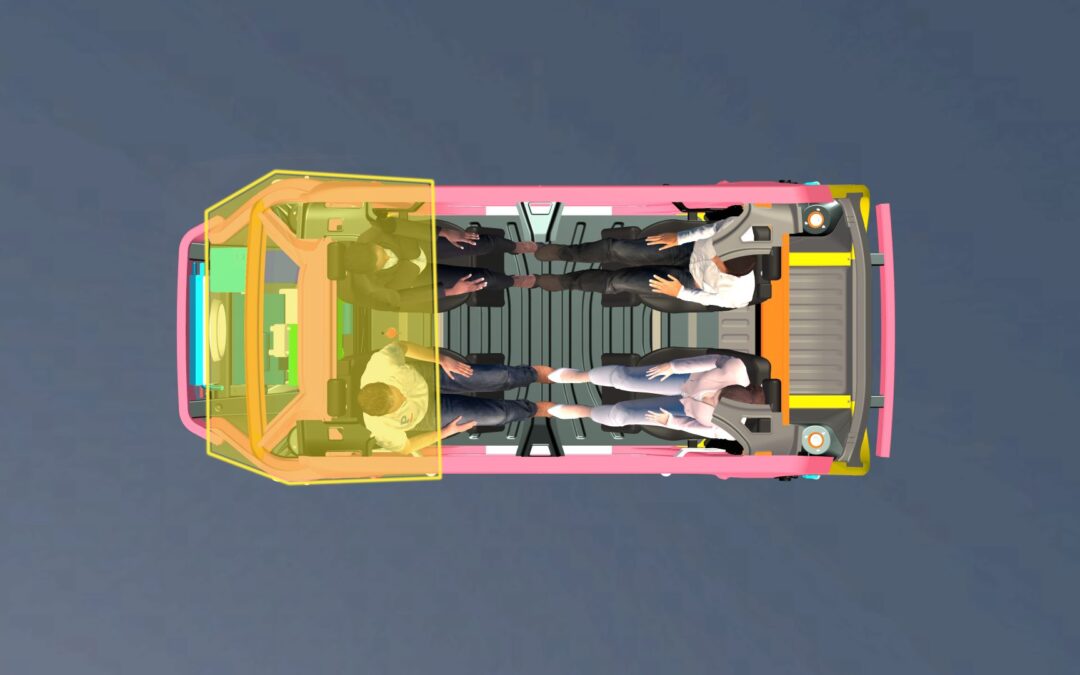
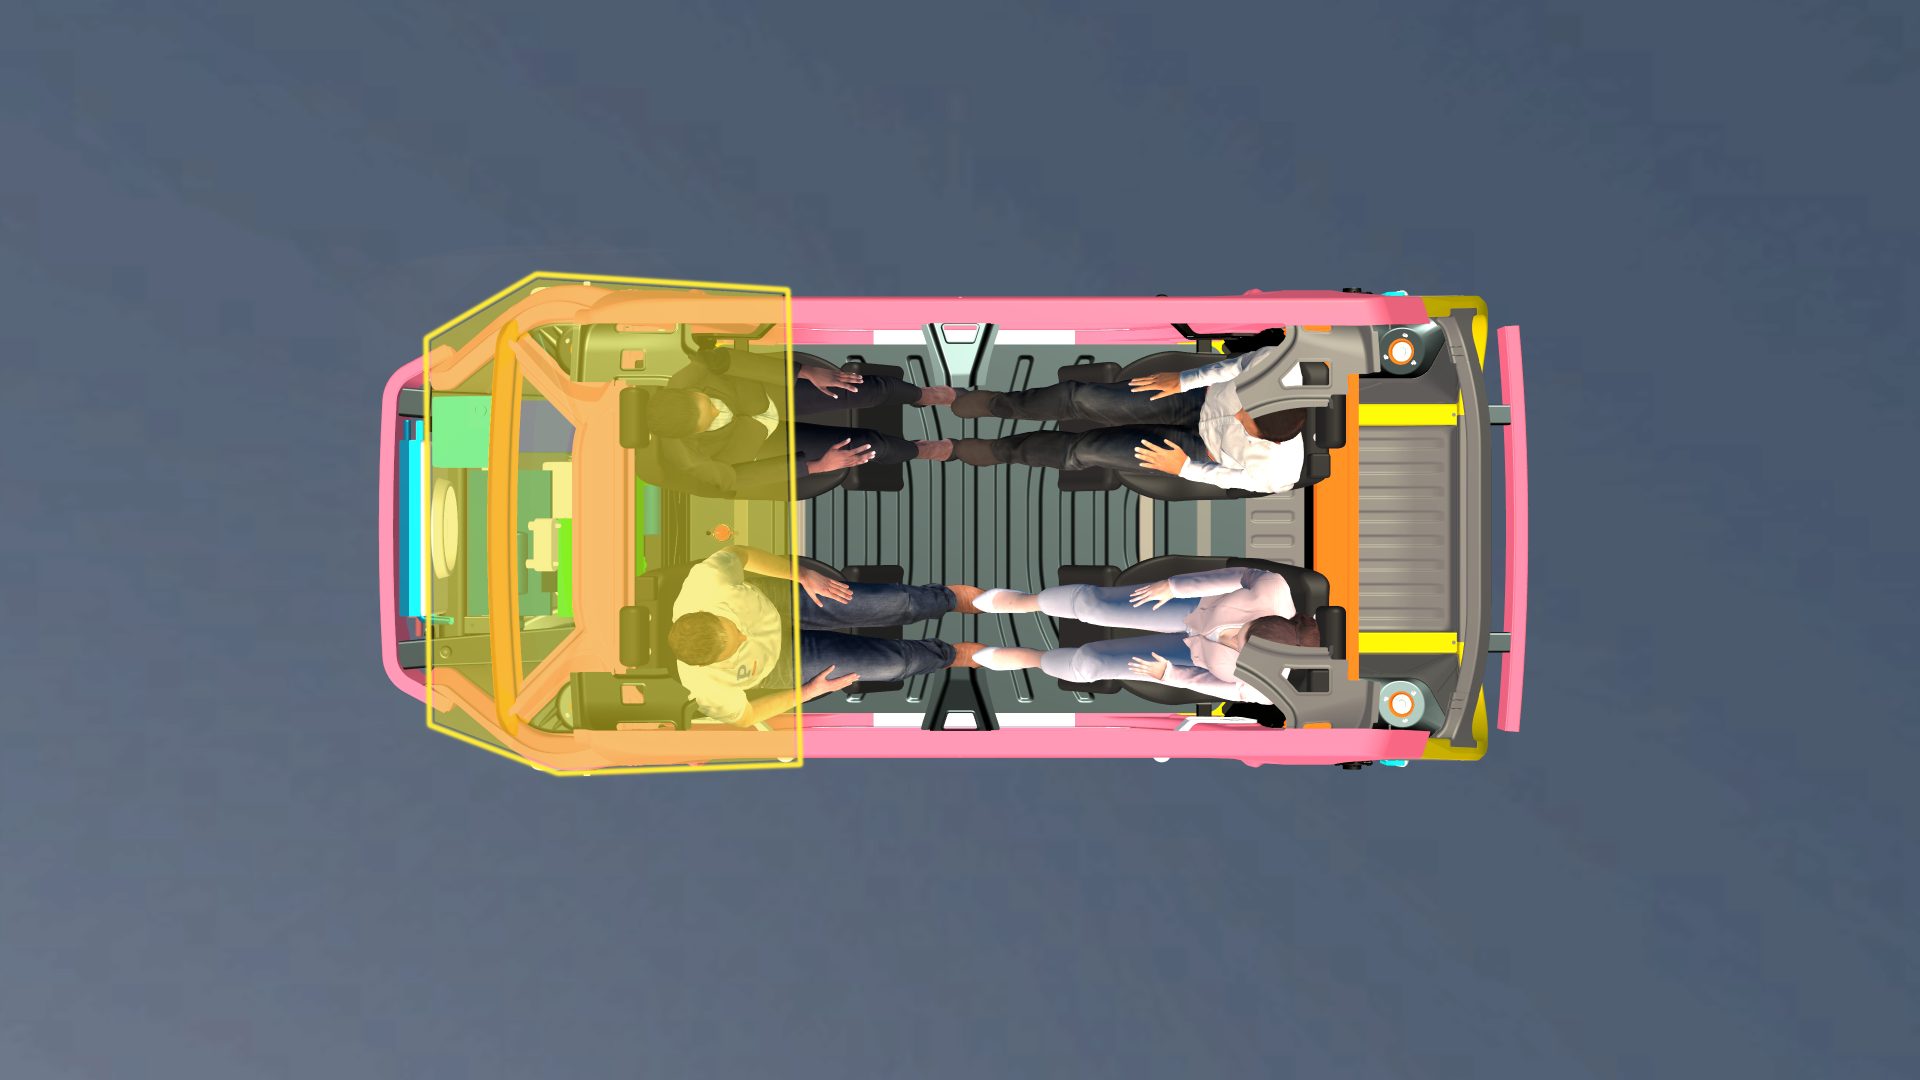
Vehicle assembly can also be radically simplified as front seats are mounted on the battery before being installed in the vehicle as shown in Figure 5, the ergonomics of the assembly operation are improved by increased access inside the passenger compartment through the open floor.
Figure 5 – Ergonomics of the Assembly Operation
Cost mitigation is more important than ever before, with reductions in piece cost and investment and assembly costs being important. At the foundation BEVs currently have cost challenges in comparison to their ICE counterparts, however the optimization potential for the architecture remains high, specifically in part consolidation. Unique concepts such as the TWB deep-drawn battery tub and integrated floor/battery top cover are novel approaches to improve challenges faced with existing BEV designs. TWB applications throughout the body in white and closures remain relevant in BEVs, providing further part consolidation opportunities.

Thanks go to Isaac Luther for his contribution of this article to the AHSS Insights blog. Luther is a senior product engineer on the new product development team at TWB Company. TWB Company is the premier supplier of tailor-welded solutions in North America. In this role, Isaac is responsible for application development in vehicle body and frame applications and battery systems. Isaac has a Bachelor of Science in welding engineering from The Ohio State University.
Blog, main-blog, News
As robotaxi companies in the USA prepare to launch their autonomous vehicles in more cities, safety is in the spotlight again. And rightly so. Autonomous vehicle safety challenges must be addressed and with the Steel E-Motive Level 5 autonomous concept, we did that.
Many autonomous mobility service companies have relied on two factors when developing their vehicles: active safety systems which help the vehicle avoid or mitigate the extent of a crash, and a maximum vehicle speed limit, which will reduce the extent of injuries to the occupants.
But the fact is that these vehicles are going to be out in mixed-mode traffic situations. There will be accidents – however much we all attempt to do everything possible to avoid them. When we developed the Steel E-Motive (SEM) body structure concepts for fully autonomous ride-sharing electric vehicles, we agreed on two basic principles – that these vehicles would operate at high speeds (top speed of 130 kph) in mixed mode traffic conditions, and that we, therefore, needed to engineer passive safety structures that met global high-speed crash requirements to protect occupants and the battery system in these use-case conditions. In this process, we discovered that no other provider of autonomous ride-sharing electric vehicles had fully shared details of passive safety structures engineered to those same high-speed crash standards. Autonomous vehicle safety had been addressed only on a limited basis.
Fortunately, our vehicle design process benefitted from a massive portfolio of modern advanced high-strength steels (AHSS) available through member companies of WorldAutoSteel. Steel E-Motive (SEM) was developed to show how AHSS can enable sustainable, comfortable, economical, and safe ride-sharing vehicles by 2030.
The AHSS Extended Passenger Protection Zone provides excellent cabin intrusion protection and ultimately lower risk of injury. PHS provides formability for challenging geometries, and Martensitic steel (MS) provides the strength to limit intrusion.
Visit this link to download the full engineering report: Steel E-Motive
The result is one of the first robotaxis to fully detail and report compliance to global high-speed safety standards. In developing Steel E-Motive, we targeted conformity with seven US crash standards, including US NCAP (New Car Assessment Program) IIHS and FMVSS (Federal Motor Vehicle Safety Standards) front, side, and rear impact tests while also assessing performance against worldwide protocols, including NHTSA (US) Euro NCAP (European) and China’s GB 38031 standard for battery protection.
As an example, Steel E-Motive achieves the highest IIHS rating of “good.” This is particularly important as IIHS (the US-based Insurance Institute for Highway Safety) is highly regarded for its dedication to reducing deaths, injuries, and property damage from motor vehicle crashes.
Most production vehicles use new generation, advanced high-strength steels, and technologies. We had no fewer than 64 AHSS materials to select from, enabling us to choose exactly the right steel for every need and purpose in the vehicle, including safety protection. These make a car stronger, more fuel efficient, and safer.
Nearly all vehicles on the road today are made of steel because it has the broadest range of properties while being the most affordable structural material for designing safe vehicles. Steel has a unique capacity to absorb an impact, and, therefore, to diffuse crash energy. It also becomes harder when it’s crushed, which means it will become stronger on impact, retarding further penetration into the vehicle’s passenger zone.
Taking on Autonomous Vehicle Safety Challenges
Here is an outline of how we designed steel’s benefits into the Steel E-Motive (SEM) concept when considering front and side crashes.
SEM features a high-strength front protection zone, which reacts to the crush loads and minimizes intrusion for the occupants in front crashes. The crush zones have been engineered to decelerate the vehicle progressively. The longitudinal mid rails, featuring tailor-welded blanks fabricated with Dual Phase steels, are tuned to give a lower deceleration pulse into the passenger cabin to minimize injury threat. The side crush rails are designed to minimize intrusion into the cabin for occupant protection. Finally, a novel design geometry and Press Hardened Steels enable the new glance beam architecture to force the vehicle off of the Small Offset barrier; the resulting “glance-off” achieves significantly reduced crash energy and pulse into the passenger cabin.
When considering side crashes, we engineered the body structure for the IIHS 60kph deformable barrier test and 30kph side pole test, assessing both occupant and battery protection and achieving the IIHS “good” performance rating. Our side structures are comprised of a large one-piece tailor-welded door ring fabricated with press hardened steels, the TRIP steel B pillar housed in the side scissor doors, and a roll-formed hexagon rocker beam fabricated with Dual Phase steel.
These attain a very safe design, giving good levels of protection for both the occupants and battery modules, exceeding 30mm intrusion clearance at critical measurement points.
SEM was also engineered for rear crash and roof crush, and once again, the robust steel-intensive architecture exceeds crash standard requirements.
Electric-powered vehicle sales are accelerating, reflecting industry investment, and will soon achieve market domination from the combustion engine. In megacities, where congestion, pollution, and exorbitant vehicle ownership costs reign, Autonomous cars will replace drivers, and ride-sharing will become the norm. As we look into the future and recognize the need for these vehicles to offer comfortable, safe, affordable, and sustainable transportation, we will still be designing them by harnessing the unique properties of steel.
Visit this link to download the full engineering report: Steel E-Motive
![Uniform Elongation]()
Mechanical Properties
During a tensile test, the elongating sample leads to a reduction in the cross-sectional width and thickness. The shape of the engineering stress-strain curve showing a peak at the load maximum (Figure 1) results from the balance of the work hardening which occurs as metals deform and the reduction in cross-sectional width and thickness which occurs as the sample dogbone is pulled in tension. In the upward sloping region at the beginning of the curve, the effects of work hardening dominate over the cross-sectional reduction. Starting at the load maximum (ultimate tensile strength), the reduction in cross-sectional area of the test sample overpowers the work hardening and the slope of the engineering stress-strain curve decreases. Also beginning at the load maximum, a diffuse neck forms usually in the middle of the sample.

Figure 1: Engineering stress-strain curve from which mechanical properties are derived.
The elongation at which the load maximum occurs is known as Uniform Elongation. In a tensile test, uniform elongation is the percentage the gauge length elongated at peak load relative to the initial gauge length. For example, if the gauge length at peak load measures 61 mm and the initial gauge length was 50mm, uniform elongation is (61-50)/50 = 22%.
Schematics of tensile bar shapes are shown within Figure 1. Note the gauge region highlighted in blue. Up though uniform elongation, the cross-section has a rectangular shape. Necking begins at uniform elongation, and the cross section is no longer rectangular.
Theory and experiments have shown that uniform elongation expressed in true strain units is numerically equivalent to the instantaneous n-value.
Deformation Prior to Uniform Elongation is Not Uniformly Distributed
Conventional wisdom for decades held that there is a uniform distribution of strains within the gauge region of a tensile bar prior to strains reaching uniform elongation. Traditional extensometers calibrated for 50-mm or 80-mm gauge lengths determine elongation from deformation measured relative to this initial length. This approach averages results over these spans.
The advent of Digital Image Correlation (DIC) and advanced processing techniques allowed for a closer look. A studyS-113 released in 2021 clearly showed that each of the 201 data points monitored within a 50 mm gauge length (virtual gauge length of 0.5-mm) experiences a unique strain evolution, with differences starting before uniform elongation.
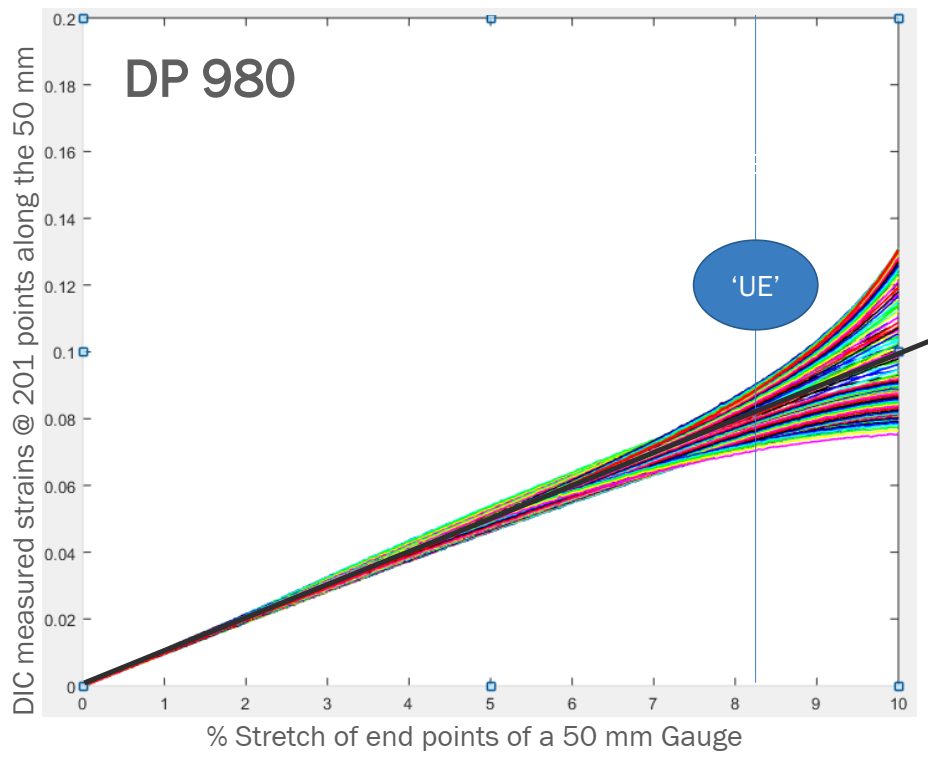
Figure 2: Strain evolution of the 201 points on the DP980 tensile-test specimen exhibits divergence beginning before uniform elongation—counter to conventional thinking.S-113
![Uniform Elongation]()
Mechanical Properties
Elastic Modulus (Young’s Modulus)
When a punch initially contacts a sheet metal blank, the forces produced move the sheet metal atoms away from their neutral state and the blank begins to deform. At the atomic level, these forces are called elastic stresses and the deformation is called elastic strain. Forces within the atomic cell are extremely strong: high values of elastic stress results in only small magnitudes of elastic strain. If the force is removed while causing only elastic strain, atoms return to their original lattice position, with no permanent or plastic deformation. The stresses and strains are now at zero.
A stress-strain curve plots stress on the vertical axis, while strain is shown on the horizontal axis (see Figure 2 in Mechanical Properties). At the beginning of this curve, all metals have a characteristic linear relationship between stress and strain. In this linear region, the slope of elastic stress plotted against elastic strain is called the Elastic Modulus or Young’s Modulus or the Modulus of Elasticity, and is typically abbreviated as E. There is a proportional relationship between stress and strain in this section of the stress-strain curve; the strain becomes non-proportional with the onset of plastic (permanent) deformation (see Figure 1).

Figure 1: The Elastic Modulus is the Slope of the Stress-Strain Curve before plastic deformation begins.
The slope of the modulus line depends on the atomic structure of the metal. Most steels have an atomic unit cell of nine iron atoms – one on each corner of the cube and one in the center of the cube. This is described as a Body Centered Cubic (BCC) structure. The common value for the slope of steel is 210 GPa (30 million psi). In contrast, aluminum and many other non-ferrous metals have 14 atoms as part of the atomic unit cell – one on each corner of the cube and one on each face of the cube. This is referred to as a Face Centered Cubic (FCC) atomic structure. Many aluminum alloys have an elastic modulus of approximately 70 GPa (10 million psi).
Under full press load at bottom dead center, the deformed panel shape is the result of the combination of elastic stress and strain and plastic stress and strain. Removing the forming forces allows the elastic stress and strain to return to zero. The permanent deformation of the sheet metal blank is the formed part coming out of the press, with the release of the elastic stress and strain being the root cause of the detrimental shape phenomenon known as springback. Minimizing or eliminating springback is critical to achieve consistent stamping shape and dimensions.
Depending on panel and process design, some elastic stresses may not be eliminated when the draw panel is removed from the draw press. The elastic stress remaining in the stamping is called residual stress or trapped stress. Any additional change to the stamped panel condition (like trimming, hole punching, bracket welding, reshaping, or other plastic deformation) may change the amount and distribution of residual stresses and therefore potentially change the stamping shape and dimensions.
The amount of springback is inversely proportional to the modulus of elasticity. Therefore, for the same yield stress, steel with three times the modulus of aluminum will have one-third the amount of springback.
Elastic Modulus Variation and Degradation
Analysts often treat the Elastic Modulus as a constant. However, Elastic Modulus varies as a function of orientation relative to the rolling direction (Figure 2). Complicating matters is that this effect changes based on the selected metal grade.

Figure 2: Modulus of Elasticity as a Function of Orientation for Several Grades (Drawing Steel, DP 590, DP 980, DP 1180, and MS 1700) D-11
It is well known that the Bauschinger Effect leads to changes in the Elastic Modulus, and therefore impacts springback. Elastic Modulus determined in the loading portion of the stress-strain curve differs from that determined in the unloading portion. In addition, increasing prestrain lowers the Elastic Modulus, with significant implications for forming and springback simulation accuracy. In DP780, 11% strain resulted in a 28% decrease in the Elastic Modulus, as shown in Figure 3.K-7

Figure 3: Variation of the loading and unloading apparent modulus with strain for DP780K-7
Another study documented the modulus degradation for many steel grades, including mild steel, conventional high strength steels, and several AHSS products.W-10 Data in some of the grades is limited to small plastic strains, since valid data can be obtained from uniaxial tensile testing only through uniform elongation.
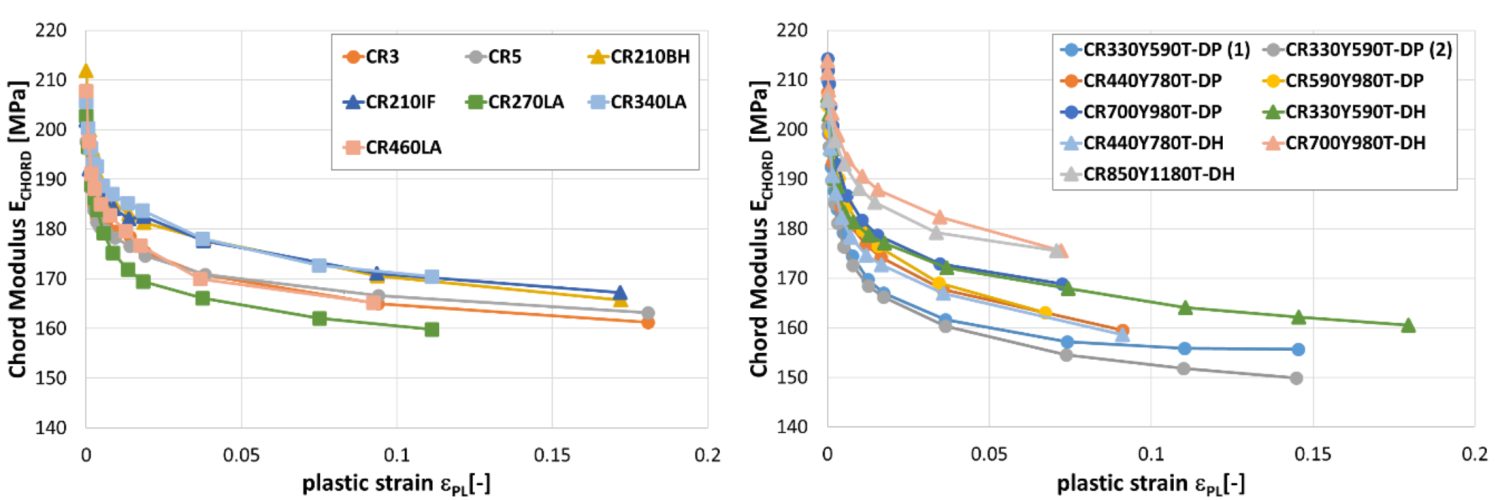
Reduction in chord modulus for mild steels and conventional high strength steels (left) and for DP and DH steels (right).W-10
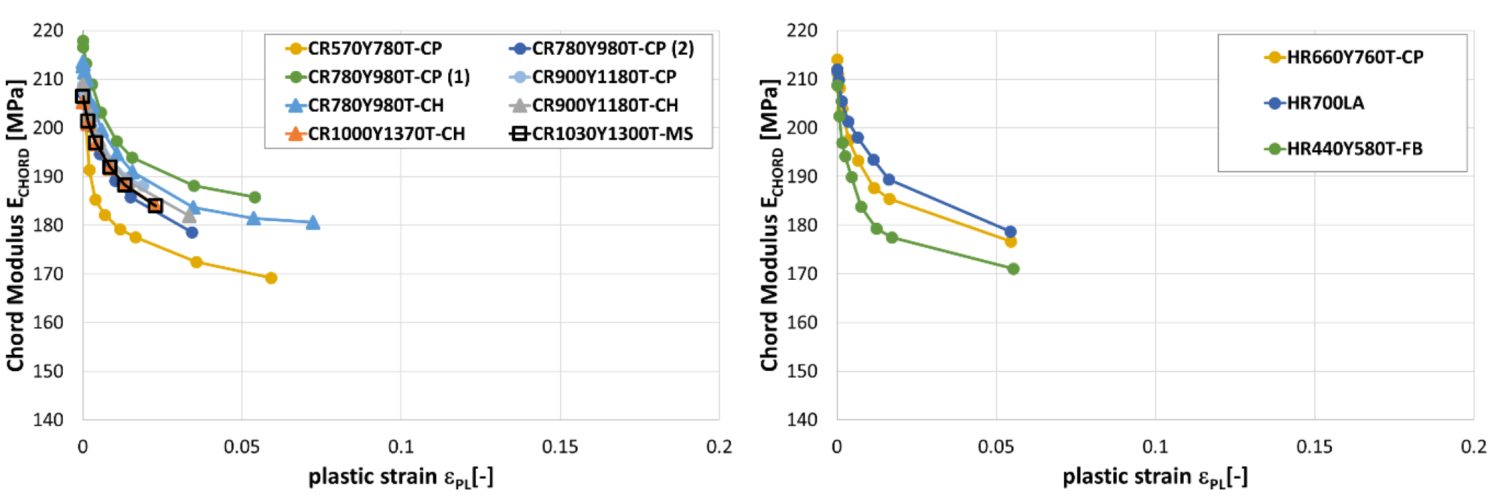
Reduction in chord modulus for CP, CH and MS steels (left) and for a selected of hot rolled steels (right).W-10

Mechanical Properties
M-Value, Strain Rate Sensitivity
All metals strengthen as they are deformed through a process called work hardening. However, the degree of strengthening may change as a function of the speed at which they are tested. In these cases, when local necking starts, the strain rate in the necked area is different in the surrounding non-necking region.
With negative strain-rate sensitivity, as is the case with many aluminium alloys, the necked region is weaker than the surrounding area. Fracture occurs with very little additional strain after necking initiation.
With positive strain-rate sensitivity, the necked region is stronger than the surrounding area. This is the basis for many steel alloys having a total elongation to fracture that is nearly double that of uniform elongation.
This strain-rate sensitivity is described by the exponent, m, in the modified power law equation:
 Equation 1
where έ is the strain rate and m is the strain rate sensitivity.
To characterize the strain rate sensitivity, medium strain rate tests were conducted at strain rates ranging from 10-3/sec (commonly found in tensile tests) to 103/sec. For reference, 101/sec approximates the strain rate observed in a typical stamping. Both yield strength and tensile strength increase with increasing strain rate, as indicated Figures 1 and 2.

Figure 1: Influence of Strain Rate on Yield Strength.Y-1
Figure 2: Influence of Strain Rate on Tensile Strength.Y-1
Up to a strain rate of 101/sec, both the YS and UTS only increased about 16-20 MPa per order of magnitude increase in strain rate. These increases are less than those measured for low strength steels. This means the YS and UTS values active in the sheet metal are somewhat greater than the reported quasi-static values traditionally reported. However, the change in YS and UTS from small changes in press strokes per minute are very small and are less than the changes experienced from one coil to another.
The change in n-value with increase in strain rate is shown in Figure 3. Steels with YS greater than 300 MPa have an almost constant n-value over the full strain rate range, although some variation from one strain rate to another is possible.

Figure 3: Influence of Strain Rate on n-value.Y-1
Similar behavior was noted in another studyB-22 that included one TRIP steel and three DP steels. Here, DP1000 showed a 50% increase in yield strength when tested at 200/sec compared with conventional tensile test speeds. Strain rate has little influence on the elongation of AHSS at strain rates under 100/sec.
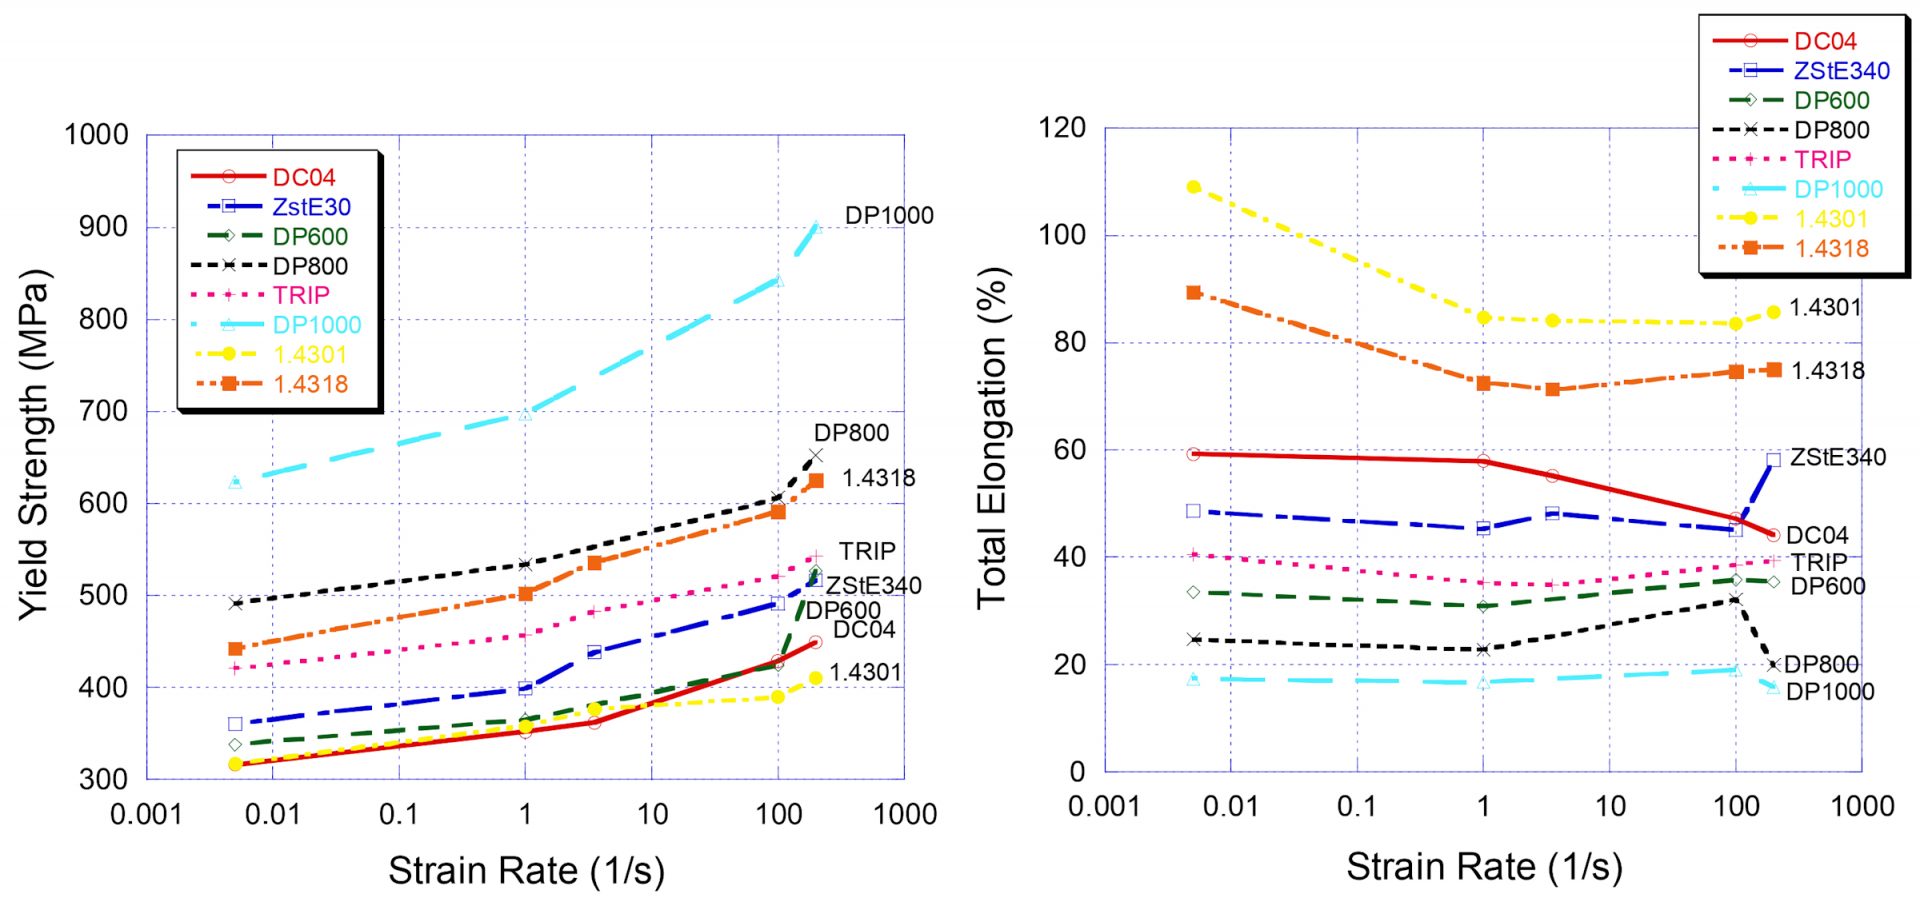
Figure 4: Relationship between strain rate and yield strength (left) and elongation (right). Citation B-22, as reproduced in Citation D-44
Figure 5 shows the true stress-true strain curves for a processed Press Hardened Steel tested at different strain rates. The yield stress increases approximately five MPa for one order of magnitude increase in strain rate.

Figure 5: True stress-strain curves at different strain rates for 1mm thick Press Hardening Steel (PHS) after heat treatment and quenching.V-1
The tensile and fracture response of different grades is a function of the strain rate and cannot be generalized from conventional tensile tests. This has significant implications when it comes to predicting deformation behavior during the high speeds seen in automotive crash events. See our page on high speed testing for more details.