The complex shapes of automotive stampings lead to die designs and processing that may challenge the inherent formability of the selected sheet metal grade.
Traditional grades, especially those of lower strength, fail from insufficient necking resistance for the chosen application. Characterization of the resistance to necking instability, sometimes referred to as global formability, is done with the strain hardening exponent (n-value), true uniform strain, and the Forming Limit Curve. Since these parameters can be mathematically described, forming simulation packages can accurately estimate the risk of necking and subsequent splitting.
Contrast this with newer grades where the sheet metal may still fail from insufficient necking resistance, but may also fail from fracture initiating at cut edges or tight bends. This fracture-limited formability, sometimes called local formability, can be influenced by many parameters – including both inherent material characteristics as well as the processing conditions used to create the cut edge (hole diameter, clearance, punch geometry, and so on) or bend (inside bend radius divided by the thickness, r/t). The inherent material characteristics contributing to this failure mode are not directly related to strength and elongation determined from traditional uniaxial tensile testing. Forming simulation packages have challenges estimating the risk of fracture-limited formability, since the full mathematical representation of the contributing factors does not yet exist.
To date, hole expansion testing is the most common way to characterize the edge stretchability of a particular sheet metal. The typical test procedure, prescribed by ISO 16630, requires a 10 mm diameter hole punched with a 12% clearance to be expanded with a conical punch having a 60° apex angle. Unfortunately, changing the testing conditions like the hole diameter, clearance, punch shape, or crack detection method has a significant influence on the results, to the point that any relative performance ranking of different products can change between the defined laboratory test conditions and the real-world performance.
Local fracture strain measurements from uniaxial tensile specimens, like true fracture strain, true thickness strain, or the reduction of the cross-section area at fracture, are also used to quantify fracture performance, and may offer better guidance for crash performance prediction.L-21, L-69 The bending angle measured from 3-point bending test according to VDA 238-100 or the fracture strain in plane strain tension obtained from these tests, are also effective in predicting bending-dominated failure that occurs with AHSS grades during folding/bending in axial and side crash tests. The bending angle and fracture strain determined in a 3-point bend test conducted according to VDA 238-100 correlates with the folding and bending seen in vehicle crash testing. However, these parameters individually are not sufficient to characterize overall fracture behavior and therefore cannot be used as a singular failure criterion that is applicable to all situations.
Fracture Toughness
Fracture-limited formability is dependent on the sheet metal’s resistance to crack nucleation and propagation, which are the two parameters influencing fracture toughness. As such, approaches have been investigated to experimentally assess the relationship between fracture toughness and cracking resistance of advanced steels.
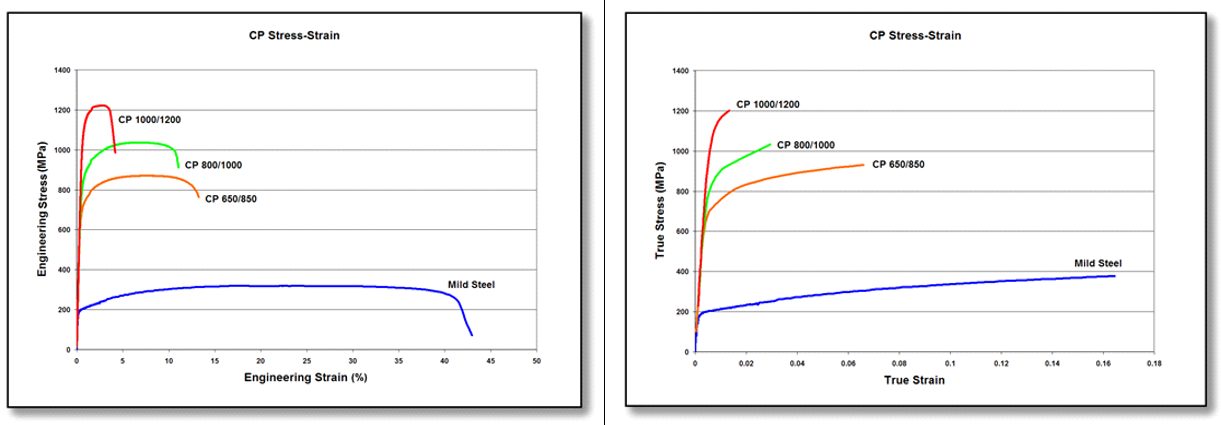
Conventional toughness estimations based on the product of tensile strength multiplied by the total elongation to fracture (TS * TEL) or the area under the stress-strain curve are not suitable to describe the fracture toughness of AHSS. Use of these shortcuts may lead to an incorrect fracture toughness ranking when considering multiple materials: consider the comparison of 980DP vs. 980CP. The dual phase steel has greater elongation to fracture and greater uniform elongation, yet the complex phase steel has better edge ductility and fracture toughness. Tensile fracture parameters, such as the true fracture strain (εf) or the product of fracture stress and true fracture strain (σf × εf), give a better estimation of toughness at cracking initiation. However, these approaches can underestimate the crack propagation resistance of the material. To avoid misleading conclusions about the cracking resistance of high strength sheet metals, fracture toughness must be measured within the framework of fracture mechanics.F-43
Fracture toughness is defined as the energy spent in the creation of two surfaces at the crack tip that leads to crack propagation. Traditional approaches to study fracture toughness include J-integral and Crack Tip Opening Displacement (CTOD) measurements, but these evaluations do not apply to thin-gauge materials such as those used in automotive body construction. Alternative approaches appropriate for sheets below 3 mm thickness are relatively complex, involve detailed specimen preparation, and require measurement of the advancing crack during the tests.
Essential Work of Fracture Methodology
To address these challenges, a methodology based on the Essential Work of Fracture (EWF) appears to offer a simpler solution for measuring the fracture toughness of thin metal sheets. The method described below has been validated in industrial applications using both steel and non-steel sheet metals. The Double Edge Notched Tensile (DENT) specimen is used for this characterization (Figure 1). Since only tensile transverse stresses exist between the notches, and the geometry avoids the risk of buckling.
Figure 1: The Double Edge Notched Tensile (DENT) specimen is used for Essential Work of Fracture characterization.
In the DENT specimen, all of the deformation takes place in and around the notched ligament, allowing for separation of the total fracture energy, Wf, into its two components:
a) We, the essential work of fracture that is related to damage and the work to create new surfaces in front of the progressing crack tip. This value is proportional to the fractured area.
b) Wp, the plastic work dissipated in the region surrounding the crack tip as a consequence of plastic deformation. This value is proportional to the deformed volume, which is a function of the sample size, geometry, and loading mode.
Mathematically, the total fracture energy may be represented by:
Wf = We + WpEquation 1
These parameters can be further characterized.
We = we*l0*t0, where we is the essential work of fracture per unit area, l0 is the ligament length between the two notches, and t0 is the specimen thickness.
Wp = β*wp* l02*t0, where wp is the plastic work per unit volume and β is a shape factor that is a function of the shape of the plastic zone.
Substituting these into Equation 1 gives
Wf = we*l0*t0 + β*wp* l02*t0Equation 2
Normalizing each side of Equation 2 by the fractured area l0*t0 produces wf, the fracture energy per fracture area:
Wf/ l0*t0 = wf = we + β*wp* l0 Equation 3
This procedure enables the separation of the specific essential work of fracture, we , and the non-essential plastic work, wp, from the total energy of fracture by using a simple data reduction method. A series of specimens with different ligament lengths are tested to fracture. The fracture energy per fracture area, wf, is then calculated by integrating the area under the load-displacement curve and normalizing by the cross-section area (wf= Wf /l0*t0) . . By plotting the series of wf values as a function of ligament length l0 as shown in Figure 2, then we and β*wp can be obtained by linear regression with we being the vertical axis intercept of a line with slope β*wp. It is relevant to keep in mind that this method to obtain we is a purely mathematic procedure to remove the non-essential plastic contribution to the fracture energy, i.e. it does not mean that we is the value of wf at zero ligament length. To guarantee data linearity and the validity of the energy partitioning concept, different validity criteria must be met.T-49
The parameter we is a thickness-dependent material constant representing the plane stress fracture toughness of the material. Since it is obtained from a dataset of energy values for the complete fracture, it contains energetic contributions from both crack initiation and propagation resistance.
For each of the specimens tested with different ligament length, the work of fracture at crack initiation (wfi) is obtained from integrating the area under the load-displacement curve up to the point of crack growth initiation. This point has to be experimentally verified and generally it is around the peak values of the forces versus displacement curve. Since wfi is independent of the ligament length, the specific essential work for fracture initiation, wei can be calculated from an average of wfi values. This is also shown in Figure 2. Figure 2: The specific essential work of fracture, we, is the vertical axis intercept in the plot showing the relationship between the specific total work of fracture, wf, and the ligament length. The specific essential work of fracture initiation, wei, is the average of the values of the specific work of fracture at initiation of propagation, wfi.
Figure 3 shows the specific essential work for fracture (we) and specific essential work for fracture initiation (wei) for several advanced high strength steels. The differences between these parameters vary between the grades. For some grades, the markers fall nearly on top of each other, and for these, there is only a small contribution from crack propagation resistance once the crack initiates. For other grades, including complex phase steels and the enhanced-ductility PHS grade, the crack propagation resistance is a significant portion of the overall fracture toughness.
Figure 3: we and wei for several advanced high strength steels. F-44
Notch root radius has a significant influence on EWF measurements. To obtain accurate and reliable fracture toughness values pre-cracked samples must be used. Alternative methods, including fatigue pre-cracking, notch sharpening by a razor blade or mechanical sharp notching with a specific tool, may be used for that purpose. ASTM E399 lists a procedure to nucleate a fatigue crack at the notch rootA-81, as does ASTM E1820A-82. These approaches are relatively costly and time consuming. To address these concerns, a device consisting of a two-pillar modular cutting die and beveled punch was developed to shear sheet specimens in such a manner to introduce crack-like sharp notches.F-45, E-15 Without these efforts to generate an exceedingly small notch radius, the measured toughness values can overestimate the real crack initiation and propagation resistance of the material.F-43
Following the definition of the specific essential work of fracture we , the resistance to crack propagation, it is the material property to address crack-related problems in sheet metal forming, as edge cracking, or to account for part performance when cracks are involved, as in crash resistance tests. In this regard, there is good experimental correlation between the we and the hole expansion ratio for a wide range of AHSS families, as shown in Figure 4. As discussed above, although similarities exist in the fracture mechanisms involved in both tests, the hole expansion ratio is not a material parameter since it depends on several experimental factors such as the hole geometry, edge preparation method, and crack detection method. These choices lead to increased variability of results generated at different labs. Aside from thickness, we is a material property that represents more accurately the sheet steel’s crack propagation resistance. Based on experimental observations a value of we larger than 250 kJ/m2 would be recommended when edge cracking may appear in sheet forming. On the contrary, values lower than 125 kJ/m2 may jeopardize the stamping process.
Figure 4: Correlation between we and hole expansion ratio (HER), based on data in Citations F-44, F-46
Crash resistance can be also assessed through the values of the we. In AHSS the appearance of cracks during crash tests ranks crash resistance, so high cracking resistance steel leads to high crashworthiness. The energy absorbed by a component linearly increases with the specific essential work of fracture of the steel used to form the component (Figure 5), making we a good candidate to provide useful information in assessing crashworthiness.F-47
Figure 5a. Crash box made from DP1000 can absorb only limited energy before fracture. F-44
Figure 5b. Crash box made from CP1000 can absorb more energy before fracture.F-44
Figure 5c. Energy absorbed at maximum intrusion as a function of the specific essential work of fracture for several advanced steels.F-47
Local Formability Diagrams such as the ones shown in Figures 3 and 4 of the Defining Steels page give the user an indication of how a chosen grade might perform in applications requiring fracture resistance, such as those inducing expansion of cut edges during forming. Knowledge of the Essential Work of Fracture offers another representation, as reproduced in Figure 6.F-46Figure 7 shows a similar representation having tensile strength on the horizontal axis, which is the same format as the conventional Global Formability Diagram.F-48
Figure 6: AHSS classification based on uniform elongation (UE, as an indicator of global formability) and fracture resistance (we). LGF low global formability, LCR low cracking resistance, HGF high global formability, HCR high cracking resistance.F-46
Figure 7: Fracture resistance (we) as a function of tensile strength (UTS) for several Advanced High Strength Steels.F-48
Additional information about the Essential Work of Fracture methodology and its application in fracture toughness, cracking resistance, crashworthiness assessments, User Guidelines, and case studies can be found at https://toughsteel.eu/ as well as Citations C-37, C-38, and C-39.
There are different ways to classify automotive steels. One is a metallurgical designation providing some process information. Common designations include lower-strength steels (interstitial-free and mild steels); conventional high strength steels, such as bake hardenable and high-strength, low-alloy steels (HSLA); and Advanced High-Strength Steels (AHSS) such as dual phase and transformation-induced plasticity steels. Additional higher strength steels include press hardening steels and steels designed for unique applications that have improved edge stretch and stretch bending characteristics.
A second classification method important to part designers is strength of the steel. This document will use the general terms HSLA and AHSS to designate all higher strength steels. The principal difference between conventional HSLA steels and AHSS is their microstructure. Conventional HSLA steels are single-phase ferritic steels with a potential for some pearlite in C-Mn steels. AHSS are primarily steels with a multiphase microstructure containing one or more phases other than ferrite, pearlite, or cementite – for example martensite, bainite, austenite, and/or retained austenite in quantities sufficient to produce unique mechanical properties. Some types of AHSS have a higher strain hardening capacity resulting in a strength-ductility balance superior to conventional steels. Other types have ultra-high yield and tensile strengths and show a bake hardening behavior.
AHSS include all martensitic and multiphase steels having a minimum specified tensile strength of at least 440 MPa. Those steels with very high minimum specified tensile strength are sometimes referred to as Ultra High Strength Steels (UHSS). Several companies choose 980 MPa as the threshold where “Ultra” high strength begins, while others use higher thresholds of 1180 MPa or 1270 MPa. There is no generally accepted definition among the producers or users of the product. The difference between AHSS and UHSS is in terminology only – they are not separate products. The actions taken by the manufacturing community to form, join, or process is ultimately a function of the steel grade, thickness, and mechanical properties. Whether these steels are called “Advanced” or “Ultra” does not impact the technical response.
Third Generation, or 3rd Gen, AHSS builds on the previously developed 1st Gen AHSS (DP, TRIP, CP, MS, and PHS) and 2nd Gen AHSS (TWIP), with global commercialization starting around 2020. 3rd Gen AHSS are multi-phase steels engineered to develop enhanced formability as measured in tensile, sheared edge, and/or bending tests. Typically, these steels rely on retained austenite in a bainite or martensite matrix and potentially some amount of ferrite and/or precipitates, all in specific proportions and distributions, to develop these enhanced properties.
Nomenclature
Historically, HSLA steels were described by their minimum yield strength. Depending on the region, the units may have been ksi or MPa, meaning that HSLA 50 and HSLA 340 both describe a High Strength Low Alloy steel with a minimum yield strength of 50 ksi = 50,000 psi ≈ 340 MPa. Although not possible to tell from this syntax, many of the specifications stated that the minimum tensile strength was 70 MPa to 80 MPa greater than the minimum yield strength.
Development of the initial AHSS grades evolved such that they were described by their metallurgical approach and minimum tensile strength, such as using DP590 to describe a dual phase steel with 590 MPa tensile strength. Furthermore, when Advanced High Strength Steels were first commercialized, there was often only one option for a given metallurgical type and tensile strength level. Now, for example, there are multiple distinct dual phase grades with a minimum 980 MPa tensile strength, each with different yield strength or formability.
To highlight these different characteristics throughout this website, each steel grade is identified by whether it is hot rolled or cold rolled, minimum yield strength (in MPa), minimum tensile strength (in MPa), and metallurgical type. Table 1 lists different types of steels.
Table 1: Different Types of Steels and Associated Abbreviations.
As an example, CR-500Y780T-DP describes a cold rolled dual phase steel with 500 MPa minimum yield strength and 780 MPa minimum ultimate tensile strength. There is also another grade with the same minimum UTS, but lower yield strength: CR440Y780T-DP. If the syntax is simply DP780, the reader should assume either that the referenced study did not distinguish between the variants or that the issues described in that section applies to all variants of a dual phase steel with a minimum 780 MPa tensile strength.
Another syntax issue is the presentation of the strength (yield or tensile), and whether it is rounded to the nearest 10 or 50 MPa. For example, consider DP980 compared with DP1000. Both forms represent essentially the same grade. In Europe, this steel may be described as having a tensile strength of 100 kgf/mm2, corresponding to 981 N/mm2 (981 MPa), and expressed as DP980. In Asia, the steel may be referred to as 100K (an abbreviation for 100 kgf/mm2). In other parts of the world, it may be rounded to nearest 50 MPa, as DP 1000. This naming approach applies to many grades, with some shown in Table 2. In some cases, although the OEM specification may list the steel as DP800 (for example), the minimum tensile strength requirement may still be 780 MPa. Furthermore, independent of the chosen naming syntax, the steel company will supply to the actual specification requirements, and will use different process controls to meet a 780 MPa minimum compared with an 800 MPa minimum.
Table 2: Syntax Related to AHSS Strength Levels
Press hardening steels sometimes require a different syntax. Some OEMs will use a similar terminology as described above. For example: CR-950Y1300T-PH (PH stands for Press Hardenable or Press Hardened) or CR-950Y1300T-MB (MB stands for Manganese-Boron steel) can describe the same cold rolled press hardening steel with 950 MPa minimum yield strength and 1300 MPa minimum tensile strength after completing the press hardening operation. Other specifications may show suffixes which highlight the forming process used, such as -DS for direct hot stamping, -IS for indirect hot stamping and MS for a multi-step process. Furthermore, sources may describe this product focused on its typical tensile strength as PHS1500T. The abbreviation PQS (Press Quenched Steel) is typically used for grades that do not harden after hot stamping. These may be noted as PQS450 and PQS550, where the numbers stand for the approximate minimum tensile strength after the hot stamping cycle (see the section on Grades With Higher Ductility on the linked page).
Graphical Presentation
Generally, elongation (a measure of ductility) decreases as strength increases. Plotting elongation on the vertical axis and strength on the horizontal axis leads to a graph starting in the upper left (high elongation, lower strength) and progressing to the lower right (lower elongation, higher strength). This shape led to the colloquial description of calling this the banana diagram.
Figure 1: A generic “banana” diagram comparing strength and elongation.
With the continued development of advanced steel options, it is no longer appropriate to describe the plethora of options as being in the shape of a banana. Instead, with new grades filling the upper right portion (see Figure 2), perhaps it is more accurate to describe this as the football diagram as the options now start to fall into the shape of an American or Rugby Football. Officially, it is known as the steel Global Formability Diagram.
Figure 2: The Global Formability Diagram comparing strength and elongation of current and emerging steel grades. Click here for a high resolution download. Source: Courtesy of WorldAutoSteel
Even this approach has its limitations. Elongation is only one measure of ductility. Other ductility parameters are increasingly important with AHSS grades, such as hole expansion and bendability. BillurB-61 proposed a diagram comparing the bend angle determined from the VDA238-100 testV-4 with the yield strength for various press hardened and press quenched steels.
Figure 3: VDA Bending Angle typically decreases with increasing yield strength of PHS/PQS grades.B-61
Figure 4 shows a local/global formability map sometimes referred to as the Hance Diagram named after the researcher who proposed it.H-16 This diagram combines measures of local formability (characterized by true fracture strain) and global formability (characterized by uniform elongation), providing insight on different characteristics associated with many steel grades and helping with application-specific material grade selection. For example, if good trim conditions still create edge splits, selecting materials higher on the vertical axis may help address the edge-cracking problems. Likewise, global formability necking or splitting issues can be solved by using grades further to the right on the horizontal axis.
Figure 4: The Local/Global Formability Map combines measures of local formability (true fracture strain) and global formability (uniform elongation) to highlight the relative characteristics of different grades. In this version from Citation D-12, the colors distinguish different options at each tensile strength level.
Grade Portfolio
Previous AHSS Application Guidelines showcased a materials portfolio driven by the FutureSteelVehicle (FSV) program, with more than twenty new grades of AHSS acknowledged as commercially available by 2020. The AHSS materials portfolio continues to grow, as the steel industry responds to requirements for high strength, lightweight steels. Table 3 reflects available AHSS grades as well as grades under development and nearing commercial application. The Steel Grades page provides details about these grades and their applications.
Table 3: Commercially available AHSS Grades and grades under development for near-term application. Grade names shown in Italicized Bold were available in FutureSteelVehicle. For all but PQS/PHS, Grade Name indicates the minimum yield strength, minimum tensile strength, and the type of AHSS. PQS/PHS grade name indicates nominal tensile strength. The min EL column indicates a typical minimum total elongation value, which may vary based on test sample shape, gauge length, and thickness. The typ λ column indicates a typical hole expansion percentage, which may vary based on test sample diameter, punch shape, edge preparation techniques, and several other factors. Zinc coatings may lower these hole expansion values by 10%-15%. The ISO 16630 test for hole expansion is known to produce results with more scatter than desired. Globally, many companies and consortia are attempting to converge on a robust edge stretch characterization procedure that produces meaningful results without undue scatter. See the pages on Edge Stretch Characterization for more information. You are advised to contact your steel supplier for specific guidance on the products available and the associated properties.
Global automakers create steel specification criteria suited for their vehicle targets, manufacturing infrastructure, and other constraints. Although similar specifications exist at other companies, perfect overlap of all specifications is unlikely. Global steelmakers have different equipment, production capabilities, and commercial availability.
Minimum or typical mechanical properties shown on this web page and throughout this site illustrates the broad range of AHSS grades that may be available. Properties of hot rolled steels can differ from cold rolled steels. Coating processes like hot dip galvanizing or galvannealing subjects the base metal to different thermal cycles that affect final properties. Test procedures and requirements have a regional or OEM influence, such as preference to using tensile test gauge length of 50 mm or 80 mm, or specifying minimum property values parallel or perpendicular to the rolling direction.
Steel users must communicate directly with individual steel companies to determine specific grade availability and the specific associated parameters and properties, such as:
Chemical composition specifications,
Mechanical properties and ranges,
Thickness and width capabilities,
Hot-rolled, cold-rolled, and coating availability,
Advanced High-Strength Steels (AHSS) exhibit high degrees of work hardening, resulting in improved forming capabilities compared to conventional HSLA steels. However, the same high work hardening creates higher strength and hardness in sheared or punched edges, leading to reduced edge ductility. Microstructural features in some AHSS grades contribute to their sheared edge performance. While laser cutting results in less edge damage than mechanical cutting methods, the heat from laser cutting produces a localized hear treatment, changing the strength and hardness at the edge. Achieving the best formability for chosen processing path requires generating a consistent good quality edge from the cutting operation.
To avoid unexpected problems during a program launch, use production intent tooling as early in the development as possible. This may be a challenge since blanking dies are usually among the last set of tools completed. In the interim, many companies choose to use laser cut blanks. Tool, blank, and process development must account for the lower-ductility sheared edges in production blanks.
Edge Ductility Measurements
This article describes the impact of cutting and cut-edge quality on edge ductility. The primary tests which quantify edge ductility are Hole Expansion Testing, 2-D Edge Tension Testing, and Half Specimen Dome Testing. These links detail the testing procedures. The Hole Expansion Testing article has additional information pertaining to the effect of burr orientation and punch shape.
Cut Edge Quality
Any mechanical cutting operation such as blanking, piercing, shearing, slitting, or trimming reduces edge ductility. Each of these processes generate a zone of high work hardening and a reduced n-value. This work hardened zone can extend one-half metal thickness from the cut edge. This is one reason why edges fail at strains lower than that predicted by the forming limit curve for that particular grade (Note that FLCs were developed based on necking failure, and that edge cracking is a different failure mechanism).
DP and TRIP steels have islands of martensite located throughout the ferritic microstructure, including at the cut edges. These hard particles act as crack initiators and further reduce the allowable edge stretch. Metallurgical changes to the alloy minimize the hardness differences between the phases, resulting in improved edge ductility. Laser, EDM or water jet cutting approaches minimize work hardening at the edges and the associated n-value reduction, also leading to improved edge ductility.
Putting shear angles into cutting tools is a well-known approach to reduce cutting forces. Modifying the cutting tool leads to other benefits in terms of edge ductility. Researchers studied the effects of a beveled punch instead of the traditional flat bottom punch.S-9,S-50, S-52 In these studies, the optimized bevel angle was between 3 and 6 degrees, the shear direction was parallel the rolling direction of the coil with a die clearance of 17%. With the optimal cutting parameters, the hole expansion ratio increased by 60% when compared to conventional flat punching process. As expected, a reduction in the maximum shearing force occurred – by more than 50% in certain conditions. Dropping the shearing force helps reduce the snap through reverse tonnage, leading to longer tool and press life.
Multiple studies examine the trimmed edge quality based on various cutting conditions in mechanical shearing operations and other methods to produce a free edge such as milling and cutting using a laser or water jet. Edge quality varies based on parameters like cutting clearances, shear angles, and rake angles on mechanical shearing operations.
A typical mechanically sheared steel edge has 4 main zones – rollover, burnish, fracture, and burr, as shown in Figure 1.
Figure 1: Cross Section of a Punched Hole Showing the Shear Face Components and Shear Affected Zone.K-10
Parts stamped from conventional mild and HSLA steels have historically relied on burr height as the main measure of edge quality, where the typical practice targeted a burr height below 10% of metal thickness and slightly larger for thicker steel. Finding a burr exceeded this threshold usually led to sharpening or replacing the trim steels, or less likely, adjusting the clearances to minimize the burr.
Greater burr height is associated with additional cold working and creates stress risers that can lead to edge splitting. These splits, however, are global formability related failures where the steel thins significantly at and around the split, independent of the local formability edge fractures associated with AHSS. A real-world example is shown in Figure 2, which presents a conventional BH210 steel grade liftgate with an excessive burr in the blank that led to global formability edge splitting in the draw die. The left image in Figure 2 highlights the burr on the underside of the top blank, with the remainder of the lift below it. The areas next to the split in the right image of Figure 2 shows the characteristic thinning associated with global formability failures.
Figure 2: Excessive burr on the blank led to a global formability split on the formed liftgate. The root cause was determined to be dull trim steels resulting in excessive work hardening.U-6
Due to their progressively higher yield and tensile strengths, AHSS grades experience less rollover and smaller burrs. They tend to fracture with little rollover or burr. As such, detailed examination of the actual edge condition under various cutting conditions becomes more significant with AHSS as opposed characterizing edge quality by burr height alone. Examination of sheared edges produced under various trimming conditions, including microhardness testing to evaluate work hardening after cold working the sheared edge, provides insight on methods to improve cut edge formability. The ideal condition to combat local formability edge fractures for AHSS was to have a clearly defined burnish zone with a uniform transition to the fracture zone. The fracture zone should also be smooth with no voids, secondary shear or edge damage (Figure 3).
Figure 3: Ideal sheared edge with a distinct burnish zone and a smooth fracture zone (left) and a cross section of the same edge (right).U-6
If clearances are too small, secondary shear can occur and the potential for voids due to the multiphase microstructure increases, as indicated in Figure 4. Clearances that are too large create additional problems that include excessive burrs and voids. A nonuniform transition from the burnish zone to the fracture zone is also undesirable. These non-ideal conditions create propagation sites for edge fractures.
Figure 4: Sheared edge with the trim steel clearance too small (left) and a cross section of the same edge (right) showing a micro crack on the edge. Tight clearance leading to secondary shear increases likelihood of edge fracture.U-6
There are multiple causes for a poor sheared edge condition, including but not limited to:
the die clearance being too large or too small,
a cutting angle that is too small,
worn, chipped, or damaged tooling,
improperly ground or sharpened tooling,
improper die material,
improperly heat-treated die material,
improper (or non-existent) coating on the tooling,
misaligned die sections,
worn wear plates, and
out of level presses or slitting equipment.
The higher loads required to shear AHSS with increasingly higher tensile strength creates additional deflection of dies and processing equipment. This deflection may alter clearances measured under a static condition once the die, press, or slitting equipment is placed under load. As a large percentage of presses, levelers, straighteners, blankers, and slitting equipment were designed years ago, the significantly higher loads required to process today’s AHSS may exceed equipment beyond their design limits, dramatically altering their performance.
A rocker panel formed from DP980 provides a good example showing the influence of cut edge quality. A master coil was slit into several narrower coils (mults) before being shipped to the stamper. Only a few mults experienced edge fractures, which all occurred along the slit edge. Understanding that edge condition is critical with respect to multiphase AHSS, the edge condition of the “good” mults and the “bad” mults were examined under magnification. The slit edge from a problem-free lift (Figure 5) has a uniform burnish zone with a uniform transition to the smooth fracture zone. This is in contrast with Figure 6, from the slit edge from a different mult of the same coil in which every blank fractured at the slit edge during forming. This edge exhibits secondary shear as well as a thick burnish zone with a non-uniform transition from the burnish zone to the fracture zone.
Figure 5: Slit edges on a lift of blanks that successfully produced DP980 rocker panels. Note the uniform transition from the burnish zone to the fracture zone with a smooth fracture zone as well.U-6
Figure 6: Slit edges on a lift of blanks from the same master coil that experienced edge fractures during forming. Note the obvious secondary shear as well as the thicker, nonuniform transition from the burnish to the fracture zone.U-6
Cutting Clearances: Burr Height and Tool Wear
Cutting and punching clearances should be increased with increasing sheet material strength. The clearances range from about 6% of the sheet material thickness for mild steel up to 16% or even higher as the sheet metal tensile strength exceeds 1400 MPa.
A study C-2compared the tool wear and burr height formation associated with punching mild steel and several AHSS grades. In addition to 1.0 mm mild steel (140 MPa yield strength, 270 MPa tensile strength, 38% A80 elongation), AHSS grades tested were 1.0 mm samples of DP 350Y600T (A80=20%), DP 500Y800T (A80=8%), and MS 1150Y1400T (A80 = 3%). Tests of mild steel used a 6% clearance and W.Nr. 1.2363 / AISI A2 tool steel hardened to 61 HRC. The AHSS tests used engineered tool steels made from powder metallurgy hardened to 60-62 HRC. The DP 350/600 tests were run with a TiC CVD coating, and a 6% clearance. Tool clearances were 10% for the MS 1150Y1400T grade and 14% for DP 500Y800T.
In the Tool Wear comparison, the cross-section of the worn punch was measured after 200,000 hits. Punches used with mild steel lost about 2000 μm2 after 200,000 hits, and is shown in Figure 7 normalized to 1. The relative tool wear of the other AHSS grades are also shown, indicating that using surface treated high quality tool steels results in the same level of wear associated with mild steels punched with conventional tools.
Figure 7: Tool wear associated with punching up to DP 500Y800T using surface treated high quality tool steels is comparable to mild steel punched with conventional tools.C-2
Figure 8 shows the burr height test results, which compared burr height from tests using mild steel punched with conventional tool steel and two AHSS grades (DP 500Y800T and MS 1150Y1400T) punched with a PM tool steel. The measured burr height from all AHSS and clearance combinations evaluated were sufficiently similar that they are shown as a single curve.
Figure 8: Burr height comparison for mild steel and two AHSS grades as a function of the number of hits. Results for DP 500Y800T and Mart 1150Y1400T are identical and shown as the AHSS curve.C-2
Testing of mild steel resulted in the expected performance where burr height increases continuously with tool wear and clearance, making burr height a reasonable indicator of when to sharpen punching or cutting tools. However, for the AHSS grades studied, burr height did not increase with more hits. It is possible that the relatively lower ductility AHSS grades are not capable of reaching greater burr height due to fracturing, where the more formable mild steel continues to generate ever-increasing burr height with more hits and increasing tool wear.
Punching AHSS grades may require a higher-grade tool steel, possibly with a surface treatment, to avoid tool wear, but tool regrinding because of burrs may be less of a problem. With AHSS, engineered tool steels may provide longer intervals between sharpening, but increasing burr height alone should not be the only criterion to initiate sharpening: cut edge quality as shown in the above figures appears to be a better indicator. Note that regrinding a surface treated tool steel removes the surface treatment. Be sure to re-treat the tool to achieve targeted performance.
Cutting Clearances: General Recommendations
Depending on the source, the recommended die clearance when shearing mild steels is 5% to 10% of metal thickness. For punched holes, these represent per-side values. Although this may have been satisfactory for mild steels, the clearance should increase as the tensile strength of the sheet metal increases.
The choice of clearance impacts other aspects of the cutting process. Small cutting clearances require improved press and die alignment, greater punching forces, and cause greater punch wear from abrasion. As clearance increases, tool wear decreases, but rollover on the cut edge face increases, which in the extreme may lead to a tensile fracture in the rollover zone (Figure 9). Also, a large die clearance when punching high strength materials with a small difference in yield and tensile strength (like martensitic grades) may generate high bending stresses on the punch edge, which increases the risk of chipping.
Figure 9: Large rollover may lead to tensile fracture in the rollover zone.
Figure 10 compares cut edge appearance after punching a martensitic steel with 1400 MPa tensile strength using either 6% or 14% clearance. The larger clearance is associated with greater rollover, but a cleaner cut face.
Figure 10: Cut edge appearance after punching CR 1400T-MS with 6% (left) and 14% (right) die clearance. The bottom images show the edge appearance for the full sheet thickness, Note using 6% clearance resulted in minimal rollover, but uneven burnish and fracture surfaces. In contrast, 14% clearance led to noticeable rollover, but a clean burnish and fracture surface.T-20
A comparison of the edges of a 2 mm thick complex phase steel with 700 MPa minimum tensile strength produced under different cutting conditions is presented in Figure 11. The left image suggests that either the cutting clearance and/or the shearing angle was too large. The right image shows an optimal edge likely to result in good edge ductility.
Figure 11: Cut edge appearance of 2 mm HR 700Y-MC, a complex phase steel. The edge on the right is more likely to result in good edge ductility.T-20
The recommended clearance is a function of the sheet grade, thickness, and tensile strength. Figures 12 to 15 represent general recommendations from several sources.
Figure 12: Recommended Clearance as a Function of Grade and Sheet Thickness.T-23
Figure 13: Recommended Cutting Clearance for Punching.D-15
Figure 14: Recommended die clearance for blanking/punching advanced high strength steel.T-20
Figure 15: Multiply the clearance on the left with the scaling factor in the right to reach the recommended die clearance.D-16
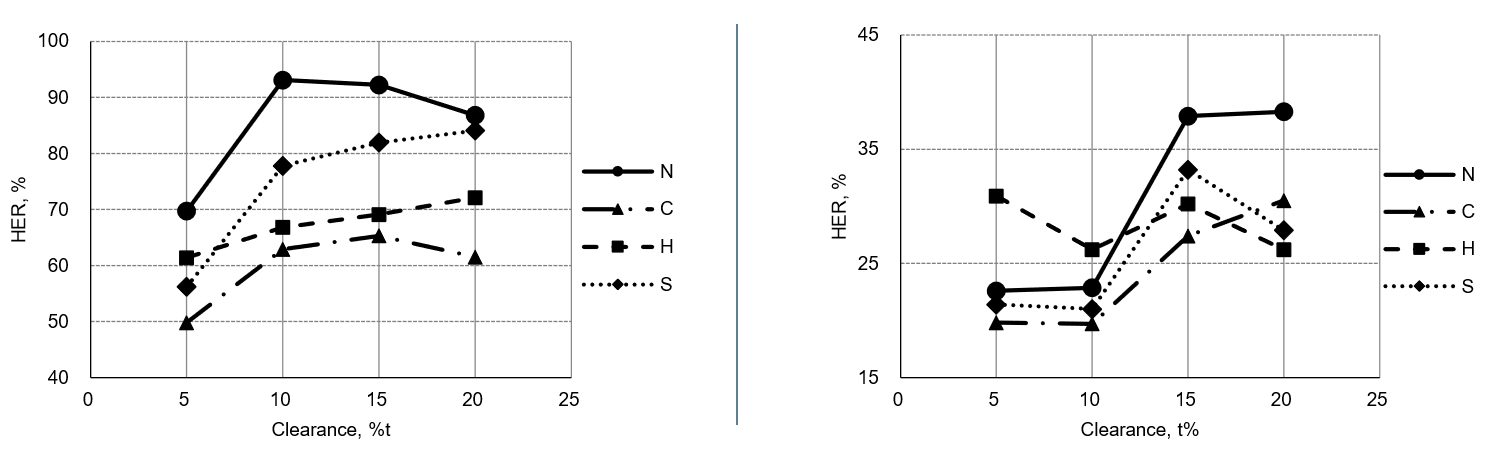
Figure 16 highlights the effect of cutting clearance on CP1200, and reinforces that the historical rule-of-thumb guidance of 10% clearance does not apply for all grades. In this studyU-3, increasing the clearance from 10% to 15% led to a significant improvement in hole expansion. The HER resulting from a 20% clearance was substantially better than that from a 10% clearance, but not as good as achieved with a 15% clearance. These differences will not be captured when testing only to the requirements of ISO 16630, which specifies the use of 12% clearance.
Figure 16: Effect of hole punching clearance on hole expansion of Complex Phase steel grade CP1200.U-3
Cutting speed influences the cut edge quality, so it also influences the optimal clearance for a given grade. In a study published in 2020G-49, higher speeds resulted in better sheared edge ductility for all parameters evaluated, with those edges having minimal rollover height, smoother sheared surface and negligible burr. Two grades were evaluated: a dual phase steel with 780MPa minimum tensile strength and a 3rd Generation steel with 980 MPa minimum tensile strength.
Metallurgical characteristics of the sheet steel grade also affects hole expansion capabilities. Figure 17 compares the HER of DP780 from six global suppliers. Of course, the machined edge shows the highest HER due to the minimally work-hardened edge. Holes formed with 13% clearance produced greater hole expansion ratios than those formed with 20% clearance, but the magnitude of the improvement was not consistent between the different suppliers.K-56
Figure 17: Cutting clearance affects hole expansion performance in DP780 from six global suppliers.K-56
A different studyL-79 looked at the influence of punching clearance on hole expansion of the three AHSS grades shown in Table 1.
Table 1: Tensile and Hole Expansion properties of Three AHSS Grades.L-79
Steel
Type
Thickness
mm
Yield
Strength (MPa)
Tensile
Strength (MPa)
Uniform
Elongation (%)
Elongation
A80 (%)
n-value
at UE
r-value
(at 4%)
hole expansion
ratio, punched (λ, %)
hole expansion
ratio, drilled (λ, %)
DP1000
CR700Y980T-DP-UC
0.8
735
1,074
7.5
10.5
0.073
0.94
37
48
CP1000HD
CR780Y980T-CH-UC
1.5
909
1,062
7.1
10.7
0.068
0.96
86
126
CP1200
CR900Y1180T-CP-GI50/50
1.5
1,079
1,215
5.1
8.3
0.049
0.92
67
137
Transverse orientation, A80 ISO II samples.
Testing was done to the ISO 16630 test procedure, aside from the cutting clearance or the drilled reference condition. Consistent with other studies, a 10% punch-to-die clearance does not produce the best hole expansion performance. The optimal level appears to be at approximately 15% clearance (Figure 18). In this study, burr-free holes were punched until clearance exceeded approximately 25%.
Figure 18: Hole expansion as a function of cutting clearance or drilled holes for three AHSS grades.L-79
Punch Face Design
Practitioners in the field typically do not cut perpendicular to the sheet surface – angled punches and blades are known to reduce cutting forces. For example, long shear blades might have a 2 to 3 degree angle on them to minimize peak tonnages. There are additional benefits to altering the punch profile and impacting angle.
Snap-though or reverse tonnage results in stresses which may damage tooling, dies, and presses. Tools may crack from fatigue. Perhaps counter to conventional thinking, use of a coated punch increases blanking and punching forces. The coating leads to lower friction between the punch and the sheet surface, which makes crack initiation more difficult without using higher forces.
Unlike a coated tool, a chamfered punch surface reduces blanking and punching forces. Figure 19 compares the forces to punch a 5 mm diameter hole in 1 mm thick MS-1400T using different punch shapes. A chamfered punch was the most effective in reducing both the punching force requirements and the snap-through tonnage (the shock waves and negative tonnage readings in Figure 19). The chamfer should be large enough to initiate the cut before the entire punch face is in contact with the sheet surface. A larger chamfer increases the risk of plastic deformation of the punch tip.T-20
Figure 19: A chamfered punch reduces peak loads and snap-through tonnage.K-15
A different study P-16 showed more dramatic benefits. Use of a rooftop punch resulted in up to an 80% reduction in punching force requirements compared with a flat punch, with a significant reduction in snap-through tonnage. Cutting clearance had only minimal effect on the results. (Figure 20)
Figure 20: A rooftop-shaped punch leads to dramatic reductions in punch load requirements and snap-through tonnage.P-16
Use of a beveled punch (Figure 21) provides similar benefits. A study S-52 comparing DP 500/780 and DP 550/980 showed a reduction in the maximum piercing force of more than 50% with the use of a beveling angle between 3 and 6 degrees. The shearing force depends also upon the die clearance during punching, with the optimum performance seen with 17% die clearance. The optimal punching condition results in more than 60% improvement in the hole expansion ratio when compared to conventional flat head punching process. The optimal bevel cut edge in Figure 22 shows a uniform burnish zone with a uniform transition to the smooth fracture zone – the known conditions to produce a high-ductility edge.
Figure 22: A bevel cut edge showing uniform burnish zone with a uniform transition to the smooth fracture zone.S-52
The effect of convex and concave punch geometries are likely a function of the chosen dimensions, the tool material, and the sheet metal being punched. Citation L-XX studied a convex roof top punch shape that is flat in the bottom middle with a 17° angle on both sides and a concave bottom punch shape that is flat on the outer regions with a 5 mm radius hollow shape in the center. The hole expansion response to these punch conditions in the three steels documented in Table 1 above is shown in Figure 23.
Figure 23: ISO 16630 HER ratio vs. cutting tool geometry (orthogonal, concave, convex).L-79
Figure 24 shows the punched edge of the CP1000HD steel, highlighting the variability in edge condition associated with the convex and concave punches. Here, the amount of rollover and burnish varied around the perimeter of the punched hole. The notch stress concentration level in the hollow concave configuration at the transition between flat and curved punch regions leads to punch tool wear, resulting in early chipping after only 22 strokes.
Figure 24. Cut edge morphology as a function of cutting tool geometry when punching CP1000HD.L-79
Effect of Edge Preparation Method on Ductility
A flat trim condition where the upper blade and lower blade motions are parallel and there is no shear rake angle is known to produce a trimmed edge with limited edge stretchability (Figure 25, left image). In addition to split parts, tooling damage and unexpected down time results. Metal stampers have known that shearing with a rake angle Figure 25, right image) will reduce cutting forces compared with using a flat cut. With advanced high strength steels, there is an accompanying reduction in forming energy requirements of up to 20% depending on the conditions, which represents a tremendous drop in snap-through or reverse tonnage. Figure 25 visually describes the upper and lower blade rake angles and the shear rake angle.
Figure 25: Flat trim (left) and shear trim (right) conditions showing rake angle definitions.S-53
Researchers have also found that it is possible to increase sheared edge ductility with optimized rake angles. CitationS-53used 2-D Edge Tension Testingand the Half-Specimen Dome Testto qualify the effects of these rake angles, and determine the optimum settings. After preparing the trimmed edge with the targeted conditions, the samples were pulled in a tensile test or deformed using a hemispherical punch. The effect of the trimming conditions was seen in the measured elongation values and the strain at failure, respectively. The results are summarized in Figures 26-28. Some of the tests also evaluated milled, laser trimmed, and water jet cut samples. Shear Trim 1, 2, and 3 refer to the shear trim angle in degrees. The optimized shear condition also includes a 6-degree rake angle on both the upper and lower blades, as defined in Figure 25.
Conclusions from this study include:
Mechanically shearing the edge cold works the steel and reduces the work hardening exponent (n-value), leading to less edge stretchability.
Samples prepared with processes that avoided cold working the edges, like laser or water jet cutting outperformed mechanically sheared edges.
Optimizing the trim shear conditions or polishing a flat trimmed edge approaches what can be achieved with laser trimming and water jet cutting.
Shearing parameters such as clearance, shear angle and rake angle also play a large part in improving edge stretch.
Figure 26: Effect of edge preparation on stretchability as determined using a tensile test for DP 350Y600T (left) and DP 550Y980T (right).S-53
Figure 27: Effect of edge preparation on stretchability as determined using a dome test for DP 350Y600T (left) and DP 550Y980T (right).S-53
Figure 28: Optimizing the trim shear conditions or polishing a flat trimmed edge approaches what is achievable with laser trimming and water jet cutting. Data from dome testing of DP 350Y/600T.S-53
The optimal edge will have no mechanical damage and no microstructural changes as you go further from the edge. Any process that changes the edge quality from the bulk material can influence performance. This includes the mechanical damage from shearing operations, which cold works the edge leading to a reduction in ductility. Laser cutting also changes the edge microstructure, since the associated heat input is sufficient to alter the engineered balance of phases which give AHSS grades their unique properties. However, the heat from laser cutting is sometimes advantageous, such as in the creation of locally softened zones to improve cut edge ductility in some applications of press hardening steels.
The effects of edge preparation on the shear affected zoneis presented in Figure 29. A flatter profile of the Vickers microhardness reading measured from the as-produced edge into the material indicates the least work-hardening and mechanical damage resulting from the edge preparation method, and therefore should result in the greatest edge ductility. This is certainly the case for water jet cutting, where a flat hardness profile in Figure 29correlates with the highest ductility measurements in Figures 25 to 28. Unfortunately, water jet cutting is not always practical, and introduces the risk of rust forming at the newly cut edge.
Figure 29: Microhardness profile starting at cut edge generated using different methods. Left image is from Citation S-53, and right image is from C-13.
Two-stage piercing is another method to reduce edge strain hardening effects. Here, a conventional piercing operation is followed by a shaving operation which removes the work-hardened material created in the first step, as illustrated in Figure 30.P-17 A related studyF-10evaluated this method with a 4 mm thick complex phase steel with 800 MPa tensile strength. Using the configuration documented in this reference, single-stage shearing resulted in a hole expansion ratio of only 5%, where the addition of the shaving operation improved the hole expansion ratio to 40%.
Figure 31 highlights the benefits of two-stage pre-piercing for specific grades, showing a 2x to 4x improvement in hole expansion ratio for the grades presented.
Figure 31: Pre-piercing improves the hole expansion ratio of AHSS Grades.S-10
Confirmation of the benefits of pre-piercing is seen in another study that centered on a 780 MPa grade hot rolled steel.U-16 This work compared conventional single punching, double punching, and use of a humped punch. The set-up used in this evaluation is summarized in Figure 32.
Figure 32: Set-up conditions for Single Punch (SPM), Double Punch (DPM), and Humped Punch Methods.U-16
The conventional single punch method was used to expand a 30 mm diameter hole, and the grade studied showed a hole expansion ratio (λ) of 80%. Both the double punch method and the humped punch approach using the dimensions of condition C from Figure 32 produced a λ of between 105% and 110%, for an improvement ratio (λ/λSPM) on the order of 35% of the conventional method. The relative lengths of the rollover, burnished, and fracture zones of the cut edges were measured, but no trend of hole expansion performance against these dimensions were observed.
The influence of the initial hole size was also studied, using a 10 mm diameter hole that is consistent with the requirements of ISO 16630. Here, the DPM approach produced an improvement ratio (λ/λSPM) of more than 55% of the value obtained from the conventional punching method. One of the HPM conditions (narrow punch, deeper penetration) resulted in an improvement ratio close to 35%. Similar to the larger diameter holes, there did not appear to be a correlation between the dimensions of the cut edge zones and hole expansion.
For the pre-piercing Double Punch Method, the improved hole expansion was attributed to the large deformation on the scrap side and depressing plastic strain in the punched edge. For the Humped Punch Method, the improvement was attributed to the increased stress triaxiality of the blank by the humped part and a reduced work hardening owing to the mechanics of the punching operation.
For at least the larger diameter hole, the Humped Punch Method saw the same improvement as the Double Punch Method, but with fewer manufacturing steps.
Furthermore, shaving, or pre-piercing, was also shown to be beneficial on 1.6 mm steel with 1280 MPa tensile strength.Y-16 Using that technique, the hole expansion ratio was approximately three times that measured in the conventionally prepared hole pierced with a 10% metal thickness clearance. This led to a substantial reduction in residual stresses on the cut edge, which in turn dramatically improves resistance to hydrogen embrittlement and delayed cracking.
Creating a Visual Guide for Shear Face Assessment (based on Citation S-118)
With conventional grades, monitoring burr height and ensuring that it remains less than 10% of the sheet thickness is the primary action that most companies take to minimize the risk of cracks coming from edge stretching.
For advanced grades, the importance of burr height decreases. In these steels, both the hardness uniformity of microstructural components as well as the uniformity of the manufactured edge influence the degree to which an edge can be expanded before fracturing.
Quantifying visual uniformity is, of course, challenging. Citation S-118 shows the steps involved in creating a visual matrix of edge quality, with the highlights presented below. This content is intended for general information only. No license under any patents or other proprietary interests is implied by this content. Those making use of or relying upon the material assume all risks and liability arising from such use or reliance.
Creating a Visual Reference
Different tests can be done to characterize edge expandability. The sheared edge tension (SET) test focuses on two-dimensional (2D) deformation, and the half specimen dome test (HSDT) characterizes three-dimensional (3D) deformation. Although the HSDT may be a better representation of reality, there is greater access to tensile testing machines for SET testing. For this reason, the discussion below centers on SET testing only.
The first step is to create edges with different visual characteristics. In production slitting this can be accomplished by varying the vertical and horizontal clearances between slitter knives. In a laboratory environment, the shear rake angle and the cutting clearance can be varied.
Next, samples for tensile testing are produced. The SET test sample can be either a rectangle with both long edges sheared under the conditions of interest, or have one side sheared with the other side milled to half of a conventional dogbone sample (Figure 33). Half-dogbone samples may be preferred, since the central section of reduced width promotes failure in the monitored gauge region.
Figure 33: Sheared Edge Tension Test Samples. Bottom configuration promotes failure in the gauge region.
Create test coupons under conditions that represent the extremes of what will be encountered in production as well as many variants of the conditions falling within these extremes. Create an additional sample where both edges are milled to a conventional dogbone shape. The elongation from this sample represents the reference condition showing what is achievable with an optimum edge. All other sheared samples are considered relative to this value.
For each sheared condition, measure the decrease relative to the value from the milled condition. Rank these and group them into practical categories as the data suggests. For example: Reduction of elongation up to 10% relative to the milled condition, Reduction of elongation between 10% and 20% relative to the milled condition, Reduction of elongation more than 20% relative to the milled condition. The production or laboratory conditions that produced each of these results are known, and those conditions falling into that first category are better than those conditions that result in the third category.
The final step is to take the samples and photograph the edges. Group these photographs into the same categories as before to create a visual representation that can distinguish a good edge from a less than ideal one. Monitor edge quality during production. If the visual appearance veers away from that associated with the desired Group 1, then adjust the shearing conditions like clearance and alignment back to the nominal conditions as documented to create the Group 1 edges.
Case Study: Creating a Visual Guide for Shear Face Assessment (based on Citation S-118)
Using the framework described above, 23 different combinations of production shearing conditions were evaluated, and Sheared Edge Tensile samples were used to determine the elongation to fracture. A milled dogbone sample was used as reference. The results were ranked, and displayed in Figure 34. Additional testing found that results from mechanically shearing were the same as the trends from production shearing shown in Figure 35.
Figure 34: Total Elongation Measured in Sheared Edge Tension Test At Different Slitting Conditions. (Citation S-118)
Reduction in edge stretchability was determined as the difference in ductility between the sheared edge produced under many different cutting conditions and the optimal milled edge. These results were grouped into five categories, with Level 1 being the closest to the elongation from milled edges and Level 5 representing the most dramatic decrease in elongation.
A macro-photograph of the shear face was taken from cutting condition to aid in distinguishing between the resultant features, and grouped into the five categories of edge stretchability reduction. This collection of images is presented in Figure 35.
Figure 35: Shear Face Edge Condition Guideline for Edge Stretchability (Citation S-118)
Although these pictures cannot fully cover all types of appearance among all cutting conditions, this approach provides the basis for creating a visual guideline that production locations can use to assess the potential stretchability of the edges that are being produced with the existing set-up. Should edge quality appearance not match the target, then plant personnel must take appropriate actions to avoid edge cracking.
Key Points
Clearances for punching, blanking, and shearing should increase as the strength of the material increases, but only up to a point. At the highest strengths, reducing clearance improves tool chipping risk.
Lower punch/die clearances lead to accelerated tool wear. Higher punch/die clearances generate more rollover/burr.
ISO 16630, the global specification for hole expansion testing, specifies the use of 12% punch-to-die clearance. Optimized clearance varies by grade, so additional testing may prove insightful.
Recommended clearance as a percentage of sheet thickness increases with thickness, even at the same strength level.
Burr height increases with tool wear and increasing die clearances for shearing mild steel, but AHSS tends to maintain a constant burr height. This means extended intervals between tool sharpening may be possible with AHSS parts, providing edge quality and edge performance remain acceptable.
Edge preparation methods like milling, laser trimming, and water-jet cutting minimize cold working at the edges, resulting in the greatest edge ductility,
Laser cut blanks used during early tool tryout may not represent normal blanking, shearing, and punching quality, resulting in edge ductility that will not occur in production. Using production-intent tooling as early as possible in the development stage minimizes this risk.
Shear or bevel on punches and trim steel reduces punch forces, minimizes snap-through reverse tonnage, and improves edge ductility.
Mild steel punched with conventional tools and AHSS grades punched with surface treated engineered PM tool steels experience comparable wear.
Maintenance of key process variables, such as clearance and tool condition, is critical to achieving long-term edge stretchability.
The optimal edge appearance shows a uniform burnish zone with a uniform transition to a smooth fracture zone.
Thanks are given to Hua-Chu (Michael) Shih, Senior Research Engineer, United States Steel Corporation, for his contributions to the Shear Face Assessment section. Hua-Chu Shih is responsible for developing technical solutions for automotive applications, utilizing the advanced high strength steel portfolio of U.S. Steel and research in the areas of formability, processing, fracture in forming AHSS, die wear, coating adhesion, Tribology and dent resistance. He earned his Ph.D. and M.S. degree in Mechanical Engineering at Northwestern University.
The term local formability describes when part and process design, in addition to sheet metal properties like strength and elongation, influence the amount of deformation the metal can undergo prior to failure. Cutting, punching or other methods of obtaining a trimmed blank or an internal hole results in cracks, rough edges, work-hardening and other edge damage – all of which influences edge quality. The challenges of capturing all of the factors that influence edge quality makes the prediction of fracture severity and cut edge expansion very difficult and usually impossible. The many variables highlight the need for a standardized test method. However, restricted sample preparation and testing variables in these standards do not reflect the variety of conditions encountered in production environments. Use caution when comparing results generated under different conditions.
Hole Expansion Testing
The Hole Expansion test (HET) quantifies the edge stretching capability of a sheet metal grade having a specific edge condition. Higher values of the hole expansion ratio are associated with grades and forming methods more likely to have improved local formability characteristics.
Steel producers study hole expansion capacity to create new products with targeted edge stretching performance through modifications of chemistry, rolling and thermal practices. Product designers use the hole expansion test to determine if the chosen steel grade has the inherent forming characteristics to meet their targeted shape with their chosen forming system. If they are not compatible, the chosen grade must change or aspects of the forming process must change, or possibly both.
ISO 16630 is the primary standard used which describes the test method and constraints.I-9 Others, like JIS Z 2256J-6 are based on the ISO standard, with only minor differences, if any. This standard specifies use of a 10mm diameter hole created with a 12% clearance. The sample containing the hole is clamped in place, and a conical punch having a 60 degree apex angle expands that initial hole (Figure 1). The test stops after observation of a through-thickness crack or upon experiencing a load-drop exceeding a critical threshold (Figure 2). The hole expansion ratio (HER), also known as the Hole Expansion Capacity (HEC), is simply the percent expansion of the diameter of the initial hole, typically shown as the Greek letter lambda, λ.
Figure 2: Expanded Edge at the end of a Hole Expansion Test performed using a conical punch. The arrow points to the through-thickness crack that ended the test.E-2
The sample preparation and testing requirements of ISO 16630 are well-defined for good reason. Factors known to influence the hole expansion ratio include:
Method used to finish the hole (blanking, reaming, etc.)
Even with these rigorously defined procedures, the test results can be heavily influenced by specimen preparation technique, specific test parameters, and human subjectivity – in other words, poor gage R&R (repeatability and reproducibility). For example a group of European steel researchers reported “an unacceptably large difference between labs” with regard to hole expansion testing. They ultimately concluded that the “difference is too large for the method to be useful in practice”. A-76
Testing sheet steels of different thicknesses in a laboratory setting requires having multiple punches and/or dies of different diameter to maintain a consistent clearance, which is based on a percentage of the sheet thickness tested.
In production, the punch-to-die clearance can change during the life of the part, both from tooling wear as well as press misalignment. There is the additional risk that clearance can vary around the perimeter of the cut section, leading to inconsistent performance. Increasing sheet metal strength magnifies this issue.
In the example shown in Figure 3, the hole expansion ratio is reduced from 280% for a milled or water jet edge down to 80% for a traditional cut edge. If clearances further increase – which could happen without proper tooling maintenance over the life of the part – the ability to expand a cut edge further decreases.
Figure 3: Hole Expansion Capacity Decreased as Edge Quality Decreases. (Based on data from Citation H-1.)
Figure 4 highlights the effect of punched vs machined holes, showing the edge damage from punching lowers the hole expansion capability. This edge damage becomes a key component of what is known as the Shear Affected Zone, or SAZ. DP steels and TRIP steels have a large hardness difference between the constituent phases, and therefore are associated with lower hole expansion ratios than HSLA and CP steels, where the phases are of more similar hardness. The influence of the metallurgical phase hardness difference is explored here. Detailed studies of sheared edge stretchability as a function of clearance, edge preparation, and grade are shown in Citations K-6 and K-10.
Figure 4: Hole expansion test results comparing punched and machined holes showing effect of damage to edge stretchability. (Based on data from Citation V-1.)
Over time, the targeted edge quality degrades and targeted clearance changes without proper attention. A study documented in Citation C-1 evaluated the hole expansion ratio created by hole punching tools as they wore in a production environment. Tools evaluated were made from 60 HRC uncoated Powder Metallurgy tool steels. Data in Figure 5 show the percent hole expansion from newly ground punches and dies (Sharp Tools) and from used production punches and dies (Worn Tools). The radial clearance was 0.1 mm. A rust preventative oil was applied to the steels during the punching; a lubricant oil was applied during hole expansion. Tool wear and possible micro-chipping resulted in a poor edge condition. The clearance was not significantly affected, but the steel edges suffered cold work which dramatically affected their hole expansion results.
Figure 5: Impact of production tooling condition on hole expansion performance. (tests conducted w 50 mm diameter conical punch).C-1
The ISO 16630 specificationI-9 eliminates one variable by prescribing the use of a 10 mm diameter hole, but it is important to understand that starting hole diameter influences the degree to which that hole can be expanded. A study that included mild steels to AHSS grades evaluated the effect of starting hole diameter.I-10 All steels were 1.2mm, punched with a clearance of 12.5%, and expanded with a conical punch having a 60° apex angle. As the starting diameter increases, the degree to which the hole can be expanded decreases, Figure 6. Note that as the strength increases, this effect appears to be minimized.
Figure 6: Hole Expansion Ratio Decreases as Initial Hole Diameter Increases.I-10
Increasing the starting hole diameter may help to distinguish between different grades.K-11 Similar hole expansion performance exists between DP980 and TRIP780 under ISO 16630 test conditions (punched 10 mm hole). It is easier to discern better performance in the TRIP780 product when performing a similar test with a 75 mm diameter punched hole (Figure 7).
Figure 7: Effect of Initial Punched Hole Diameter on Hole Expansion. (Based on Data from Citation K-11.)
The position of the burr relative to the punch affects performance in a hole expansion test. Detrimental effects of an expanding edge are minimized If the burr is on the punch side. Having the burr on the punch side, rather than the freely expanding side, minimizes the detrimental effects of the expanding edge. The primary reason is the outer surface is in a greater degree of tension than the surface next to the punch.
Figure 8 examines the effect of edge condition and clearance on DP 590 expanded with a conical punch.K-10 The data suggests that there could be up to a 20% increase in sheared edge extension capability just related to the burr position on holes punched with conventional clearances. This should be considered in die processing materials and designs sensitive to edge expansion.
Figure 8: The Effect of Burr Orientation on Hole Expansion as a Function of Clearance on DP590. “Burr Up” means away from the punch; “Burr Down” means in contact with the punch.K-10
Shown in Figure 9 is the influence of burr orientation and material grade.K-10 The 50XK grade shown is HSLA 350Y/450T, where there is a significant improvement in the measured hole expansion related to the position of the burr relative to the punch. The magnitude of this difference decreases as strength increases, but persists for all grades tested.
Figure 9: The Effect of Burr Orientation on Hole Expansion as a Function of Different High Strength Steel Grades “Burr Up” means away from the punch; “Burr Down” means in contact with the punch.K-10
The shape of the punch used to expand the hole impacts the degree to which it can be expanded. Figure 10 shows generalizations of the three most-common shapes: a conical punch, a flat punch, and a hemispherical punch.
Figure 10: Sketches of Punches Used for Hole Expansion: Conical, Flat, and Hemispherical.
Metal motion and appearance changes depending on the type of punch used. Using a conical punch leads to the shape shown in Figure 11a, with a flat punch leading to the appearance shown in Figure 11b.S-3 The operations are sometimes described as hole expansion when accomplished with a conical punch, and hole extrusion with use of a flat punch.
Figure 11a: Sample appearance after testing with conical punch.S-3
Figure 11b: Sample appearance after testing with flat punch.S-3
The ISO 16630 hole expansion test specifies the use of a conical punch with a 60 degree apex angle. Here, the free edge undergoes stretching and bending. Using a flat punch instead of a conical punch eliminates the bending component, and all deformation is from only edge stretching. These strain state differences lead to different sheared edge extension performance, with greater expansion prior to cracking achieved with holes expanded using a conical punch. This improved performance with conical rather than flat punches has been attributed to the presence of the bending component.N-10 Edge condition does not appear to influence hole expansion capability when a flat bottom punch is used.
Shown in Figures 12 to Figure 15 are the effects of burr orientation and punch type, which vary as a function of metal grade. Figure 16 compares the performance of reamed holes when expanded with either conical or flat punches. Where the tested grades perform similarly when expanded with a flat punch, the conical punch leads to exceptional performance of reamed holes of 3 of the 4 grades. The relatively poor performance of the DP780 grade may be due to the hardness differences between the ferrite and martensite components, noting that there is more martensite in DP780 than DP 600. In the study from which the data was taken, the complex phase steels had a yield/tensile ratio of approximately 87%, while for the dual phase grades the yield/tensile ratio was approximately 60%.P-13
Figure 12: Effect of Burr Orientation on Hole Expansion from a Conical Punch. (Based on Data from Citation P-13.)
Figure 13: Effect of Burr Orientation on Hole Expansion from a Flat Punch. (Based on Data from Citation P-13.)
Figure 14: Effect of Punch Type on Hole Expansion of Sheared Holes with Burr In Contact With The Punch. (Based on Data from Citation P-13.)
Figure 15: Effect of Punch Type on Hole Expansion of Sheared Holes with Burr Facing Away From The Punch. (Based on Data from Citation P-13.)
Figure 16: Effect of Punch Type on Hole Expansion of Reamed Holes. (Based on Data from Citation P-13.)
Figure 17 compares the simulation results from expanding a perfect edge (no burr, no strain) with a conical punch on the left and a spherical punch on the right.W-2 The color scale, based on a “damage” parameter, shows that a spherical punch results in a more uniform distribution of damage, especially at the edge. This suggests that the impact of burr orientation on hole expansion is less significant for this punch geometry.
Flanging with a conical punch causes high circumferential strain and high damage values at the outer edge. The inner edge of the sheet initially presses against the punch, and later stretches during flanging. Since cracks initiate at the fracture zone, using a conical punch with the burr facing the punch leads to a greater hole expansion capability than when having the burr in contact with a spherical punch.
Fracture initiates at the edge, and orienting the burr so that it is in contact with the punch leads to a greater hole expansion value.
Figure 17: Distribution of damage values in simulated hole expansion tests conducted with a conical punch (left image) and a hemispherical punch (right image).W-2
Improving Hole Expansion with New Punch Shapes
As explained above, the degree to which a sheared edge can be stretched before fracture is a function of many parameters, including the shape of the punch. Also contributing is the hardness uniformity of the microstructural phases, where grades with components having high hardness differences are associated with relatively lower hole expansion capability.
Researchers evaluated the effects of punch design and clearance on hole expansion capability of dual phase and ferrite-bainite steels, each with a tensile strength of approximately 780 MPa.L-47
In addition to a conventional flat punch face, other punch types studied were those with a beveled face, a humped shape, and a newly designed punch which combines the benefits of the prior two types. A chamfered or beveled punch is known to reduce punch forces and reverse snap-through loads, while at the same time improve edge quality and hole expansion by minimizing the hardness increases found in the shear affected zone.
Use of the humped punch (Figure 18) led to hole expansion improvements of up to 10%, compared with a conventional flat punch when testing either the DP or FB products. When comparing the edge characteristics, the humped punch results in an increased rollover zone. The authors attributed this to the hump geometry imposing axial tension on the steel during punching, thereby increasing stress triaxiality. Increases in stress triaxiality results in a reduction in effective stress even at the same average stress. This in turn lowers the plastic deformation at the sheared edge which minimizes edge fracture. For these reasons, the increases in stress triaxiality associated with the humped punch promotes higher levels of hole expansion.
Figure 18: Humped punch design used in Citation L-47.
A newly designed punch which combines a beveled and humped design (Figure 19) increases hole expansion by more than 30% in both dual phase and ferrite-bainite steels (Figure 20). As explained above, the newly designed punch is effective in promoting stress triaxiality and minimizing the plastic deformation near the sheared edge. Furthermore, the beveled design improves the shear affected zone (SAZ) characteristics, leading to improved sheared edge expandability as measured in a hole expansion test.
Figure 19: New punch design incorporating features of beveled and humped punches.L-47
Figure 20: Effect of punch type and clearance on the hole expansion ratio of 780 MPa tensile strength steels. Left graph represents ferrite-bainite steel; right graph represents a dual phase steel. Legend: N=new punch design; C=conventional; H=humped; S=shear (beveled).L-47
Correlation of Hole Expansion Ratio with Tensile Properties
The complexities of hole expansion testing, as well as relatively few laboratories with the necessary test equipment and expertise, have led researchers to look for a correlation between the hole expansion ratio and conventionally measured properties obtained from a tensile test like the yield and tensile strength, uniform and total elongation, n-value, and r-value. Researchers even studied manipulations such as the yield-to-tensile ratio, tensile strength multiplied by uniform elongation, and n-value multiplied by r-value. Unfortunately, none of these properties or combinations have suitable correlation with the hole expansion ratio.
Recent work has shown a promising correlation between the hole expansion ratio and the true thinning strain at fracture. Our article on true fracture strain, describes this in greater detail.
Complex Phase (CP) steels combine high strength with relatively high ductility. The microstructure of CP steels contains small amounts of martensite, retained austenite and pearlite within a ferrite/bainite matrix. A thermal cycle that retards recrystallization and promotes Titanium (Ti), Vanadium (V), or Niobium (Nb) carbo-nitrides precipitation results in extreme grain refinement. Minimizing retained austenite helps improve local formability, since forming steels with retained austenite induces the TRIP effectproducing hard martensite.F-11
The balance of phases, and therefore the properties, results from the thermal cycle, which itself is a function of whether the product is hot rolled, cold rolled, or produced using a hot dip process. CitationP-18indicates that galvannealed CP steels are characterized by low yield value and high ductility, whereas cold rolled CP steels are characterized by high yield value and good bendability. Typically these approaches require different melt chemistry, potentially resulting in different welding behavior.
CP steel microstructure is shown schematically in Figure 1, with the grain structure for hot rolled CP 800/1000 shown in Figure 2. The engineering stress-strain curves for mild steel, HSLA steel, and CP 1000/1200 steel are compared in Figure 3.
Figure 1: Schematic of a complex phase steel microstructure showing martensite and retained austenite in a ferrite-bainite matrix.
Figure 2: Micrograph of complex phase steel, HR800Y980T-CP.C-14
Figure 3: A comparison of stress strain curves for mild steel, HSLA 350/450, and CP 1000/1200.
DP and TRIP steels do not rely on precipitation hardening for strengthening, and as a result, the ferrite in these steels is relatively soft and ductile. In CP steels, carbo-nitride precipitation increases the ferrite strength. For this reason, CP steels show significantly higher yield strengths than DP steels at equal tensile strengths of 800 MPa and greater. Engineering and true stress-strain curves for CP steel grades are shown in Figure 4.
Figure 4: Engineering stress-strain (left graphic) and true stress-strain (right graphic) curves for a series of CP steel grades. Sheet thickness: CP650/850 = 1.5mm, CP 800/1000 = 0.8mm, CP 1000/1200 = 1.0mm, and Mild Steel = approx. 1.9mm.V-1
Table 1 compares galvannealed Dual Phase and Complex Phase steels having similar tensile strength and elongation as measured in a tensile test. The characteristics with the biggest difference are the yield strength and the hole expansion ratio which is a measure of cut-edge stretchability.
In the VDA-238 bending test, 980 DP exhibited a significant fracture with a bending angle of 67°. The 980 CP showed no fracture at 80°, and was capable of bending to over 100° before fracturing, Figure 5.N-33 The galvannealed 980 CP suppressed crack generation in axial crushing deformation to a much greater degree than the 980 DP.
Figure 5. Bendability of 980 DP (sample A) and 980 CP (sample B).N-33
Examples of typical automotive applications benefitting from these high strength steels with good local formabilityinclude frame rails, frame rail and pillar reinforcements, transverse beams, fender and bumper beams, rocker panels, and tunnel stiffeners.
Some of the specifications describing uncoated cold rolled 1st Generation complex phase (CP) steel are included below, with the grades typically listed in order of increasing minimum tensile strength and ductility. Different specifications may exist which describe hot or cold rolled, uncoated or coated, or steels of different strengths. Many automakers have proprietary specifications which encompass their requirements.
ASTM A1088, with the terms Complex phase (CP) steel Grades 600T/350Y, 780T/500Y, and 980T/700Y A-22
EN 10338, with the terms HCT600C, HCT780C, and HCT980C D-18
VDA239-100, with the terms CR570Y780T-CP,CR780Y980T-CP, and CR900Y1180T-CPV-3
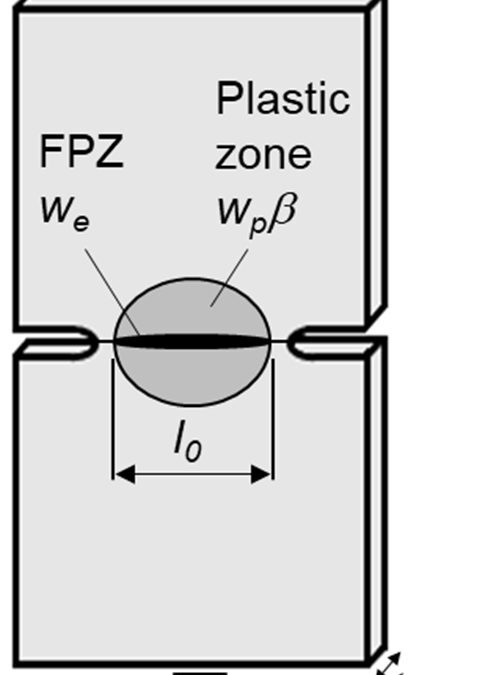
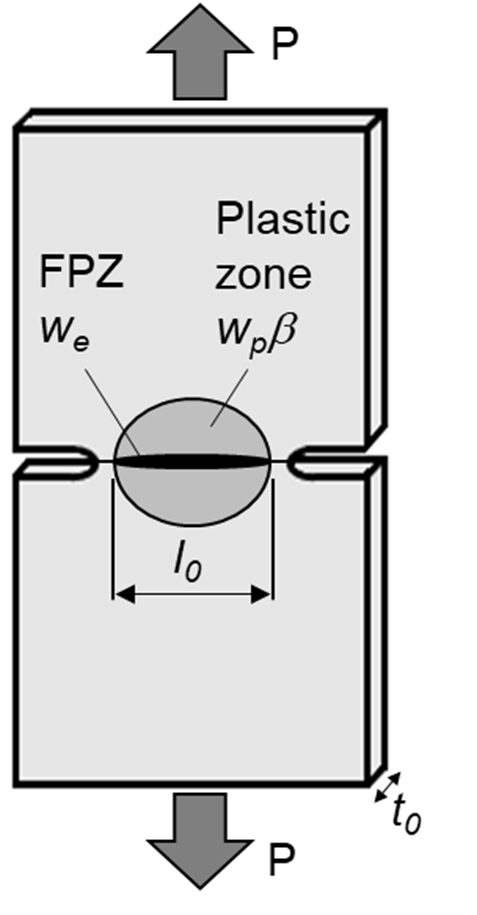
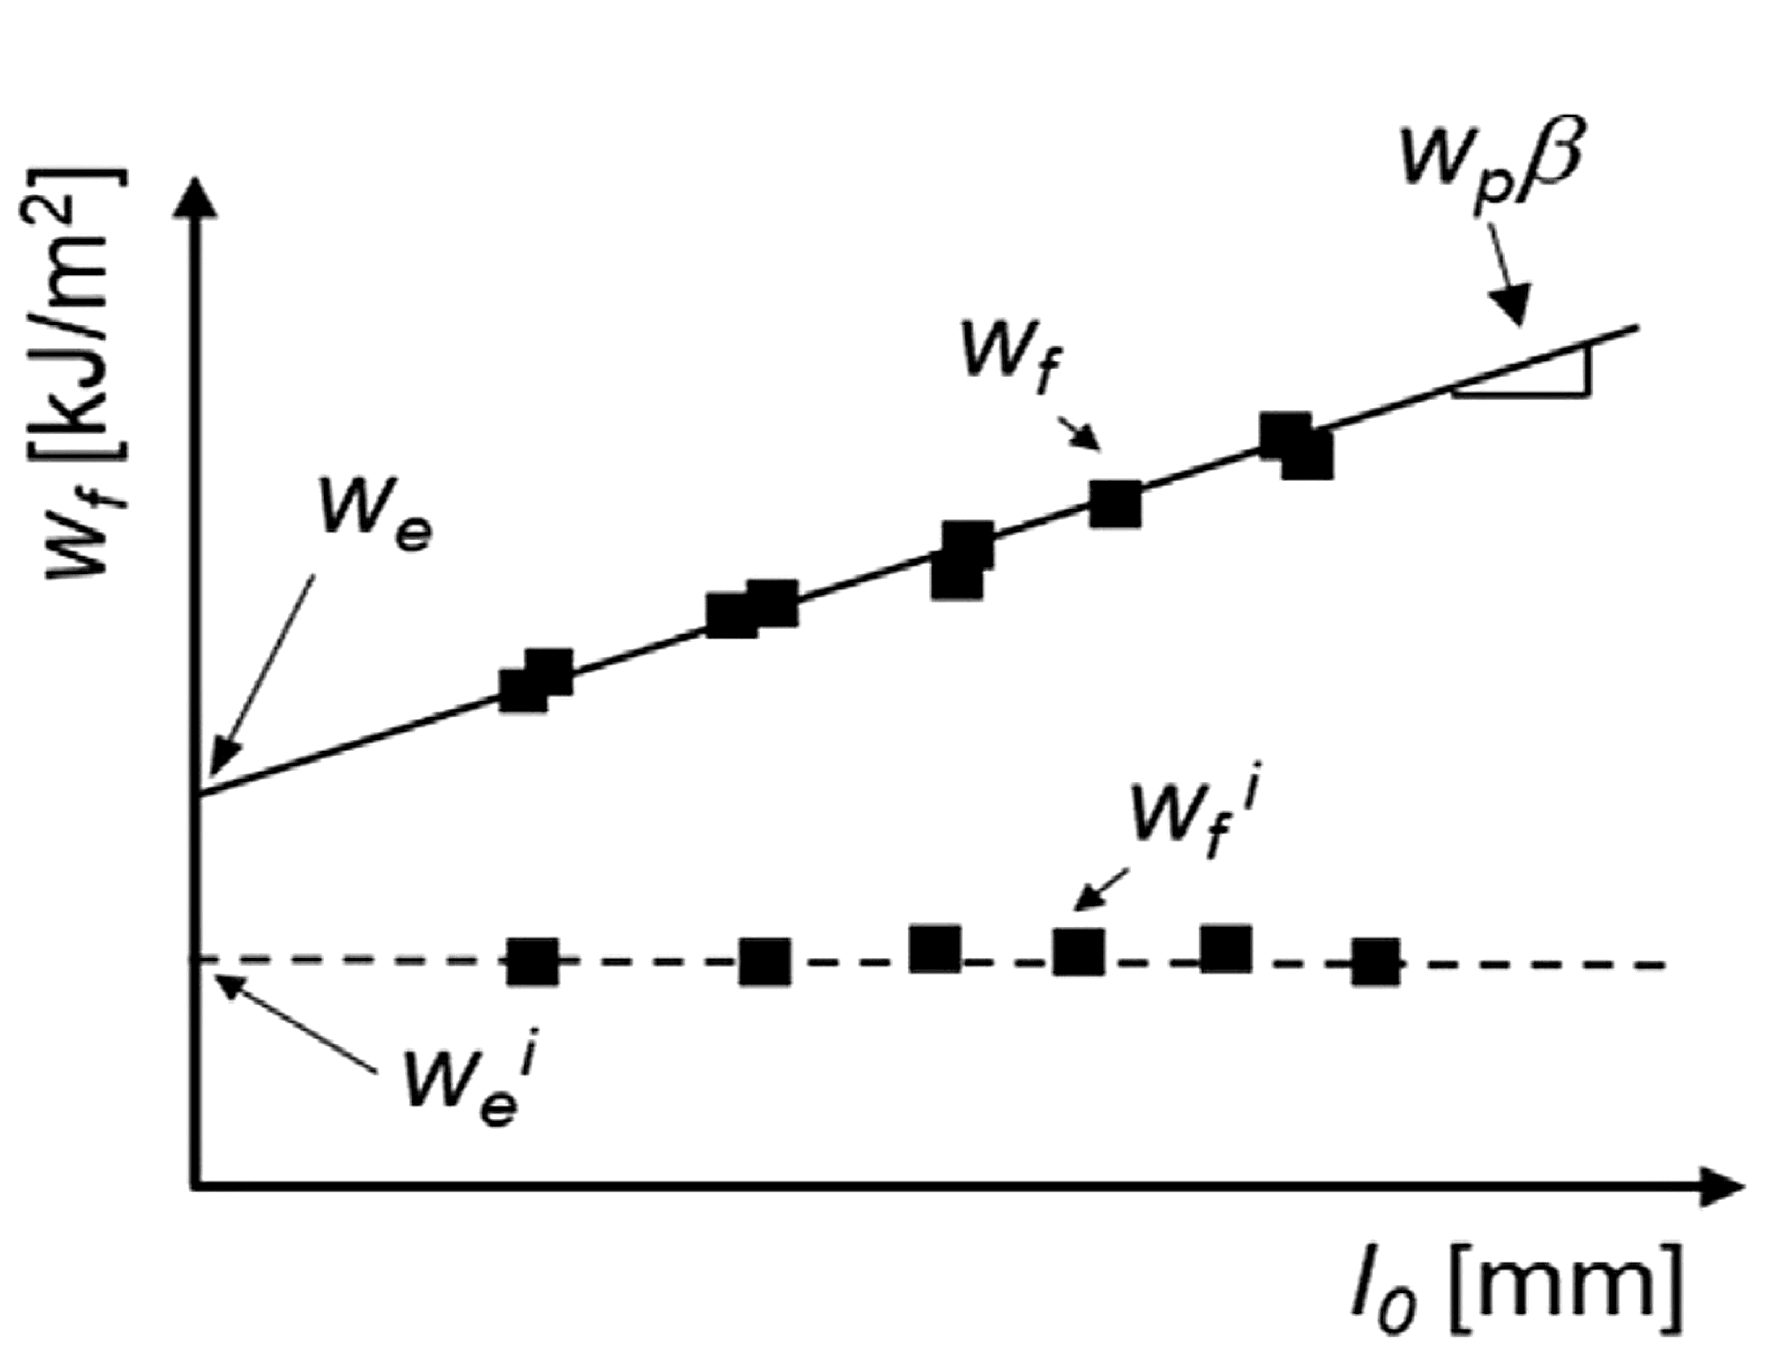
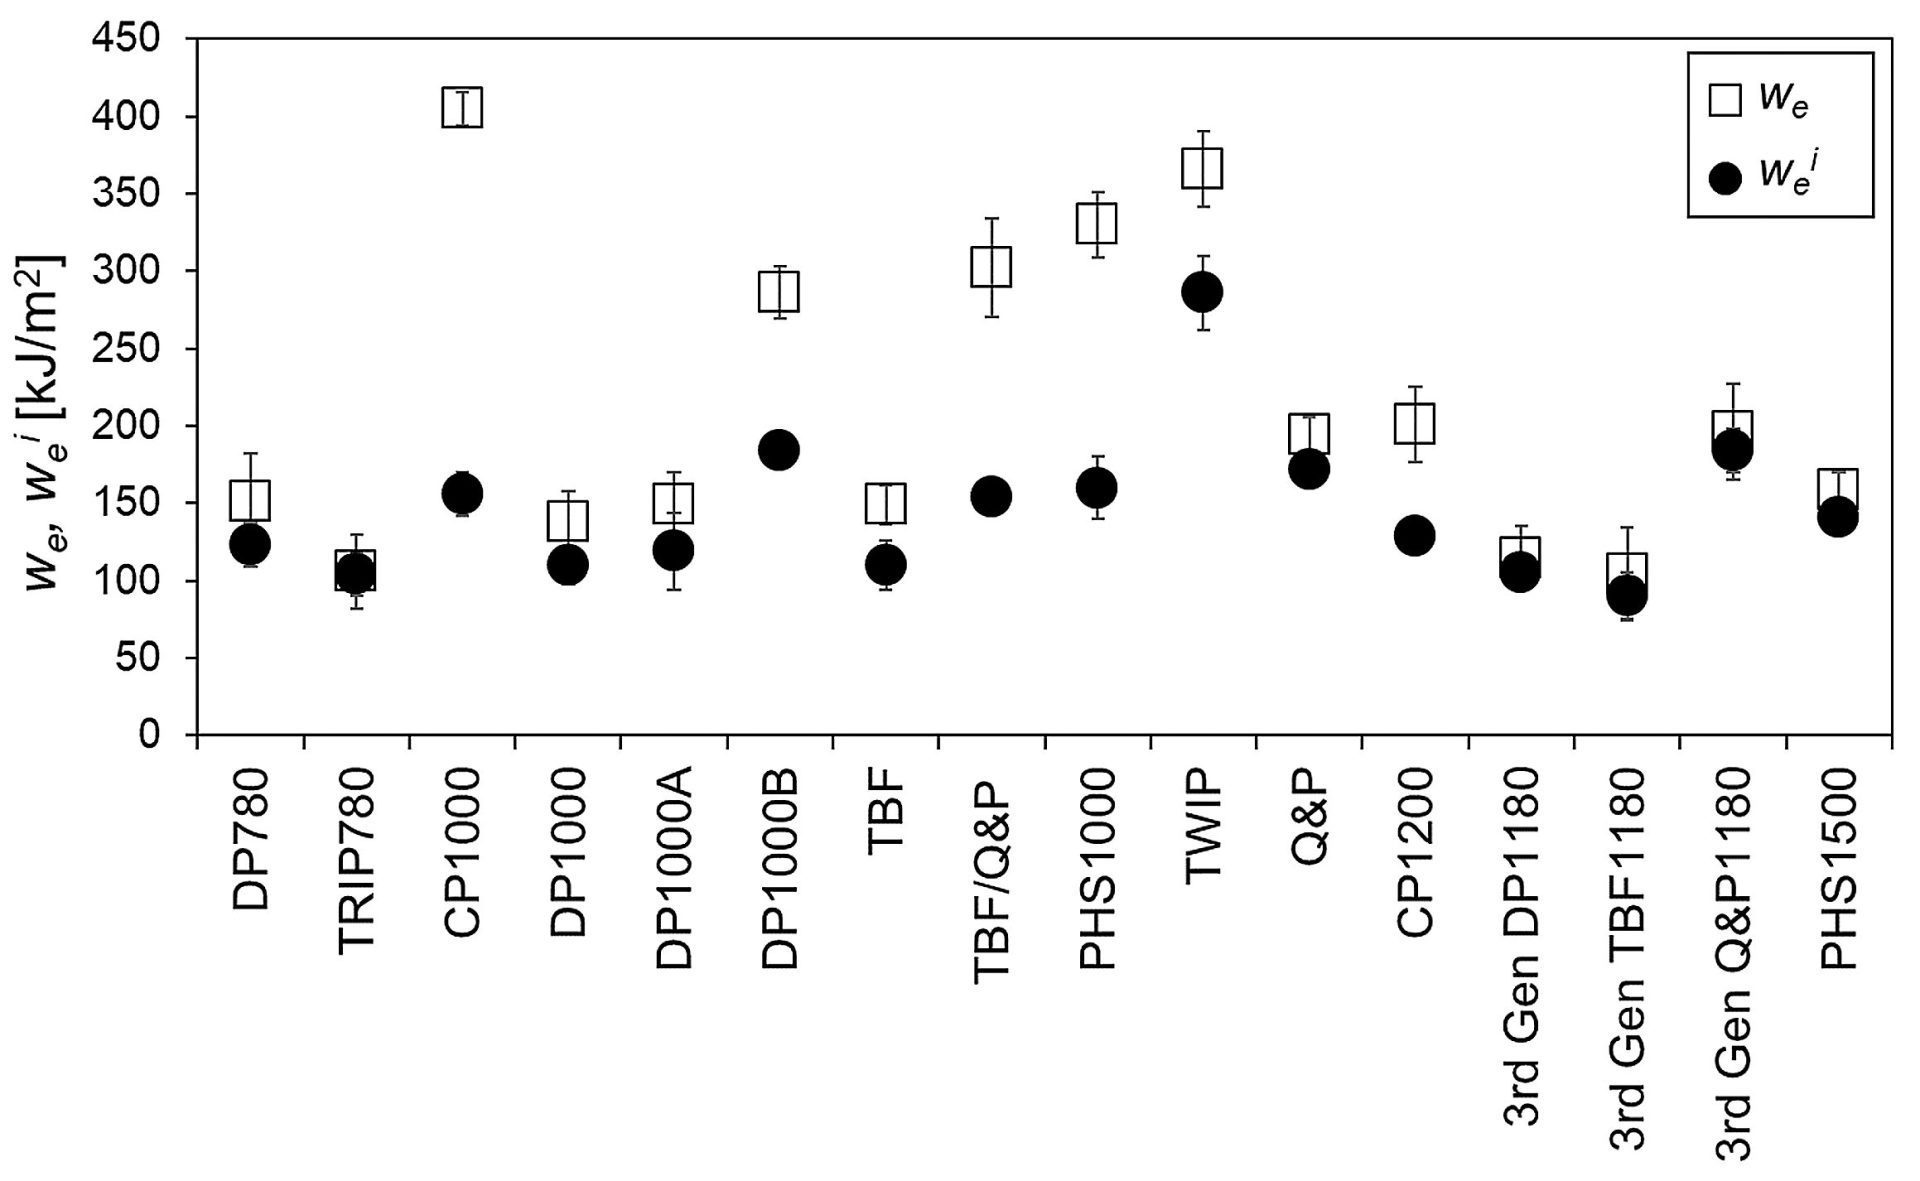
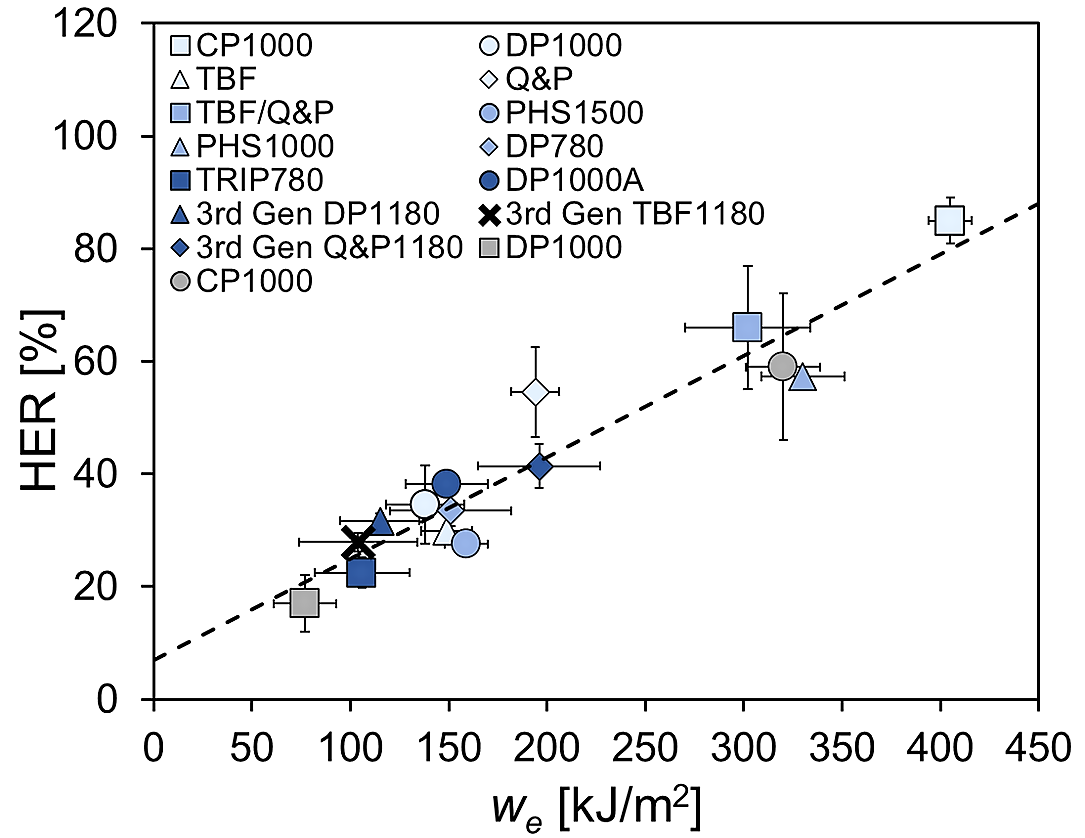
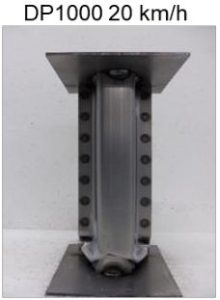
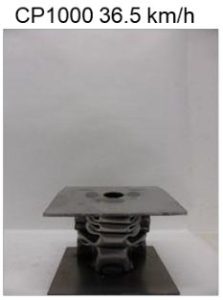
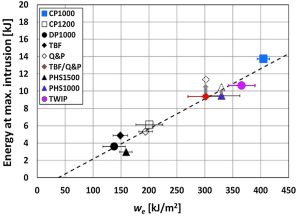
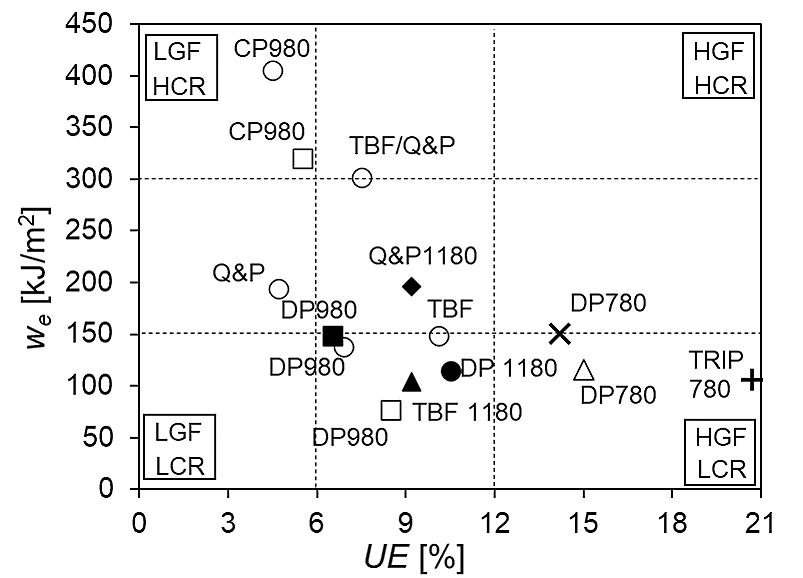
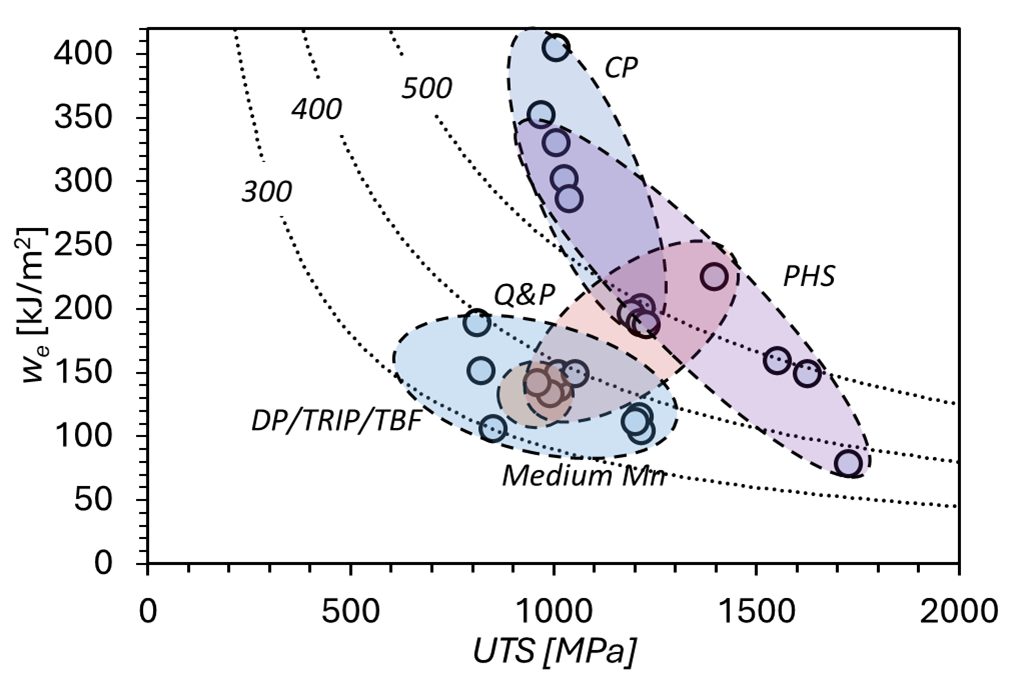

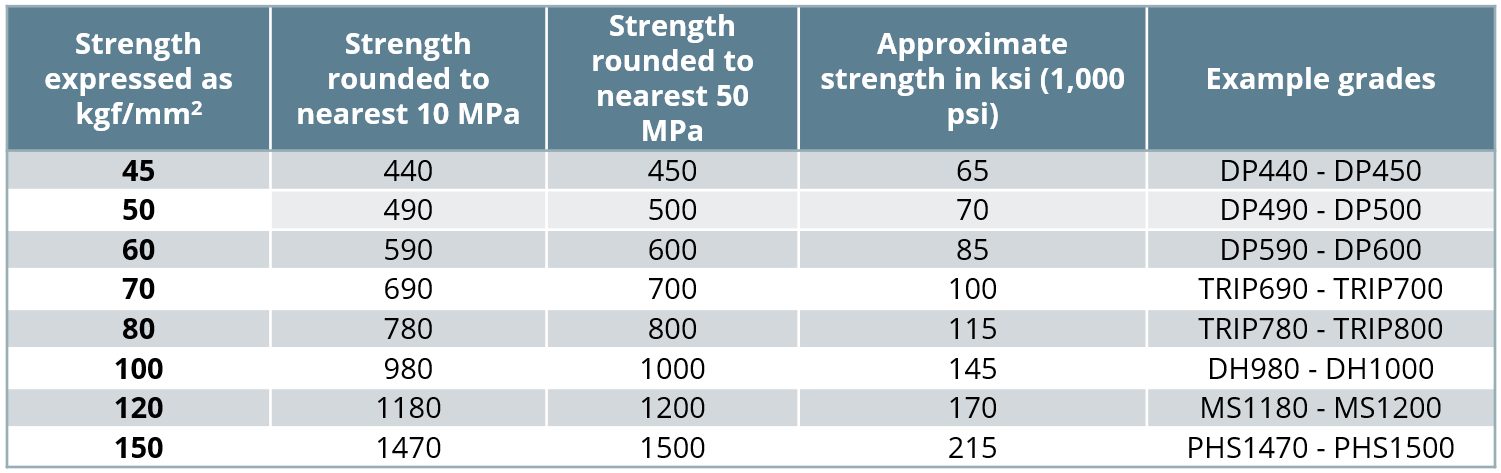


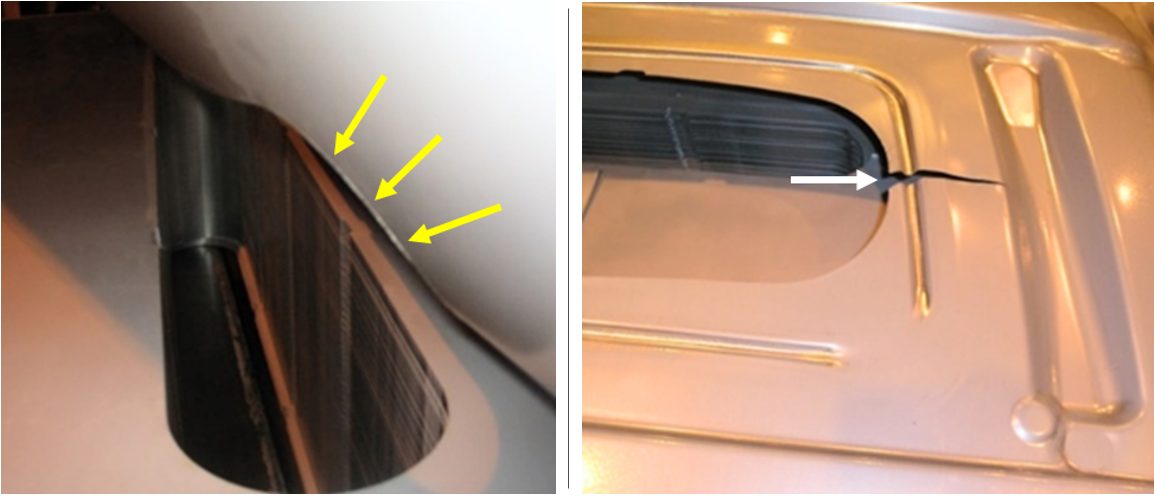


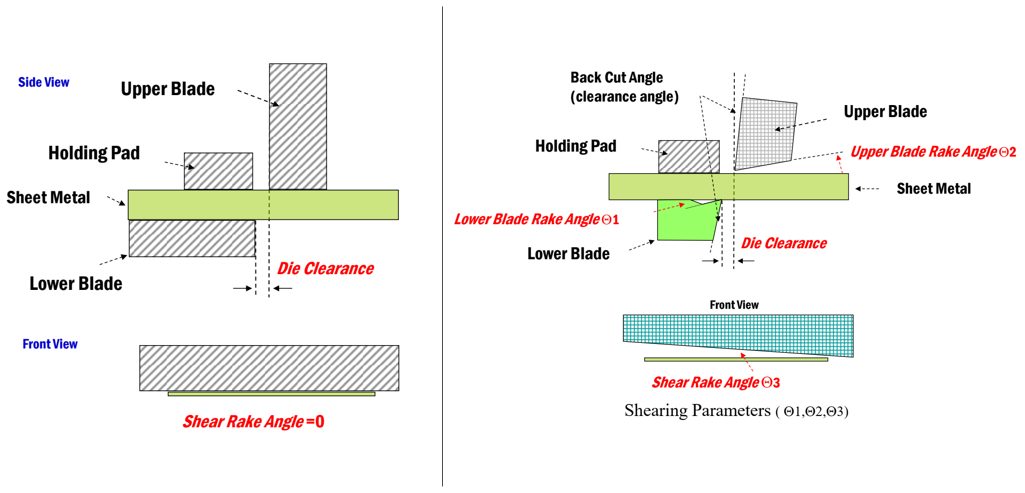


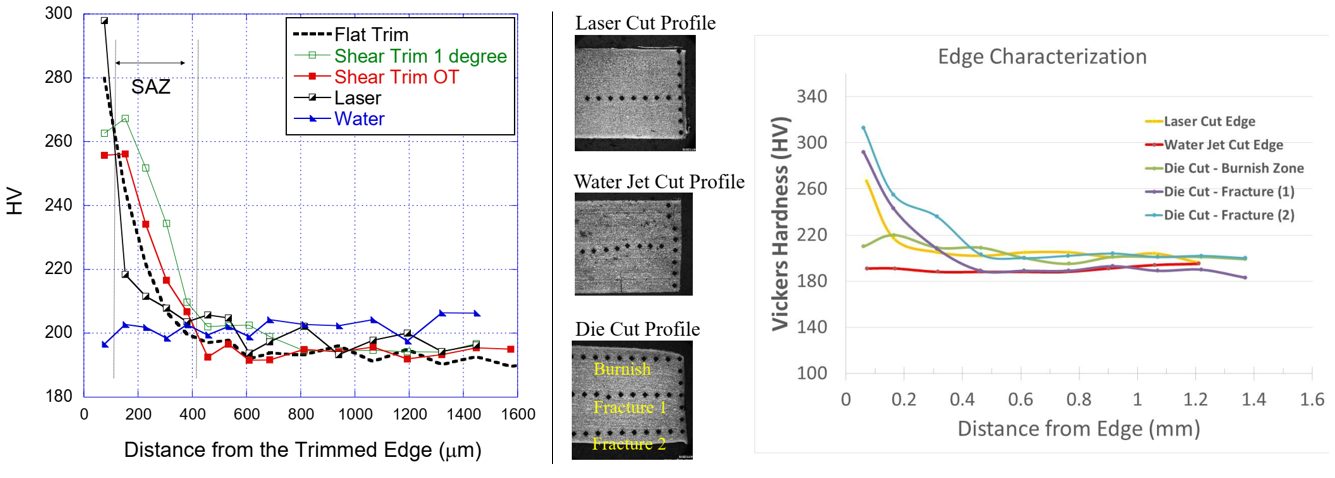


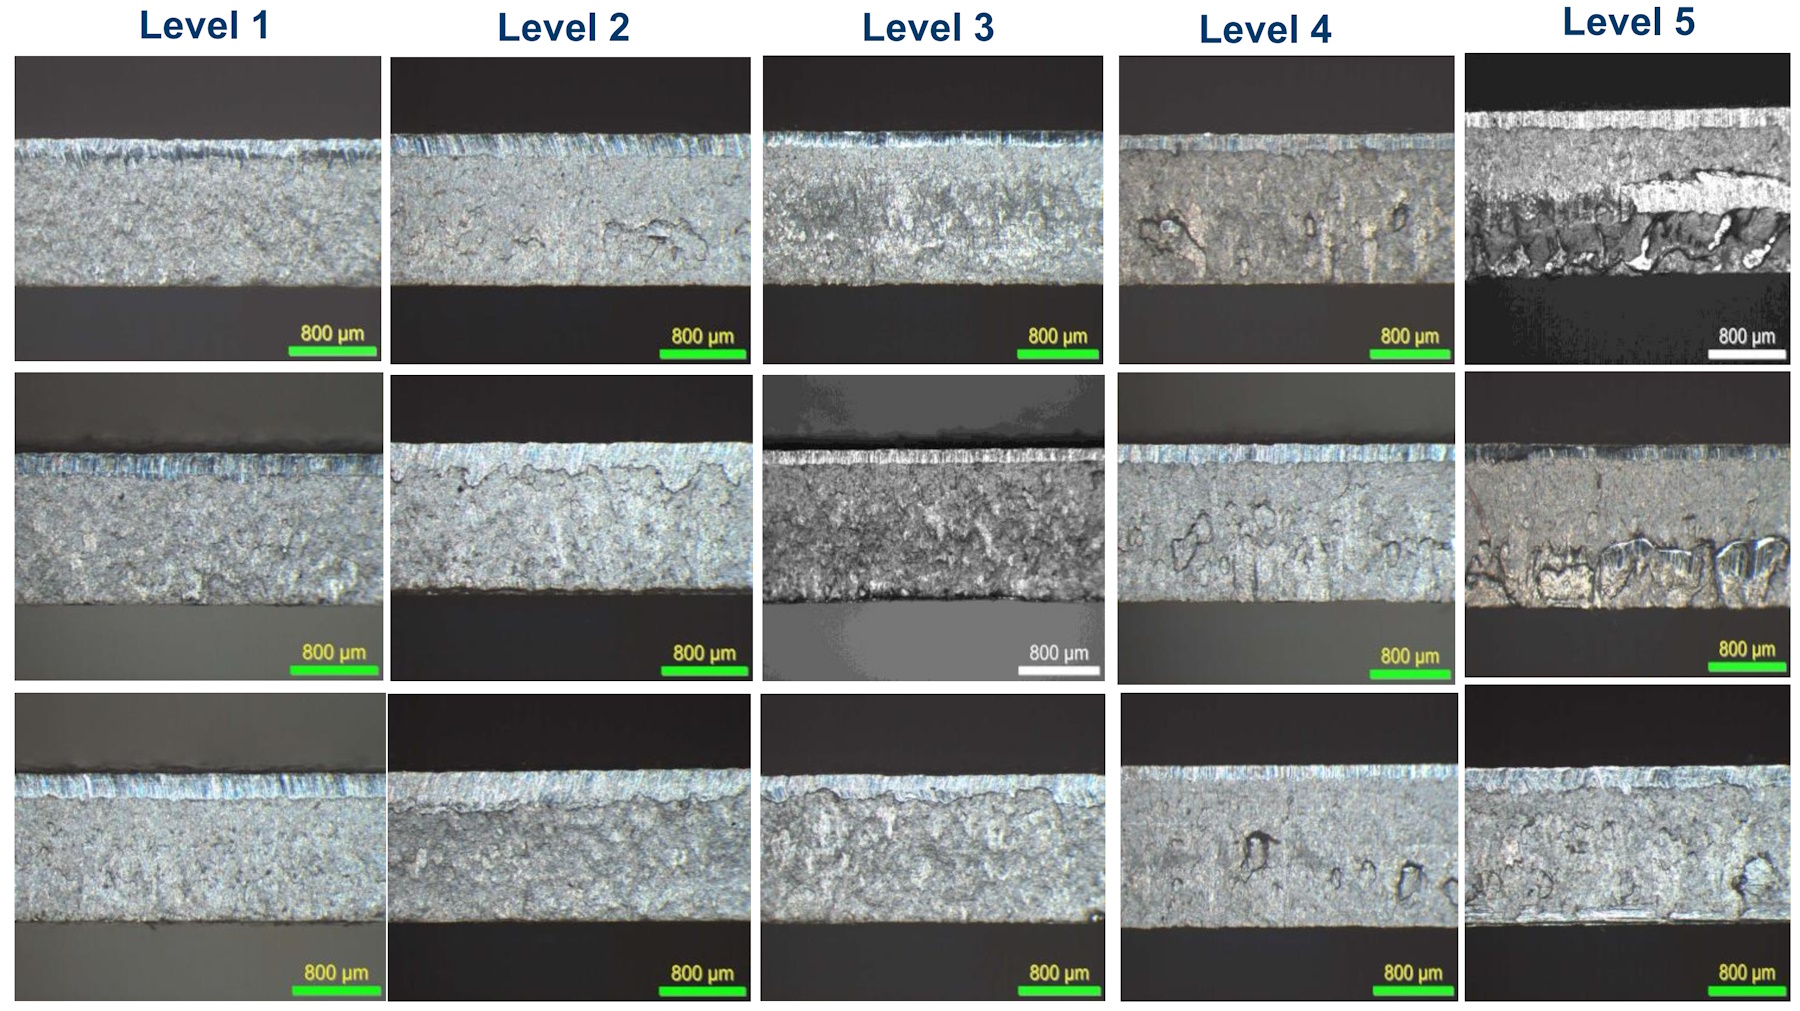
 Thanks are given to
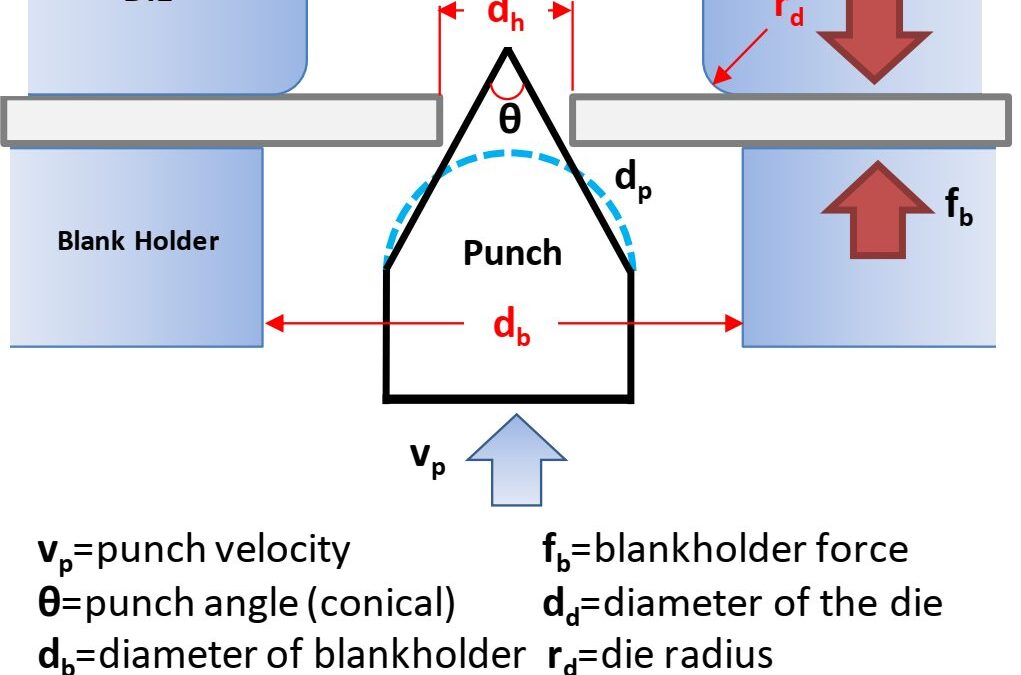
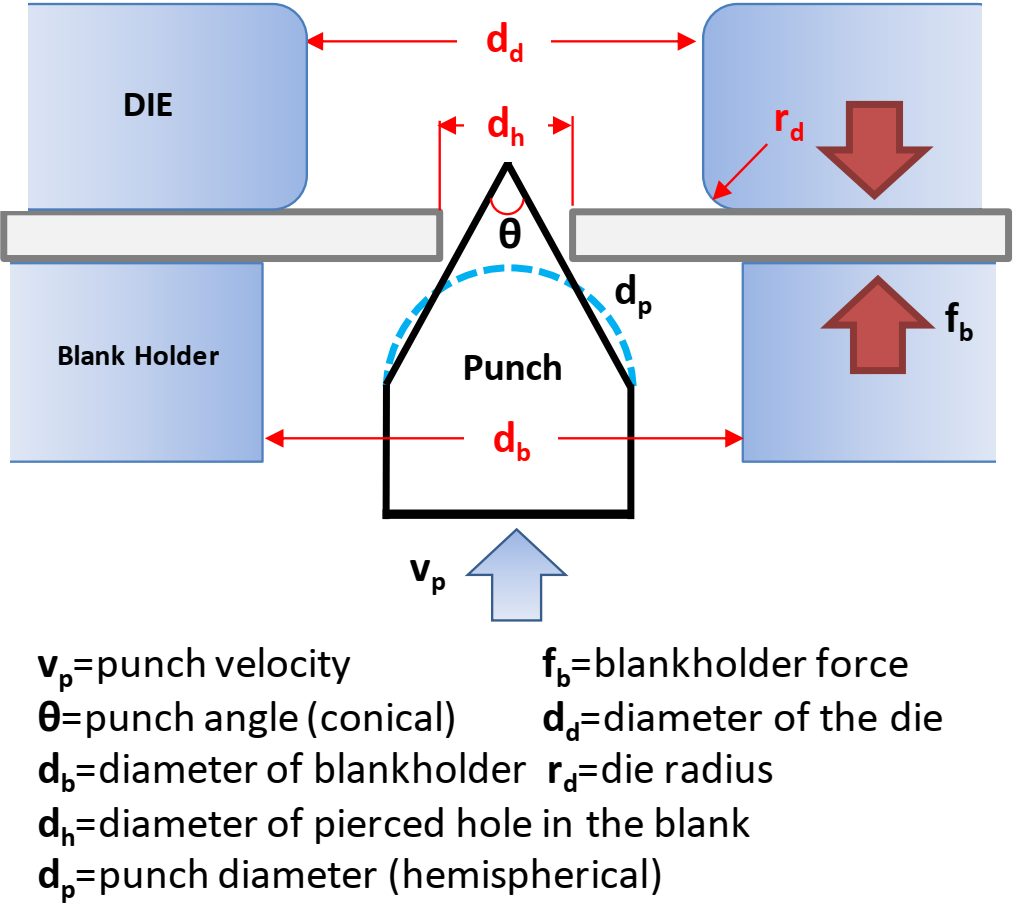
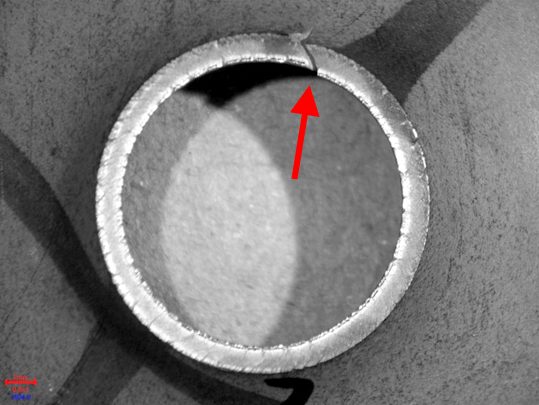
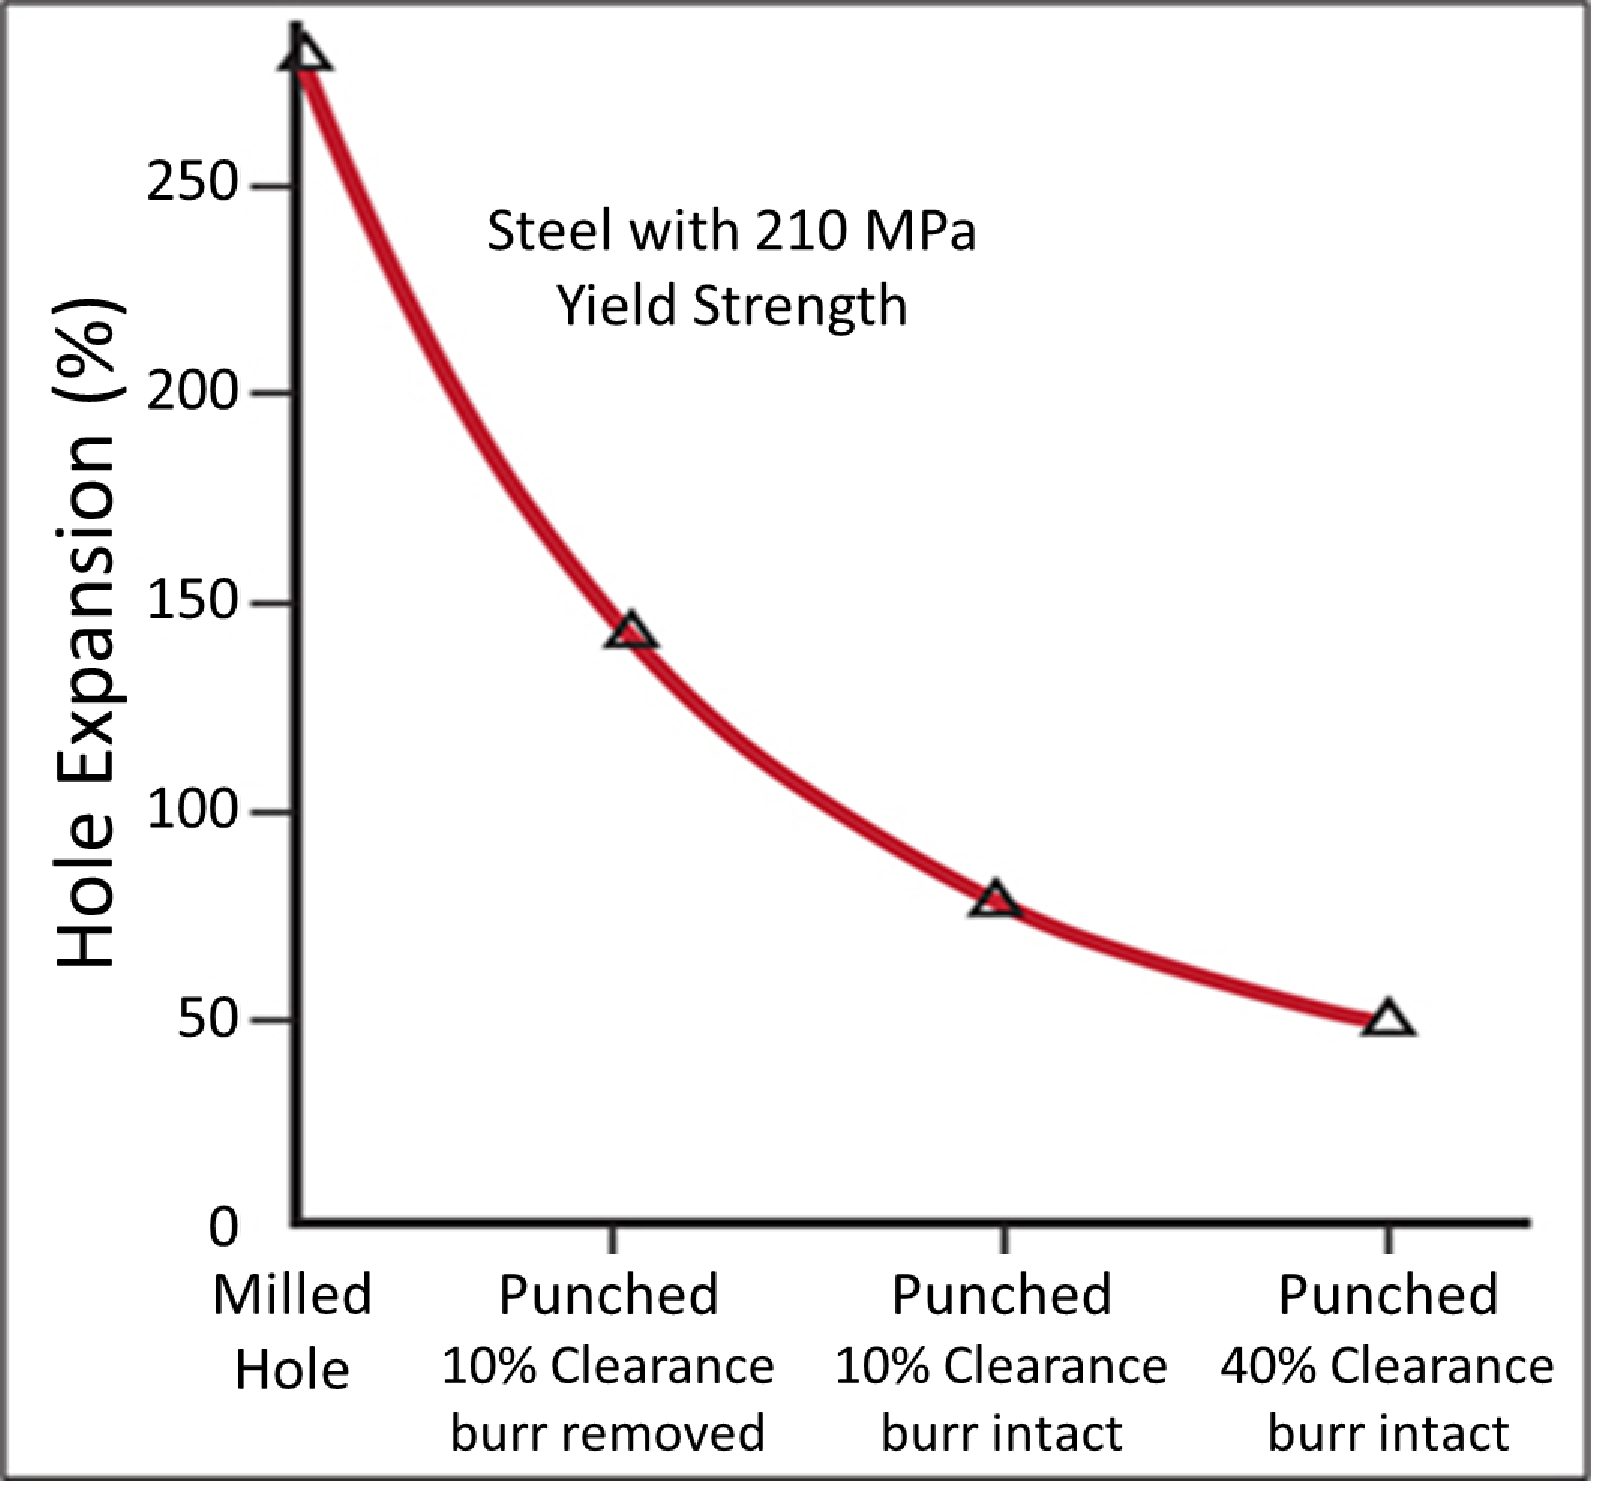
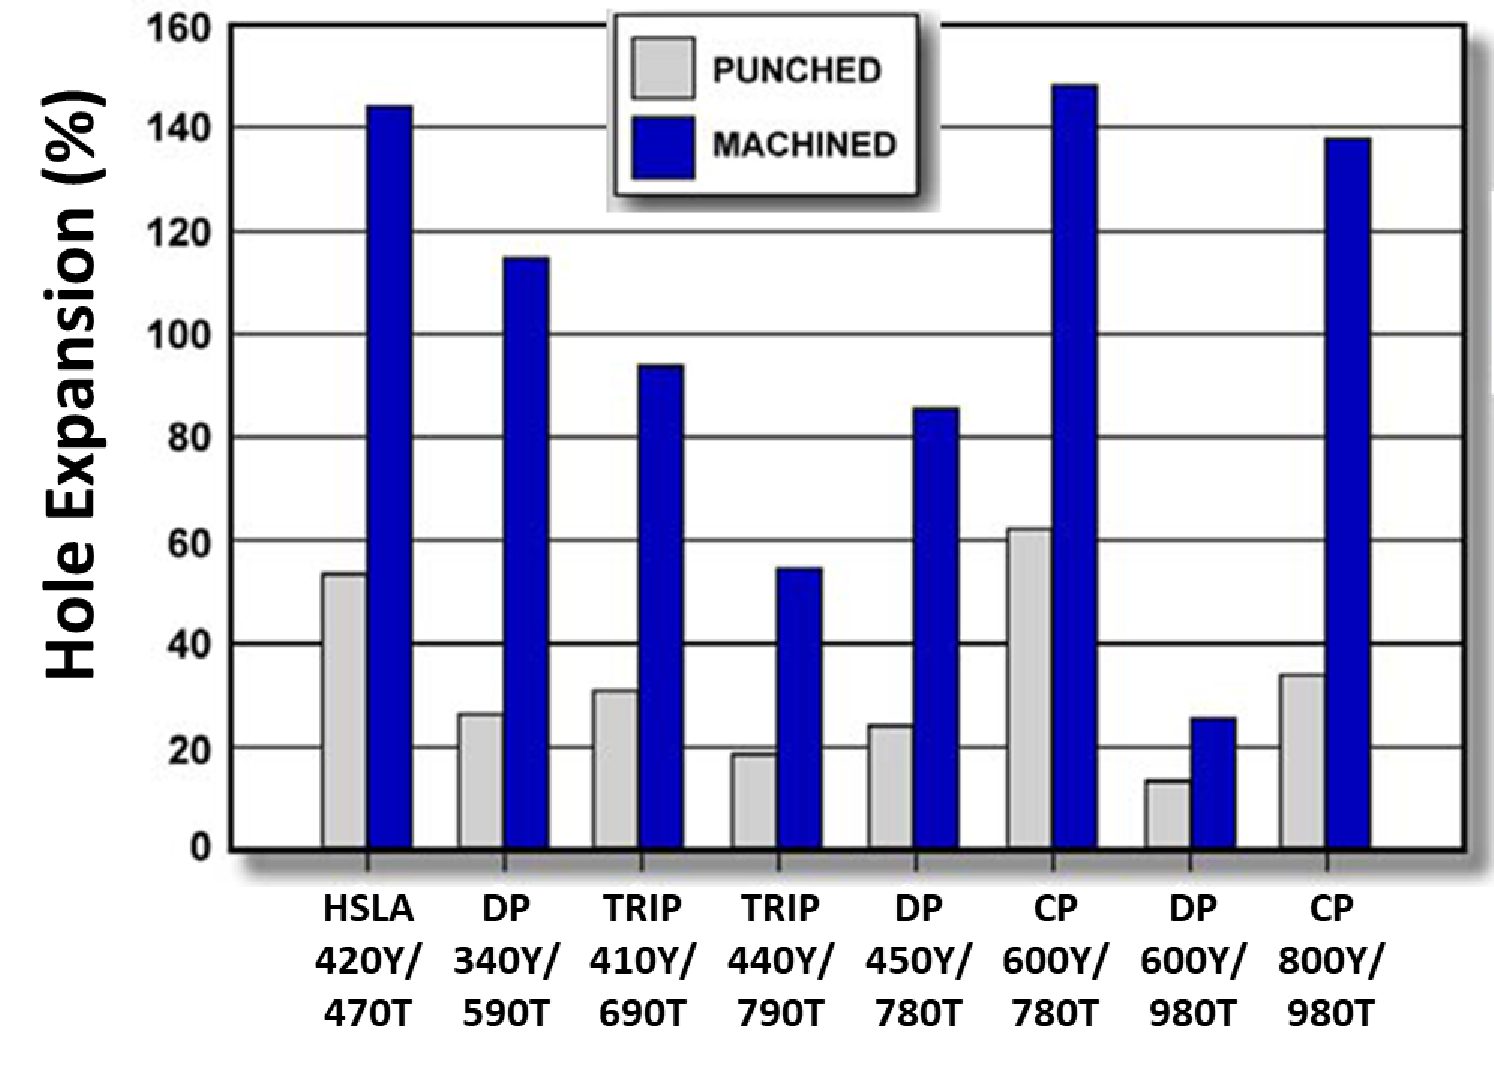
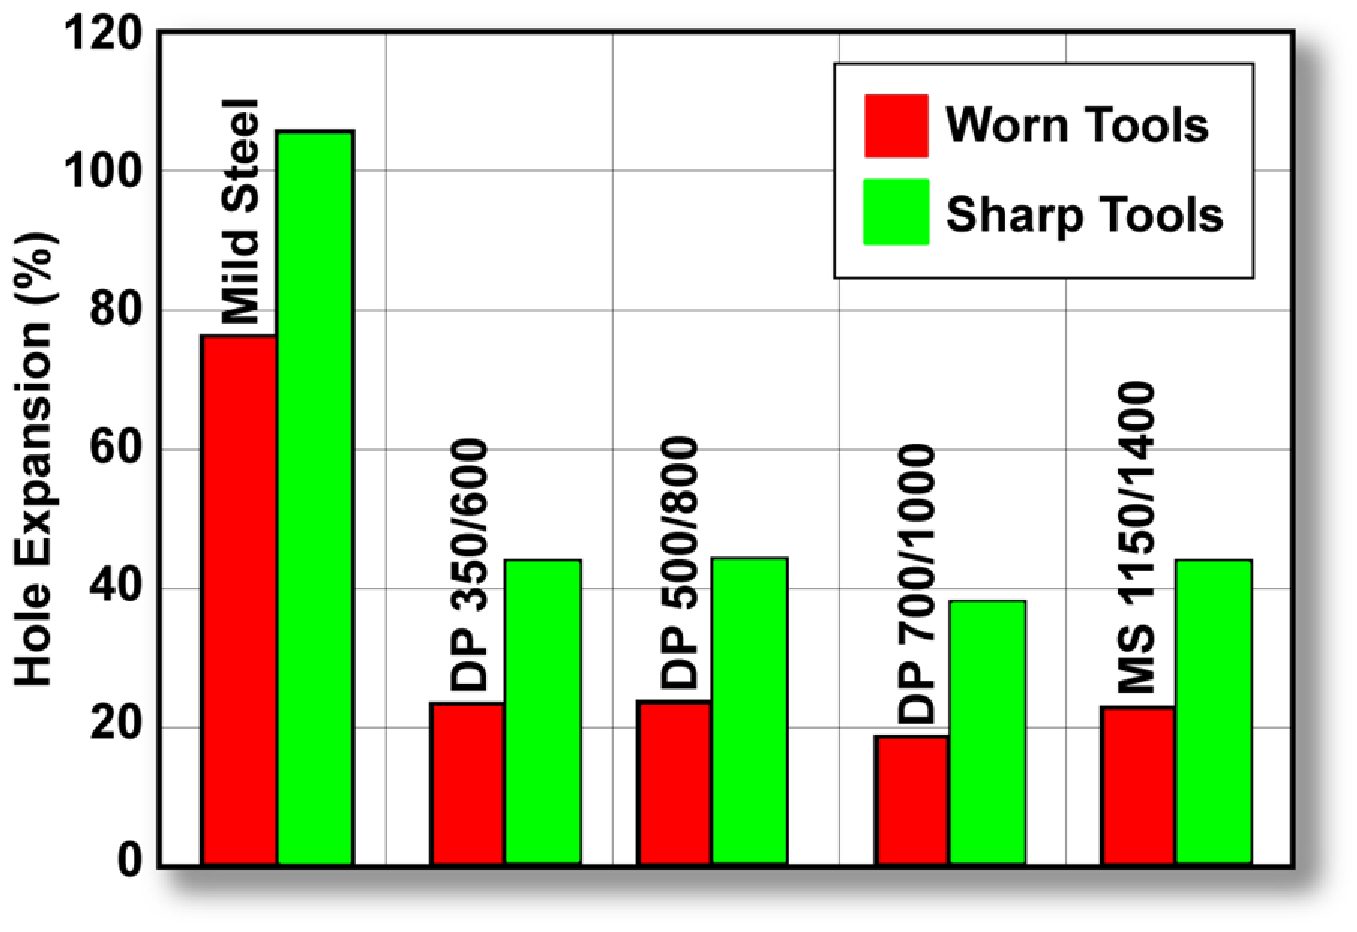
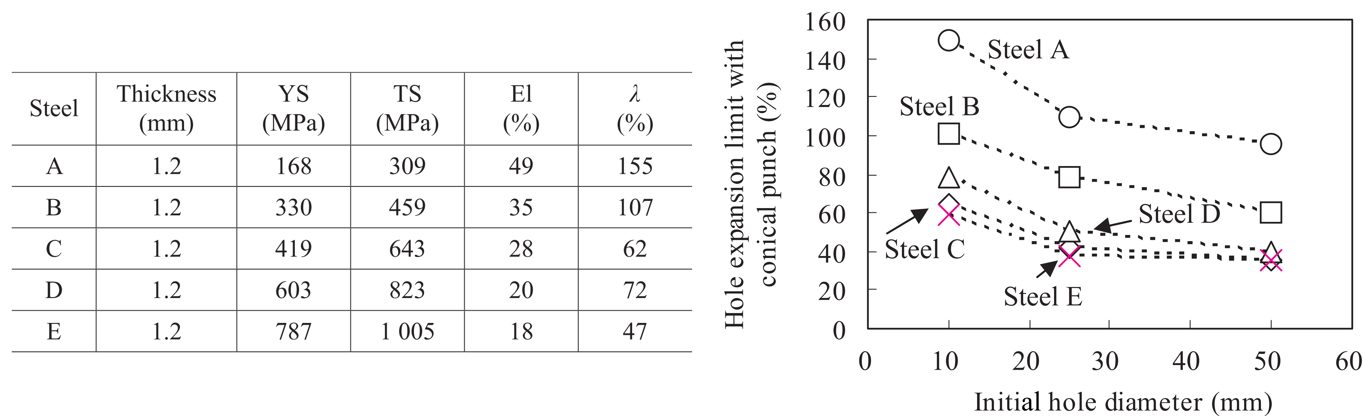
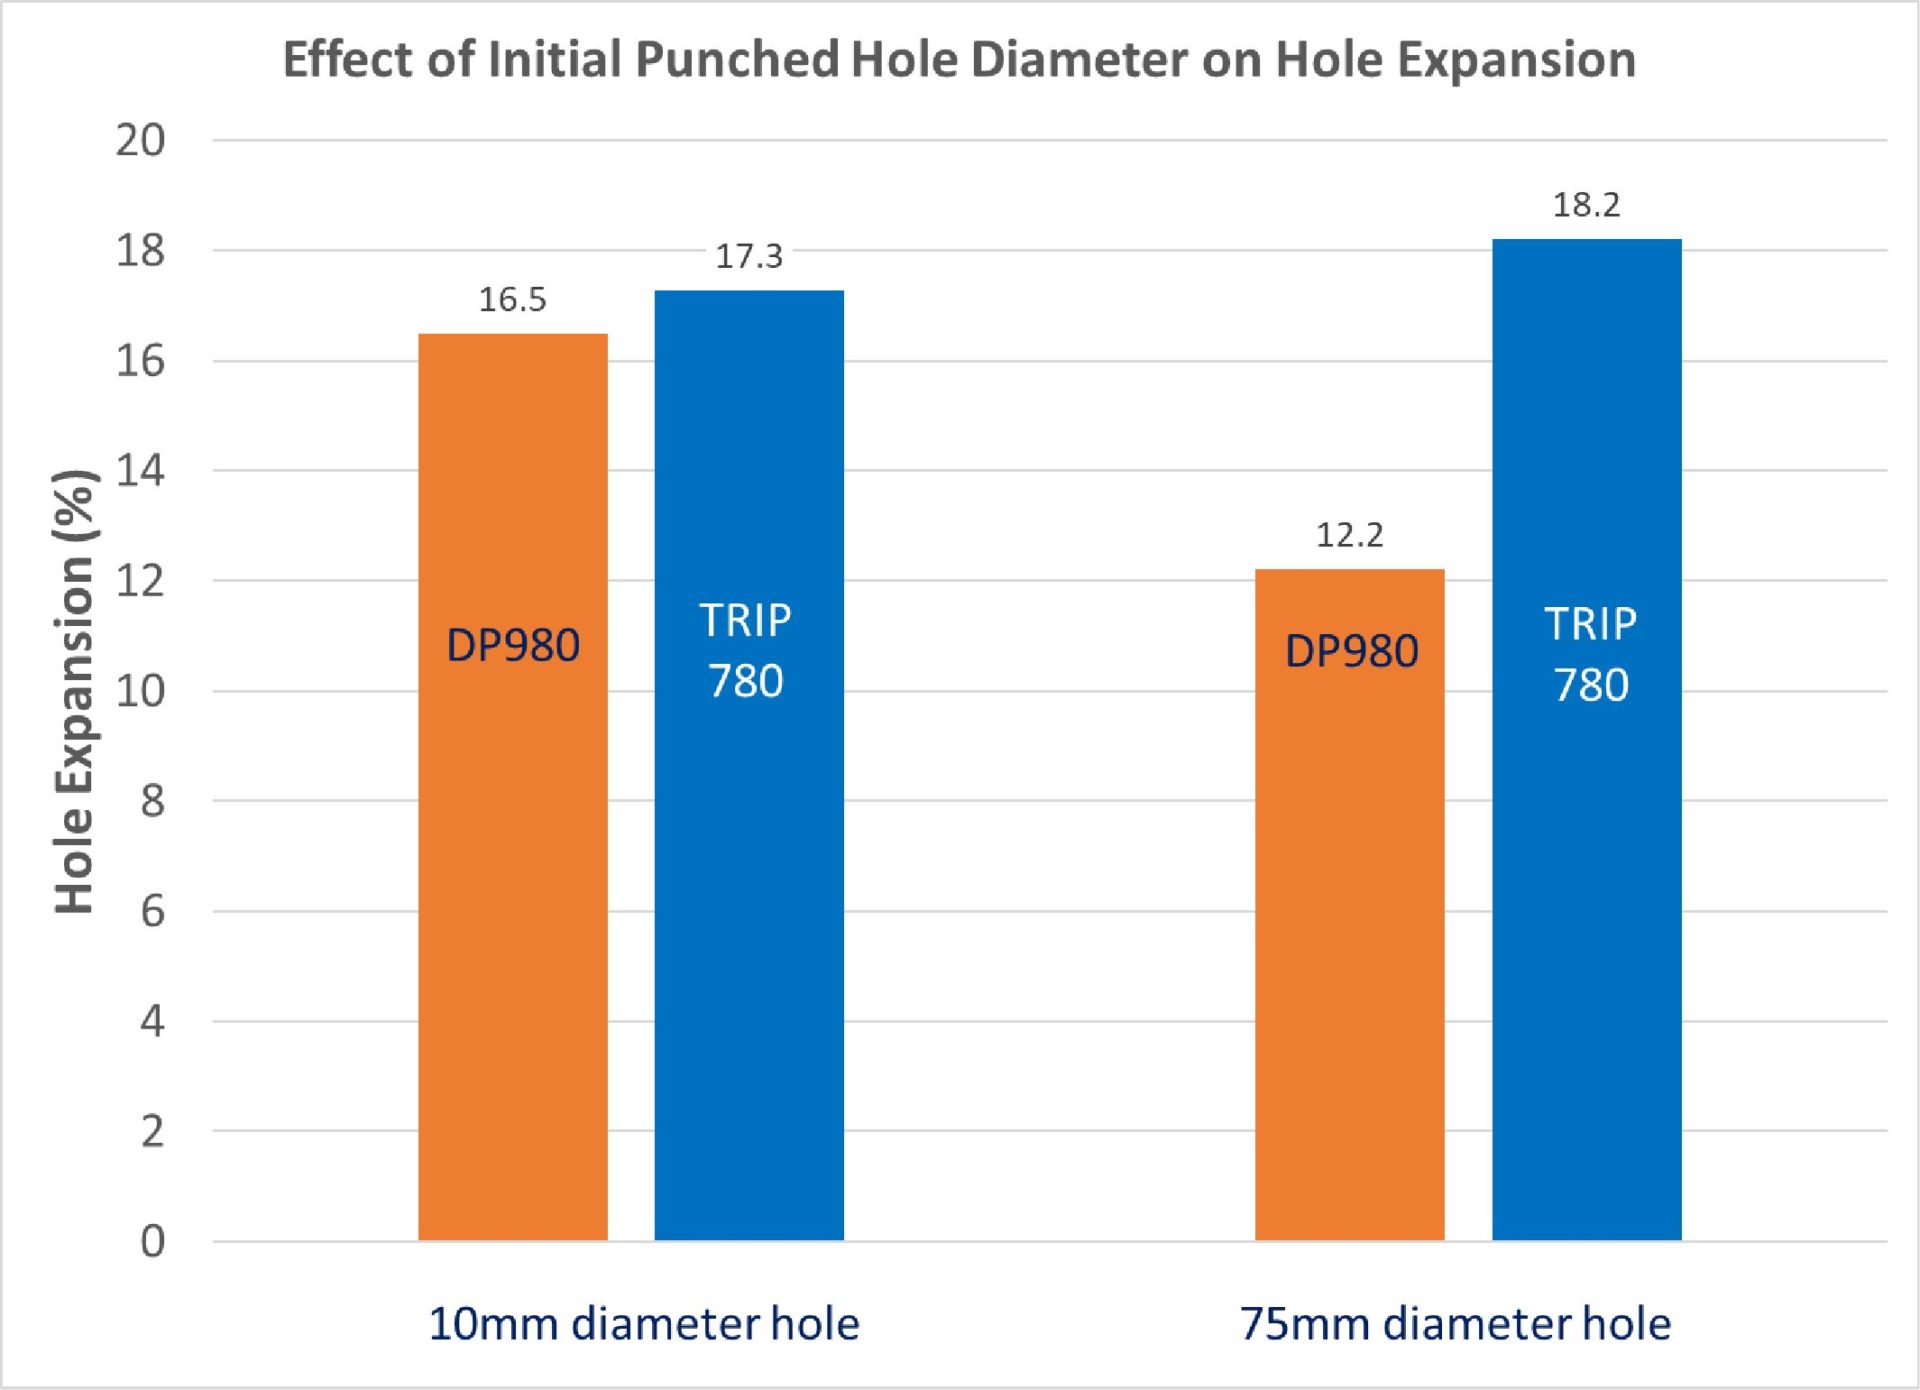
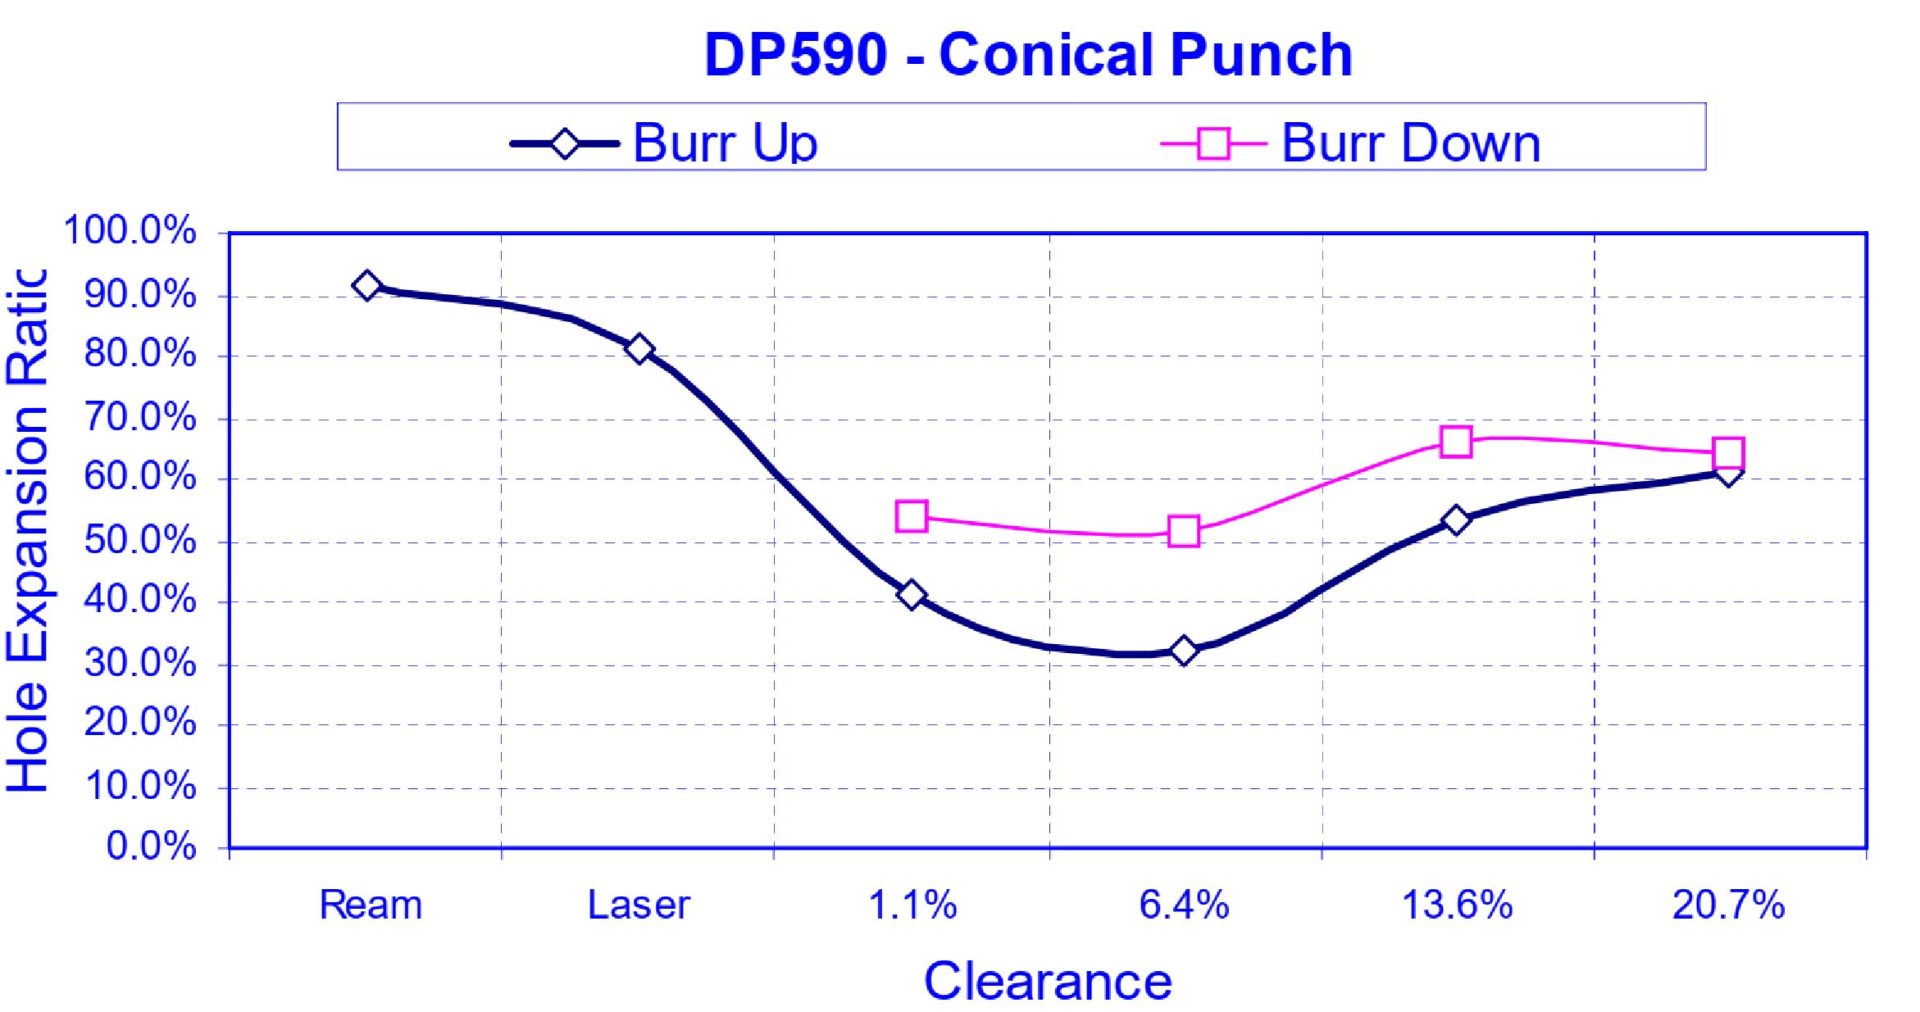
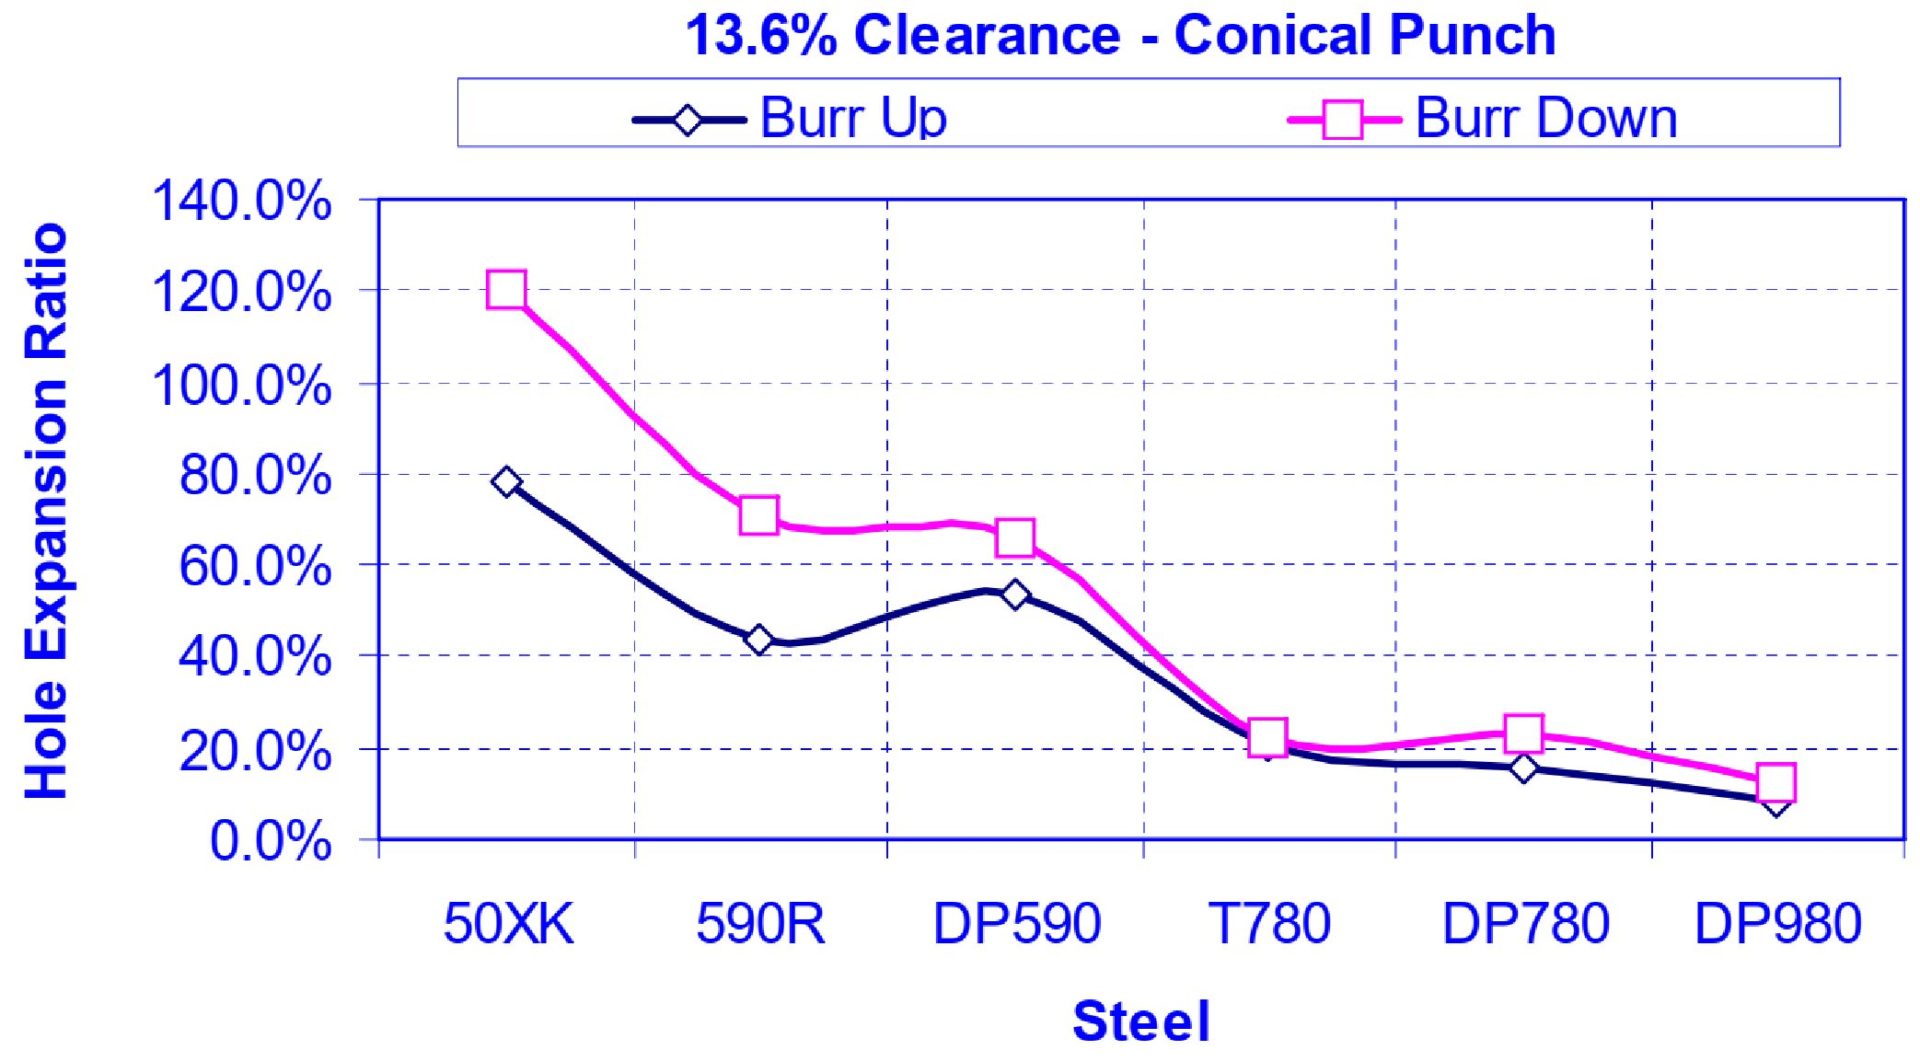
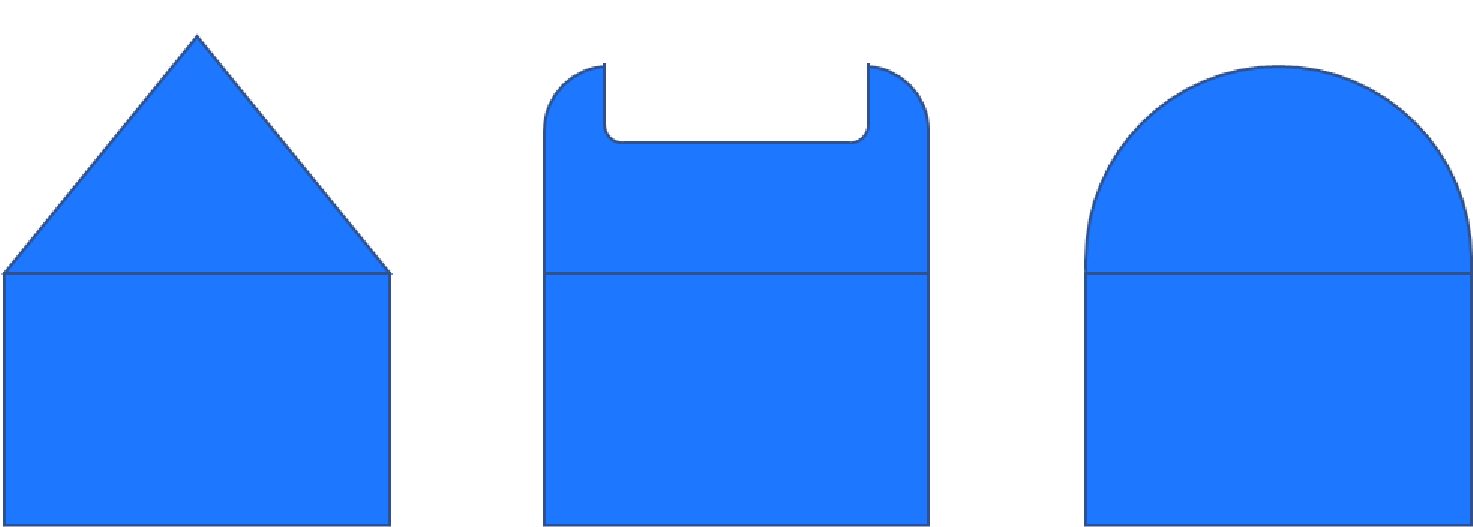

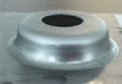
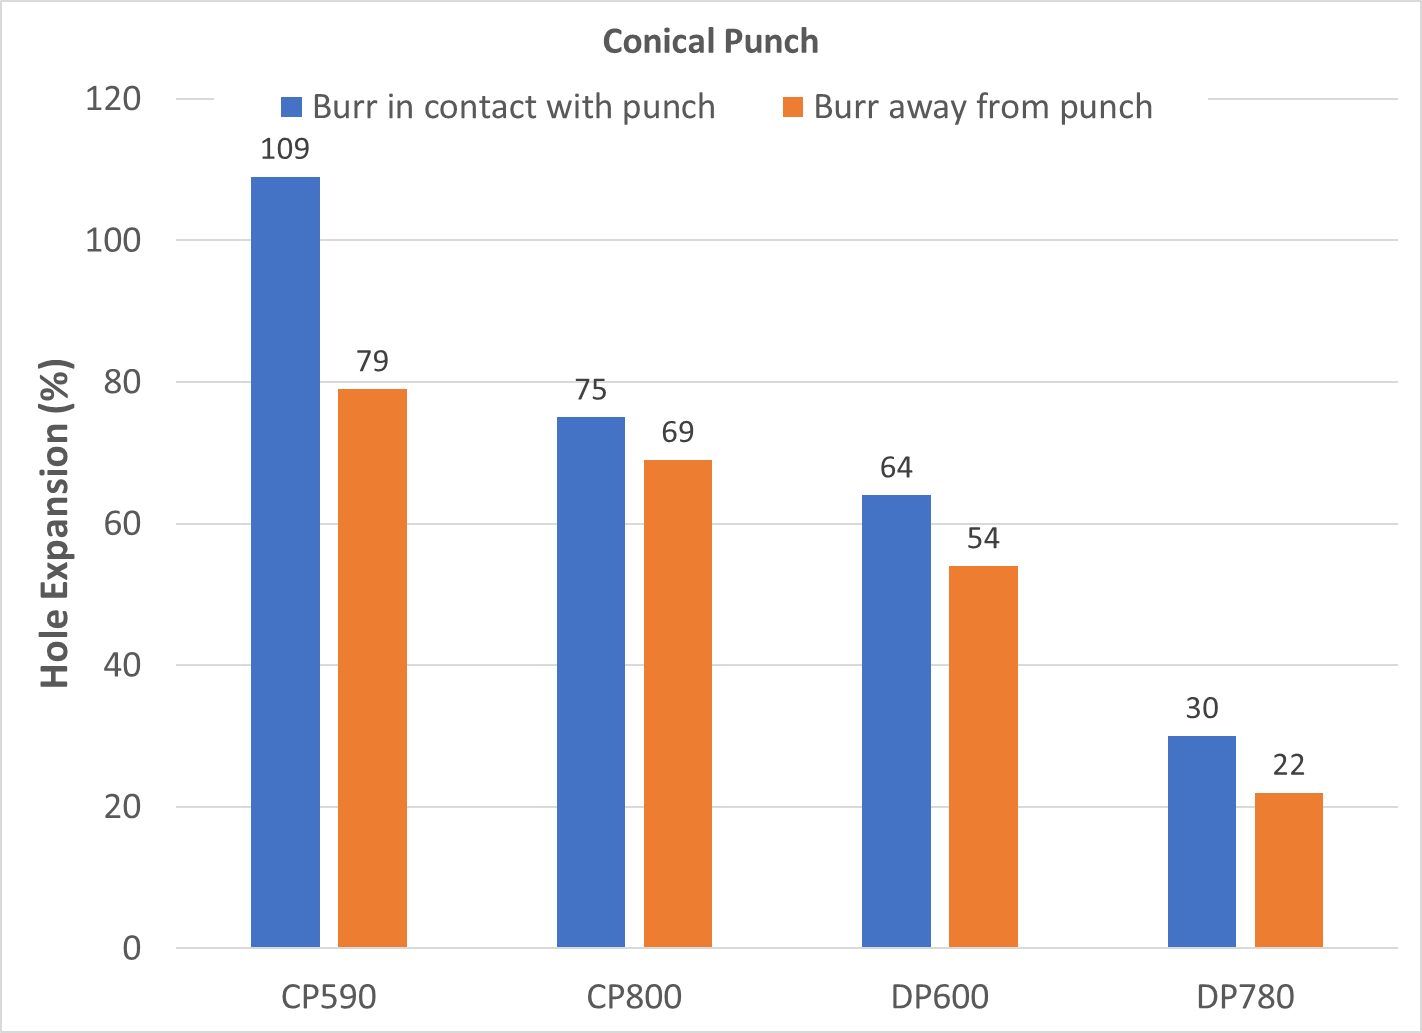
![Figure 13: Effect of Burr Orientation on Hole Expansion from a Flat Punch [Based on Data from Reference 11]](https://ahssinsights.org/wp-content/uploads/2020/07/Pasted-into-Hole-Expansion-Testing-Intro-31.jpg)
![Figure 14: Effect of Punch Type on Hole Expansion of Sheared Holes with Burr In Contact With The Punch [Based on Data from Reference 11]](https://ahssinsights.org/wp-content/uploads/2020/07/Pasted-into-Hole-Expansion-Testing-Intro-32.jpg)
![Figure 15: Effect of Punch Type on Hole Expansion of Sheared Holes with Burr Facing Away From The Punch [Based on Data from Reference 11]](https://ahssinsights.org/wp-content/uploads/2020/07/Pasted-into-Hole-Expansion-Testing-Intro-33.jpg)
![Figure 16: Effect of Punch Type on Hole Expansion of Reamed Holes [Based on Data from Reference 11]](https://ahssinsights.org/wp-content/uploads/2020/07/Pasted-into-Hole-Expansion-Testing-Intro-34.jpg)