Some automotive components may require higher stiffness, strength, or energy absorbing capacity in a confined local area. One method to achieve these characteristics is to spot weld separate reinforcement panels to the main component. A strategy for improving energy absorption in high-strength components involves joining a second part made from a more ductile but (typically) lower strength material. Neither of these approaches are ideal in terms of manufacturing efficiency and product/process optimization.
Tailored parts are the term given to those parts that may have zones with different thickness, chemistry, and/or heat treatment, resulting in a reduced number of components, weight reduction, and/or lower costs. These goals are achieved through part consolidation and by reducing or in some cases even eliminating joining operations.
In cold stamping operations, tailored parts (tailored products) are typically produced at the incoming coil or blank level, but are typically called “tailored blanks” or the specific process/product produced:
Laser Welded Tailored Blanks (LWTB, also known as Tailor Welded Blanks, or TWB) or Tailor Welded Coils (TWC – not common in press hardening),
Tailor Rolled Blanks (TRB) or Tailor Rolled Coils (TRC),
Tailor Welded Tubes (TWT) or Tailor Rolled Tubes (TRT), or
Patchwork Blanks,
In press hardened components, a single component may be press hardened such that it has what are known as soft zones, or areas of lower hardness possessing increased ductility. The tailored processing of these multi-strength parts can be achieved byB-14:
Controlling the incoming blank temperature, (Tailored Heating, pre-process)
Controlling the quenching rate, (Tailored Quenching, during process)
Partially tempering (Tailored Tempering, post-process). Note that Tailored Tempering is a term used for Tailored Parts, especially in texts translated from the German language.
These are typically called tailored parts or tailor processed parts. Lastly it is also possible to combine two techniques, that is, making a tailored part using a tailored blank.
Laser Welded Tailored Blanks (LWTB) are blanks that are produced by laser butt welding of two or more sub-blanks, as shown in Figure 1. In the industry, the terms Tailor Welded Blanks (TWB) and Laser Welded Blanks (LWB) are also used interchangably.M-46
Figure 1: Steps of making a press hardened laser welded tailored blank (re-created after Citations B-14 and A-8).
Laser welded tailored blanks consist of at least two sub-blanks with:
Different thicknesses, allowing for use of thinner sheet steels in areas of the component having less rigorous loading requirements. Using thinner sheets saves weight.
Different grades, optimizing the energy absorption and intrusion resistance characteristics in each area of the same part (such as an automotive B-pillar, see Figure 6b).
A combination of both.
Laser welded tailored blanks with the same thickness and grade are used to create blanks having dimensions larger than mill rolling or processing capabilities. Another reason for such a tailored blank could be optimizing the material yield ratio by nesting (Figure 10c).
Laser welded tailored blanks offer many paths to weight savings and cost reduction, including:
Reducing the number of parts in the subassembly, such as the need for reinforcements;
Reducing the number of required forming tools, welding fixtures, etc.; and
Improved raw material utilization by sub-blank nesting optimization (see Figure 1 and Figure 10c).
The weld area of press hardened laser welded tailored blanks may not transform to martensite, and therefore may show a significant reduction in the hardness. This can be attributed to weld quality and quenching rate.B-47, W-3
Blanked edge geometry of the sub-blanks (notches, underfillings and weld seam pollution) affects weld quality. Separating the blanking into two operations, rough blanking and precision blanking, may improve blanked edge geometry and the resulting weld quality.M-46
As seen in Figure 1, Aluminium-Silicon (AS) coated sub-blanks may require a secondary ablation operation. The AS coating is removed (ablated) near the weld edge, typically by using a laser. When this AS coating is not removed and filler wire is not used, the aluminium from the coating may pollute the weld. When welding two AS coated PHS1500 sub-blanks together, an aluminium-polluted weld may have significantly lower hardness, as shown in Figure 2. A part made of such a blank will fail at the weld zone, both in quasi-static and dynamic conditions.E-8
Figure 2: Effect of ablation and filler wire on hardness distribution around the laser weld of equal thickness PHS1500+AS150 (re-created after Citation E-8).
Prior to 2023, the European Standard for Laser Welded Tailored Blanks (LWTB), EN 10359D-2, covered only LWTBs for cold stamping materials. This standard was expanded to include press hardened laser welded blanks in 2023. The new standard clearly defines that the average hardness in the weld zone shall not drop below the soft base material’s average hardness minus 30 HV, Figure 2. Al-polluted weld cannot be accepted. The standard also defines a maximum hardness in the weld zone. This cannot be more than 15% of the hardness of the stronger base material if the UTS of the stronger base material is over 1200 MPa. If the LTWB has a maximum UTS lower than 1200 MPa, the weld seam is allowed to have a maximum average hardness of 500 HV. In the weld zone, a minimum of 9 hardness measurements are required to get the average.E-16
Another common type of laser welded tailored blank is where a press hardening steel (typically PHS1500) is welded to a press quenched steel (PQS 450 or 550). Lower strength and higher ductility should be observed in the PQS region. Without ablation, a hardness drop is observed in AS coated welded blank, seen in Figure 3a. In quasi-static tests, fracture was observed in the PQS base metal. In dynamic tests, the part failed at the weld zone. When ablation is applied, a B-pillar with a PQS base absorbs more energy compared to the welded blank without ablation.E-8 In uncoated and Zn-coated steels, ablation is not required since there is no concern about aluminium pollution in the weld.A-68, M-2Figure 3b shows the hardness distribution in the weld seam of galvanized sub-blanks.
Figure 3: Hardness distribution in PHS-PQS laser welded blanks. a) AS coated sub-blanks with and without ablation (re-created after Citation E-8); b) Galvanized sub-blanks without ablation (re-created after Citation M-2). Note that the initial thicknesses of sub-blanks are different.
There are two methods of ablation. Full ablation removes the AS coating and the interdiffusion layer (IDL) in their entirety. In contrast, partial ablation removes only the AS coating, but the IDL remains intact. Full ablation may result in oxidation and decarburization in the weld seam.E-8, W-3
In addition to weld pollution, the hardness drop in the weld seam could also be caused by the local quenching rate. When a welded blank is made using sub-blanks with different thicknesses, misalignment (Δx in Figure 4a) may lower the quenching rate. Misalignment greater than 2 mm could cause over 30% hardness drop, from approximately 500 HV to less than 350 HV.B-47 A filler wire with high-C content could reduce the critical cooling rate, as shown in the Figure 4b. In a particular example using a filler wire containing 0.3% C presented in this image, the critical cooling rate was reduced to approximately 13 °C/s. Due to the high-C content, a 20% increase in the weld seam hardness may be possible,E-8 as indicated in Figure 2.
Figure 4: a) Misalignment of the blank in the die could cause lower quenching rate in the weld seam (re-created after Citation B-47); b) A high-carbon filler wire may reduce the critical cooling rate (re-created after Citation E-8).
The fourth generation Audi A4 (2008-2016 also known as B8) contained some of the earliest applications of press hardened laser welded tailored blanks. The car had five components made of laser welded tailored blanks: tunnel reinforcement, left/right B-pillar reinforcements, and left/right rear rails, as shown in Figure 5. As PQS grades were not commercially available at that time, High-Strength Low-Alloy (HSLA) steels were used for energy absorbing applications. As delivered, HX340LAD + AS, had a minimum 340 MPa yield strength. Press hardened parts and their final mechanical properties are shown in Figure 5.S-65
Figure 5: PHS applications in Audi A4 (2008-2016). The car had a total of three different components and five parts using laser welded tailored blanks (figure and table re-created using data and images from Citations S-65, D-11, V-21, W-5, and S-13).
In Citation K-25, using a laser welded tailored blank resulted in the highest energy absorbing capacity of a B-pillar reinforcement. In this study, PHS1500 (22MnB5) was laser welded to a HC340LA (uncoated HSLA steel with minimum 340 MPa incoming yield strength). Such a welded blank could absorb 3.3 kJ energy without fracture, whereas a monolithic (same thickness, same hardness all around) PHS1500 failed at 2.3 kJ (see Figure 6). PHS1500 with soft zones (see the Tailored Properties section below) passed a 2.3 kJ test but failed at 3.3 kJ.
Figure 6: Energy absorbing capacity of B-pillars increase significantly with soft zones or laser-welded ductile material (re-created after Citation K-25).
Conventional High-Strength Steels are not designed for hot stamping process. HSLA 340 and 410 MPa grades (minimum yield strength, as delivered) and CMn440 steel (Carbon-manganese alloyed, minimum 440 MPa tensile strength at delivery) may be softer than their as-delivered condition when heated over austenitization temperature and slowly cooled at 15 °C/s cooling rate. Furthermore, if the local cooling rate is over 60 to 80 °C/s, a significant increase in hardness (see Figure 7) and sharp decrease in elongation may be observed.D-22, T-27
Figure 7: Vickers hardness variation of several cold stamping steels after austenitization and at different cooling rates (re-created using data from Citation D-22).
Development of PQS grades started around 2007, targeting consistent mechanical properties over a wide range of cooling rates. Currently, typical laser welded blank applications of PQS450 and PQS550 in the automotive industry include B-pillars, front rails, and rear rails. One such car with LWTB components is the 2nd generation Volvo XC90 (2014-Present). The car has a total of 152 kg hot stamped parts, with approximately 132 kg of PHS1500 and 20 kg PQS450, comprising 33% and 5% of the BIW (excluding doors and closures), respectively. The XC90 has a total of six hot stamped welded blanks (three left and three right), as seen in Figure 8.L-29, L-8 More details about welded blanks with PQS450 and PQS550 are presented in the Grades with Higher Ductility Section within our article on PQS Grades.
Figure 8: Use of laser welded PQS-PHS grades in the 2nd generation Volvo XC90 (re-created after Citation L-29).
Recently PHS1000 and PHS1200 grades have been developed. The yield and tensile strength of these grades increase with hot stamping, and as such are considered press hardening steels (PHS, but not PQS). Y-12, G-30 More details about these grades are presented in the Grades with Higher Ductility Section within our article on PHS and PQS Grades. Renault conducted an experimental study in 2021 to replace PHS1500-PQS550 laser welded tailored blanks with those made from a PHS2000-PHS1000 combination. As seen in Figure 9, the new materials can absorb the same amount of energy with less intrusion. At the same level of intrusion, the energy absorbing capacity improves by 30%.B-62
Figure 9: Stroke vs. energy curves of representative sub-assemblies, emulating B-pillar (re-created after Citation B-62).
Laser welded tailored blanks may also be used to create larger blanks that may not be otherwise possible or economically feasible.M-4 Door rings represent one such application for hot stamping, as introduced by ArcelorMittal in 2010.A-17 A prototype door ring was produced in 2012, using four sub-blanks, including one PQS550, as shown Figure 10a. The part measured approximately 1500 mm long and 1250 mm high.B-63, T-1 May 2013 saw the first application of a hot stamped door ring with the introduction of the 3rd generation Acura MDX, running from 2013-2020. The vehicle used a two sub-blank LWB door ring, both PHS1500, with thicknesses of 1.2 mm and 1.6 mm. Through sub-blank nesting optimization, material utilization was improved to 63%. Details can be seen in Figures 10b and 10c.M-46
Figure 10: Door rings. a) one of the earliest concepts from 2010T-1; b) the first mass produced door ring of the 2013 Acura MDX; c) sub-blank nesting to improve the material utilization.M-46
For door ring manufacturing, a higher tonnage press with larger bolster area may be required, as well as a wider furnace and heavier capacity transfer systems. In most hot stamping lines, typically two or four parts are formed and quenched in one stroke (known as 2-out or 4-out) to improve productivity and reduce the total cost per piece. Due to the large size and additional requirements, door ring manufacturing is typically 1-out. However, as the part itself replaces four components (A and B pillars, hinge pillar and rocker reinforcement), it can be as cost effective as a 4-out hot stamping operation.W-6
Although not common, the Acura TLX (1st generation 2015-2021) and Hyundai Santa Fe (since 2018, 4th generation) utilize single piece (not from a welded blank) door rings with 1.4 mm and 1.1 mm thicknesses respectively. B-14, H-4 The 2nd generation Acura TLX (2021-present) has the door-ring of the 1st generation model as a carryover.L-61
Since its inception, laser welded door rings have been used in several Honda / Acura models. The number of sub-blanks was increased to 4 with the 2nd generation Honda Ridgeline (2017-present). This was the first door ring application in a pick-up truck.B-52 The Chrysler Pacifica started production in 2017 with 5 sub-blanks, as shown in Figure 11a, including PQS550 for crash energy absorption.T-19 The 5th generation RAM 1500 pick-up truck, which debuted in 2018, has a six sub-blank door ring, as seen in Figure 11b.R-3 In 2018, Acura RDX became the first car to have inner and outer door rings made of PHS1500 laser welded blanks. As seen in Figures 11c and 11d, five and four sub-blanks were used respectively for the inner and outer door rings, all PHS1500. This design further allowed downgauging and lightweighting.R-26
Figure 11: Laser welded door ring applications: (a) Chrysler Pacifica (SOP 2017) has five sub-blanks (recreated after Citation T-19); (b) RAM 1500 (SOP 2018) has six sub-blanks (re-created after Citation R-3); Acura RDX was the first car to have two door rings: (c) inner and (d) outer, both with four sub-blanks of PHS1500 (re-created after R-26).
Tesla Model Y uses a door ring with 4 sub-blanks, including PHS 1000 for the energy absorbing area of the B-pillar.B-79, A-84 One of the most complicated door rings is found in the Voyah Dream, a Chinese minivan that started production in 2022. The main door-ring consists of 5 sub-blanks laser welded to each other. The base of the B-pillar is again PHS1000. In addition to these 5 sub-blanks, 2 patches are also spot welded, where one of these is PHS1900.H-70 Figure 13 of our page on PHS Grades shows these door rings.
Double door rings (see Figure 12 and Figure 13) have been long discussed. One of the earliest applications was found in Tesla Cybertruck (SOP 2023). This was the first in-house hot stamping done at Tesla’s own hot stamping lines.B-81 The second application was found in the compact BEV car, GAC Aion UT (see Figure 13a) in 2025. The full-size SUV Lynk & Co 900 may have the largest double door ring in production as of 2025 (Figure 13b). The hot stamped part has all 4 pillars (A, B, C, and D) integrated into a single piece.
Figure 12: Double door ring of Tesla Cybertruck: (a) approximate dimensions of the inner part (image re-created after M-72), (b) schematic of outer ring and (c) inner ring (re-created after F-49).
Figure 13: Double door ring applications: (a) GAC Aion UT (SOP 2025)G-50, (b) Lynk & Co 900 (SOP 2025)P-30.
A study from 2023 showed that, it was possible to save 22.2 kg per vehicle by using inner and outer double door ring – compared to a legacy design. The total part number was reduced from 14 to 2, also reducing significant area from the body shop. Material utilization was improved to 70% (by means of sub-blank nesting optimization). The total steel usage was reduced from 170.7 kg to 129.1 kg (an almost 25% improvement).G-51 Another study from 2024 showed that B-pillar-less designs can be realized with a hot stamped double door ring.B-82
Tailor Rolled Blanks
Tailor Rolled Blanks (TRB), also known as flexibly rolled blanks (FRB) or variable thickness rolled blanks (VTRB) are produced by a secondary cold rolling of an already cold rolled and possibly coated coil. In this secondary cold rolling, the roll gap is adjusted during the process so that the thickness can be varied (tailored) locally, shown in Figure 14a. TRBs can be an alternative to “same material-different thickness” welded blanks.B-14 Contrary to an LWTB, thickness changes are not abrupt, but instead are continuous. Thus, TRBs do not have stress concentration due to the notch effect. Problems associated with weld quality in welded blanks (pollution, geometry, quenching rate, etc.) do not apply to TRBs since laser welding is not utilized to create local thickness changes.H-7
Tailor rolled blanks are typically named by their thicknesses from head-to-tail, and symmetrical sections with same thicknesses are written once. For example, the B-pillars of previous generation Ford Focus (2011-2018), as shown in Figure 14b, has five thicknesses in nine zones. This blank would be named as: 1.35-2.30-2.10-2.40-2.70. The process starts with a coil slightly thicker than 2.70 mm, and thickness reductions up to 50% would be completed during the tailor rolling process. The typical slope in the Thickness Transition Zones (TTZ) are 1:100, meaning 1 mm change in thickness would require a 100 mm long TTZ. Different slopes could also be utilized.Q-7, H-8
Figure 14: a) Principle of tailor rolling process (re-created after Citation Z-5); b) thickness profile and nesting of a B-pillar in a tailor rolled coil (re-created after Citation Q-7).
The tailored rolling process squeezes and thins any coating, and possibly damages the coating as well.T-4 For this reason, TRBs are typically used in dry areas. Because of similar reasons, in AS coated TRB applications, AS150 (75 g/m2 on each side, Al-Si coating) is preferred instead of thinner coatings such as AS80.
One of the first press hardened TRB applications was the B-pillar reinforcement of the BMW X5 (2nd generation, 2006-2013). The application saved 4 kg/car, compared to a monolithic press hardened part.P-1 Other applications include: heel piece of MQB (Modularer Querbaukasten, translating from German to “Modular Transversal Toolkit”) platform cars – covering many VW Group cars with transverse engine orientation, since 2012S-107, front crossmember of MLB Evo (Modularer Längsbaukasten, translating from German to “Modular Longitudinal Toolkit”) platform cars – covering Audi vehicles with longitudinal engine orientation, since 2015H-44, and roof crossmember of the 10th generation Honda Accord (2017-present).M-7Figure 15 summarizes these. Many other OEMs use tailor rolled blanks in press hardening, some recent applications include, but not limited to:
2024 Li Mega (A pillar uppers, B-pillars, Hinge pillars)C-42
Figure 15: Several TRB applications in recent vehicles (re-created after Citations H-44, P-1, S-107, and M-7).
Patchwork Blanks
In a patchwork blank, one or more “patch blanks” (reinforcements) are overlapped with a “master blank” and spot welded. The spot-welded blanks are then heated in a furnace and hot stamped as a single piece in one stroke. The final part will have increased thickness in the areas of interest. A patchwork blank may reduce the need for post-forming assemblies of reinforcements, as seen in Figure 16. Since the spot welds are also austenitized and quenched, their hardness distribution is typically better than spot welding after hot stamping, as shown clearly in Figure 17.B-20, U-12, N-3
Figure 16: Master blank and patch geometries of a sample B-pillar: (a) before, and (b) after spot welding, (c) after hot stamping. (re-created after Citations B-14 and L-52)
Figure 17: Hardness distribution in a spot weld, comparing when spot welding is done before or after press hardening. (Re-created after Citations B-14 and U-12)
Patchwork blanks allow for the possibility of reducing the number of forming tools and the associated fixed costs. Stamping and post-process joining costs may be reduced as well, leading to a variable cost reduction. Depending on how the part is engineered, a weight savings may be achieved. These benefits come at the expense of the additional blanking operation to create the patch blanks, and the pre-process welding stations.U-12, T-42
Optimizing the initial geometry of the patch blank helps reduce these costs. One approach is to use a one-step inverse simulation in the early planning / feasibility phase. In this method, the initial outline is estimated based on deformation theory of plasticity, requiring only relatively short CPU-times (in the order of a few minutes using a modern PC), with low accuracy (up to 3 mm deviation is common). A trim optimization method is recommended during the design phase of the patch blank blanking dies. In this method, an incremental solver is used with an initially assumed blank outline. Typically, the result of one-step solution is used for the first iteration. The software then compares the outline of the patch after forming and calculates the differences with the desired geometry. Then the initial geometry is modified accordingly, and another forming simulation is carried out. These iterations continue until the deviation is less than the set tolerances. For example, in a B-pillar patch optimization, ±0.25 mm deviation may be achieved in two to three iterations.W-8, Z-12, S-108
Reducing the number of spot welds also reduces the cost of the patch blank. Minimizing the number of spot welds may also reduce the cycle time in welding stations. In some cases, it may also affect the number of spot-welding stations — thus, the initial fixed cost. However, severe wrinkles may form if using an insufficient number of spot welds. Using finite element analysis may assist in finding the optimum number of spot welds for formability.A-19 In some cases, although the part could be hot formed with a smaller number of spot welds without any problems, more spot welds are applied for crash performance.U-12
Some of the earliest patchwork PHS applications were used in the B-pillars of 3rd generation Volvo V70 (2007-2016) and Fiat 500 (2007-2024). In the Volvo V70, a total of 46 spot welds were used to create the patchwork blank, Figure 18a. Both blanks were uncoated PHS1500, with a 1.4 mm thick master blank and a 2.0 mm thick patch.L-53 In the Fiat 500, the master blank was 2 mm thick, supported by a 1 mm thick patch, both AS coated, as seen in Figure 18b.Z-13 In recent years, patchwork PHS blanks have been used in more car bodies, including but not limited to several parts in the 2nd generation Volvo XC90 (2014-Present)L-29, rear rail of the Fiat 500X (2014-2024)M-45, B-pillar of the Opel Astra K (2015-Present)K-8, B-pillar of the 2nd generation Range Rover EvoqueF-1, and several Subaru models.U-12, A-73
In the rear rail of the Fiat 500X (2015-2024), the master blank is a laser welded tailored blank, consisting of 1.5 mm PHS1500 and 1.6 mm PQS450 sub-blanks. The patch blank is 1.5 mm thick PHS1500, spot welded onto the PHS1500 portion of the laser welded tailored blank.M-45 A similar design with different thicknesses was also used in Fiat Tipo/Egea (2015-present), as shown in Figure 18c.B-14 For the Opel Astra, the master blank is a 1.3 mm thick PHS1500 with soft zones (see the Tailored Properties discussion below). The patch is a TRB with 1.00-1.95-1.00 thickness distribution.K-8 A more recent application is seen in Voyah Dream minivan’s door ring. The door ring is consisting of 5 sub-blanks laser welded to each other and two patches spot welded to the main blank. The details can be seen in Figure 18d.H-70
Figure 18: Sample automotive applications of patchwork PHS: B-pillar reinforcements of (a) 2007 Volvo V70 (re-created after Citation N-4), (b) 2007 Fiat 500 (re-created after Citation Z-13); and (c) rear rail of 2015 Fiat Tipo/Egea (Citation T-43, recreated after Citation B-14); and (d) door ring of 2022 Voyah Dream (re-created after Citation H-70).
Jaguar I-PACE is an aluminium-intensive electric SUV making its debut in 2018. In this car, the B-pillar reinforcement is made up of a patchwork blank. Contrary to most earlier applications, the master blank is a PQS450, which could be joined easily to the rest of the body by mechanical joining. The patch is PHS1500, which improves the side impact and roof crush performance.B-21 In 2018, a global Tier 1 supplier showed the possibility of using PHS2000 master blank and patch for a rear bumper beam.N-6 Using PHS1900 as a patch is also a common method – since weldability of this material after hot stamping may be problematic (See Figure 18d).
Improvements in patchwork blank technology includes the weld type and quality. Conventional resistance spot welding has been used in making patchwork blanks. There are studies on using remote laser welding for this purpose as well. In one study, joining a patchwork blank with approximately 50 welds was completed in 35 seconds using 2.2 kW laser power, and in 23 seconds using 2.8 kW.L-54 Another study showed that when laser welding is used with AS-coated blanks, weld strength is reduced by approximately 40% compared to uncoated blanks.G-1
“Overlap patch blanks” are a sub-set of patchwork blanks. As seen in Figure 19a, instead of a master and patch blanks, two (or more) sub-blanks are spot welded over an “overlap region” to create a blank like a laser welded tailored blank. The technology was initially applied in cold stamped components.P-4 Recently an international tier 1 supplier developed door rings and floor panels made from overlap patch blanks that were press hardened. As seen in Figure 19 b and c, a door ring can be created using 5 sub-blanks, including one PQS (shown in green).G-3
Figure 19: Overlap patch blanks: (a) schematic of a B-pillar blank (re-created after B-75), (b) door ring concept from outer view, and (c) inner view.G-3
One of the benefits of using overlap patch blanks is the ability to build up larger welded blanks of Al-Si coated steel without the need to employ ablation technology. The overlapped sub-blanks can be resistance spot welded together, thereby avoiding the risk of aluminum polluting the weld pool that ablation would otherwise mitigate.
Patches can be engineered to increase stiffness in critical locations, and the spot welds provide easy adjustment to both the blank and weld as needed (Figure 20).S-111
Figure 20: Overlap patch blanks created with resistance spot welding eliminates the need to use laser welding and ablation techniques.S-111
Tailored Properties
Tailored properties is a term used for the technology to make a part with hard and soft zones. Hard zones are nearly 100% martensitic, whereas soft zones have a lower percentage of martensite. This type of part may be called a “multi-strength part”. In Europe, the term “tailored tempering” may be used to denote a part with tailored properties or the technique to make such a part. In this article, the “tailored tempering” term is specifically used to describe a part which was press hardened as a whole and later locally softened to modify properties in specific areas.
Soft zones may be used for several reasons:
To improve crashworthiness: Local areas with higher ductility aid in crash energy absorption. An example B-pillar is shown in Figure 6. This type of usage is very common in B-pillars, front rails, and rear rails, as shown in Figure 8. The first application for this purpose was realized in the B-pillar of the first-generation VW Tiguan (2007-2018).S-13 The technology is also used in rear rails. Both applications are shown in Figure 21. The technology is also used in rear rails of 10th generation Honda Civic (2015-2021)C-22, and 10th generation Honda Accord (2017-2024). In this particular application, shown in Figure 22, soft zones were designed such that the rear frame would deform in a pre-defined manner and absorb the crash energy efficiently.C-22, M-7, K-52 Tailored parts are used for improved energy absorption in numerous models from Audi, BMW, Ford, Honda, Mercedes and others.B-14
Figure 21: Example uses of soft zones for improved energy absorption: (a) first application was in 1st generation (2007-2018) VW Tiguan’s B-pillars (re-created after Citations V-22 and M-8), (b) a more recent application in 2013 Ford Escape’s rear rails (known as Ford Kuga in EU, sold between 2013 and 2019) (re-created after Citation M-59).
Figure 22: Rear rail assembly of Honda Civic (10th gen., 2015-2022): (a) Isometric view of the assembly, (b) bottom view of the frame, during rear crash condition (re-created after Citation K-52). A similar design was also employed in Honda Accord.M-7
To improve weld/joint strength: When base metal hardness is over 350 HV, the heat affected zone (HAZ) in the spot weld may be the weakest point of an assembly.B-20 Several other studies have proven the hardness drop and early fractures around spot weld of fully hardened parts, as summarized in Figure 23. When flanges are induction tempered (see the Tailored Tempering discussion below, a B-pillar assembly may absorb 30% more energy than a fully hardened B-pillar.H-61, F-2 In multi-material mix cars, such as the 2nd generation Audi Q7 (2015-present), “soft flanges” can be used for mechanical joining the PHS B-pillar reinforcement to aluminium components. Hemming of aluminium, around the PHS, can also be used to join the components.H-62 Since development of TemperBox® and Thermal Printer, soft zones for improving weld quality has significantly increased. Several new applications include Renault 5 BEV.G-53 and Mercedes EQE SUV BEV.D-47, as seen in Figure 24.
Figure 23: When spot welding is done on a soft zone: (a) hardness distribution would not have a soft HAZ, and (b) early fractures at spot welds are not observed (re-created after Citations B-14, H-61, and B-64).
Figure 24: Soft zone applications to improve weld quality: (a) Mercedes EQE SUVD-47, and (b) Renault 5 BEVG-53.
For secondary bending operations: Tailored tempering (softening areas of interest after a fully hardened press hardening process) may be used in bumper beams, where a secondary bending may be required to form an inner flange.L-40
To facilitate trimming/piercing: Although not very common, local soft zones may reduce the force/energy requirements and improve the cutting tool life if hard trimming will be used.L-55
In addition to the engineered use of soft zones, it is possible that they could be produced unintentionally. While the theoretical production press hardening process results in fully martensitic content, the real product may have a multiphase microstructure. For example, there must be good and continuous contact between the sheet and the stamping tools to achieve sufficient heat extraction such that the critical cooling rate is met. However, there may be unexpected regions of poor contact preventing the required rapid cooling. This might occur at the vertical sidewalls of a channel section, or after tooling wear creates an air gap between the punch and cavity. As such, the martensite volume fraction in production PHS may not be 100%. This leads to changes in strength-ductility properties, as well as the cutting force requirements: as the martensite percentage decreases, so does the force required to cold cut processed PHS. These are reflected in Table 1.W-44
Table 1: Mechanical properties and cutting force requirements of 22MnB5 as a function of the martensite volume fraction.W-44
Phase Composition
Yield Strength(MPa)
Tensile Strength(MPa)
Elongation
(%)
Max Cutting Force
(kN)
100% Martensite
1151
1675
8.40
54.42
87% M + 13% B
1003
1529
7.23
53.31
68% M + 32% B
767
1328
9.50
45.23
52% M + 48% B
604
1057
10.28
37.09
23% M + 77% B
567
976
13.83
32.66
100% Bainite
550
809
17.39
28.69
There are three methods to create the soft zones leading to tailored properties:B-14
Tailored heating during austenitization of the blank (typically achieved in the furnace),
Tailored quenching after austenitization (can be achieved in tempering stations or in the forming die),
Tailored tempering after fully hardening a part (after the press hardening process).
1) Tailored Heating (Pre-Process)
In tailored heating, areas of interest (the soft zones) are not fully austenitized. The critical heating temperature has been reported as 750 °C by several researchers. When heated below 750 °C and hot stamped, the part has a tensile strength of approximately 600 MPa and over 15% total elongation. As seen in Figure 25, mechanical properties will stay relatively constant with heating temperatures between 650 and 750 °C. Above this critical heating temperature, hardness (almost directly proportional with tensile strength) may increase significantly.K-53
Figure 25: Effect of blank heating temperature on hardness and converted tensile strength of PHS1500 (re-created after Citation K-53).
There are several methods to achieve tailored heating. In the direct process, where an undeformed blank is being heated, there were four main methods proposed:
Using a divided furnace,
Masking soft zones in furnace,
Heating by segmented contact plates, and
Conduction heating with controlled current flow.
A divided roller hearth furnace may have gas or electric heating for the first half of its length, ensuring a uniform temperature distribution during heating. In the second half of the furnace length (soaking zone), there may be several electric heating zones across the furnace width direction that can be set to different temperatures. To simplify the schematic, Figure 26 shows a two-zone divided furnace. In the soaking zone, five-zone furnaces were already available as early as 2011. By 2018, furnaces with 32 zones were industrially used to make parts for several German OEMs.H-47, E-12, O-13
Figure 26: Divided furnace concept (simplified with two zones): (a) temperature setting in the furnace affects the temperature distribution in the soft and hard zones; (b) in the tailored soaking area, up to 32 zones may be realized (re-created after Citations B-14, E-12, and O-13).
As heating of the blank in furnace is mostly achieved by radiation, an insulating mask may reduce the local temperature in the soft zones. Ceramic insulators or machined steel blocks may be used for masking purposes. Areas that are not masked will be heated above the austenitization temperature, whereas the masked areas will be at lower temperatures.N-3Figure 27 shows a schematic of the process. In addition to masking duty, the inlay should have enough heat capacity to absorb the heat from the blank. When steel inlays (masks) are used, they should be thicker than the blank to have the necessary heat capacity. Stainless steels could be used to avoid scaling of the steel inlay.B-65, B-66
Figure 27: (a) Using masking for tailored heating (re-created after Citations B-14 and N-3); (b) an example mask and blank from Citation K-54.
Although not commonly used for mass production, it was proven that contact plates may be used in tailored heating. Blanks are isolated from the environment during contact plate heating, significantly reducing oxidation on uncoated blanks. Fraunhofer IWU in Chemnitz, Germany, has developed a lab-scale contact plate heater that can generate soft zones. In the hard zones (those heated over 900 °C), the heating rate may be as high as 300 °C/s. The heater and a sample blank are shown in Figure 28.S-109, G-48
Figure 28: Tailored heating in contact plate heating: (a) right after the heating before the discharge, (b) a tailor heated blank with dimensions and approximate temperatures (re-created after Citation S-109).
Two different strategies were developed to generate tailored heat blanks using conductive heating while ensuring no current passes through the targeted soft zones.M-60 These approaches are applicable only to rectangular blanks. Researchers in Hanover University improved the technology to heat non-rectangular blanks with tailored temperature distribution. In a sample (non-rectangular) B-pillar blank, temperature was kept at 950 °C in the heated zones and approximately at 700 °C in the soft zones. Significant temperature drops were observed in the proximity of electrodes, resulting in non-uniform heating.B-67 Neither of the techniques are used in mass production for tailored parts.
In the indirect hot stamping process, the parts are formed prior to heating. Thus, it is not practical to apply any of the earlier strategies to get a cold zone in the part. For such components, soft zones are generated by using machined steel blocks known as absorption masses, which have high heat capacity to absorb the heat from the blank. As seen in Figure 29, correctly sized absorption masses keep the soft zones below 750 °C. When quenched, these areas have approximately 500 MPa tensile strength, over 20% total elongation (A50) and over 150° bending angle according to VDA bending test. The tailored parts have narrow transition zones, and are spot weldable, both in hard and soft zones. The technology is used in the B-pillar reinforcements of several BMW models.M-2, K-53, R-27
Figure 29: Tailored heating of galvanized PHS1500 in the indirect process: (a) Blank temperature evolution in hard and soft zones, in a roller hearth furnace using absorption mass in the soft zone; (b) hardness distribution and approximate tensile strength in hard and soft zones (re-created after Citation K-53).
Tailored heating technologies are beneficial for their energy efficiency, as the soft zones are heated to lower temperatures. The technology may be applied to uncoated and Zn-coated blanks; however, AS-coated blanks are at risk for incomplete coating diffusion in the soft zones. For these reasons, similar technologies (excluding conduction heating) also are used in a secondary heating device after the furnace.O-13 These techniques are listed in the Intermediate Pre-Cooling section below.
2) Tailored Quenching
In tailored quenching methods, the whole blank is austenitized in the furnace and the cooling rate is controlled such that the soft zones cannot develop high percentages of martensite. This can be achieved by two main process routes:
Intermediate pre-cooling, where a secondary furnace is employed where the temperature of hard zones is maintained, but soft zones are allowed to cool.
In-die cooling, where a fully austenitized blank with uniform temperature distribution is placed on the tool, but the part is cooled at different cooling rates through several process routes.
Intermediate Pre-Cooling
Complete coating diffusion may not occur in AS-coated blanks subjected to tailored heating profiles. To ensure the full coating diffusion and uniformity of the coating all around the blank, the blanks must be fully austenitized and soaked in the furnace for a dwell time. One of the earliest approaches kept the hard zones in the roller hearth furnace, while extending the soft zones out of the furnace. This technology produced a part with two zones only, with a linear transition zone (Figure 30). AS-coating is fully developed for weldability and e-coat adhesion. Tailored properties are reproducible. For this furnace-extending method, no extra investment is necessary other than automation programming.L-56
Figure 30: Simplest pre-cooling technology: extending the soft zones out of the furnace. (a) Schematic of extending out of furnace (not to scale, from Citation B-55), (b) B-pillars made by this technology.A-74
Intermediate pre-cooling can also be done in a divided furnace. In this case, contrary to Figure 26a, the uniform heating temperature is set over 885 °C. The soft zone area is then set to a lower temperature and thus pre-cooled. The rear rails of the 2013 Ford Escape (also known as Kuga) shown in Figure 21b are produced with this technique.M-59
Most of the tailored heating strategies discussed so far are suitable only for larger soft zone areas, but not for small areas. Intermediate pre-cooling by extending out of furnace and pre-cooling using a divided furnace strategy can only produce a two-zone tailored part, such as in Figure 31b. Since 2011, there has been an interest in producing three-zone tailored parts. By 2015, the Audi Q7 employed a three zone B-pillar with soft flanges for joining purposes. Soft zones for spot weld purposes are also commonly employed.H-62, A-74, B-68
Figure 31: Tailored B-pillar evolution: (a) monolithic, (b) two-zones tailored, (c) three-zones tailored, (d) three zones + soft flanges, (e) three zones + soft spots (re-created after Citations A-74, B-68, P-3).
To address these challenges, several intermediate cooling systems have been developed. AP&T uses multi-layer furnaces, with an addition of a TemperBox®. The blanks are austenitized in the multi-layer furnace. Before being fed into the press, the blanks are first moved into another layer (the TemperBox®) where re-heating is done with masking. Masked areas cool below 700 °C, whereas the unmasked areas are re-heated to 930 °C. The cycle time varies between 30 and 70 seconds, depending on the thickness of the blanks (Figure 32). For continuous production, one TemperBox® supports five-chamber furnaces.K-41
Figure 32: Time-temperature evolution in the TemperBox®. (re-created after Citation K-41).
Similar technologies have been developed by other furnace makers: Schwartz has developed a thermal printer which can be a stand-alone unit or installed at the end of a roller hearth furnace.L-56
In-Die Tailored Cooling
In this process, the blanks are fully austenitized in the furnace, but the cooling rate is locally adjusted. Areas with a local cooling rate over 27 °C/s are expected to transform to nearly 100% martensite. In soft zones, cooling rates should be lower than this critical number. The cooling rate is a function of the thermal contact conductance (see Figure 34a) and the temperature gradient (ΔT) between the tool surface and the blank. Thus, lower cooling rates can be achieved byB-14, M-61:
Heated die inserts,
Die relief method, or
Local die inserts with low thermal conductivity.
If a segment of the die is heated, sections of the blank in contact with this area have a smaller temperature gradient (ΔT), leading to reduced heat flow and lower cooling rates. It is possible for this phenomenon to occur unintentionally if the dies are not cooled efficiently and hot spots are observed.B-14
In the automotive industry, heated die inserts are used typically between 300 °C and 550 °C. Electric cartridge heaters are commonly used, Figure 33a. If the inserts are heated over 420 °C (the martensite start temperature for 22MnB5), no martensite formation occurs while the blank is in contact with the dies. For productivity purposes, sheets should stay in the dies as short as possible. After industrial quenching times (10-15 seconds), soft zones may still have phase transformation during air cooling in the exit conveyor. This may cause distortion in the final part. One simulation study found that 80 seconds of air cooling was needed to transform all the austenite into other phases.B-14, M-61, B-69, B-70
Figure 33: Tailored parts with heated die inserts: (a) Simulation model with cooling channels in hard zones and heating in soft zones, (b) phase transformation may continue in soft zones.B-70
This process has been applied as early as 2009 (if not earlier) in the Audi A5 Sportback.B-20 The car had a three-zone B-pillar, similar to the sketch in Figure 31c. Since then, several complicated geometries have been realized in an industrial scale with “heated die insert” technology. In 2015, the 10th generation Honda Civic was equipped with complicated rear rails, shown in Figure 22. These components are also made with heated inserts.C-22 Also debuting in 2015, the Audi Q7 was equipped with B-pillar reinforcements with soft band and soft flanges (similar to Figure 31d).H-62
Another method to get lower cooling rates is to reduce the contact pressure or introduce an air gap between the blank and the die. As seen in Figure 34a, as the contact is lost, thermal contact conductance (hc, the amount of heat passing through the unit area of blank to the tool) is reduced significantly. For example, at 5 MPa contact pressure, hc is equal to 1.5 kW/m2°K. As soon as the contact is lost, the value is less than 0.3 kW/m2°K.B-70 A Schematic showing an “air gap” design for soft flanges is presented in Figure 34c and compared with a conventional die in Figure 34b.C-4
Figure 34: (a) Thermal contact conductance is less than 0.3 kW/m2°K, once there is an air gap (Citation B-55, raw data from CitationsO-14 and M-62); (b) schematic of a conventional press hardening die, (c) introducing air gap to obtain soft flanges.C-4
Use of insulated die inserts is another method to obtain tailored cooling. These reduce the heat flow from the blank to the die. Typical hot forming tool steels have a heat conductivity of 27-32 W/m2°K. When ceramic insulators with less than 6 W/m2°K conductivity are used (Figure 35a), the inserts will heat over 200 °C after a few strokes. In the meantime, tool steel temperature is around 60 °C, as they can dissipate more heat energy. The strength in the soft zones may be as low as 650 MPa, corresponding to approximately 200 HV hardness.K-55 The method may not be feasible for mass production, as the first few parts will not have the same strength/elongation level until a “steady-state” is achieved, shown in Figure 35b and 35c. In real production conditions, the production may be halted for maintenance, safety, or work hours reasons, thus every re-start will have several “out-of-spec” parts.
Figure 35: Insulating inserts: (a) experimental die set at TU Graz, (b) hardness distribution of the first part, (c) hardness distribution after a few cycles (re-created after Citations B-14 and K-55).
3) Tailored Tempering (Post-Process Annealing)
The last method for obtaining tailored properties is to produce soft zones by annealing a fully hardened part. This can be done by induction or laser, as seen in Figure 36. Post-process annealing is relatively simple to implement, as the blank is heated and quenched uniformly in press hardening line. Annealing is added as a follow-up operation, which adds cost, but gives flexibility. The number of soft zones, their geometries and mechanical properties can be varied during the project timeline. Soft zones could be adjusted for different cars/variants that share the same component but require different soft zones.B-14, G-48, J-22
With this approach, however, final properties of soft zones may vary significantly depending on the temperature-time curves. Several studies have shown yield strength may spread from 450 MPa to 1300 MPa, and tensile strength between 550 and 1350 MPa. In addition, geometric distortion may also occur, since the heating and cooling is done in a local area. Finally, surface and coating conditions may change, affecting weldability, corrosion resistance and/or e-coat adhesion.L-40, M-61, B-72
BMW has been using induction annealed B-pillars in their 3-Series Sedan/Touring (2011-2019) and X5 SUV (2013-2018)R-27, and possibly other vehicles. Volvo has studied the technology with induction annealing, Figure 36a.H-61 Benteler has been using induction annealing for secondary bending of bumper beams.L-40 Gestamp evaluated laser tempering on prototype parts, around 2016, Figure 36b.B-71 Since 2022, Gestamp has been using laser tempering, initially starting with Nissan Ariya BEV.N-29
Figure 36: Post-process tailored annealing can be done by: (a) inductionH-61, and/or (b) laser.B-71
Post Hardening Processing: Trimming
Options include setting the trim line with a developed blank, laser cutting, soft zones, hard trimming, and hot cutting.
A developed blank might be appropriate for areas which can accommodate larger tolerances.
Soft zone development to aid in easier trimming and joining is discussed in the prior section.
Laser trimming leads to improved fatigue strength and raises the failure strains, but suffers from relatively long cycle times, high capital investment and operation and maintenance cost. More powerful high-end lasers measurably reduce cycle times.
Hard trimming is not usually the best long-term option for high volume applications since the hardness of the PHS part can be about the same as the hardness of trim steels. A harder, more wear resistant tool steel would now fail by chipping.
Hard trimming creates burrs, large shear zone, and microcracks in the fracture zone. Each of these lowers the fracture strain required for failure, which lowers component crashworthiness.
Hard trimming of fully hardened PHS needs extra consideration since the scale formed on uncoated PHS may lead to abrasive wear and Al-Si coatings may stick to the tool creating galling conditions. Uncoated blanks may be hard trimmed after sandblasting. PVD coatings improve wear resistance on trimming surfaces. World-class operations which use hard trimming specify advanced powder metallurgy tool steels with advanced tool coatings.
In-die hot cutting may occur after heating but before forming, and is usually limited to approximately 90° cuts. Microstructural changes occurring during the heating and cooling cycle influences flange position tolerances.
Hot cutting may also occur after forming but before quenching. This approach requires less force and causes reduced damage to the tooling and dies since the steel is softer to cut. One challenge is that the formed part is cooling during the cutting operation, with the part changing dimensions as it cools. Hot cutting improves cycle time and may reduce capital investment. Grains of fine ferrite rather than martensite form at hot sheared edge, reducing the delayed fracture risk associated with hydrogen embrittlement.
Honda developed this process to both trim the part as well as pierce holes during hot stamping to replace time- and energy-intensive laser cutting. (Figure 37, Figure 38). Their approach uses a high-speed hydraulic system, and further reduces cooling time by spraying the part with water (see Direct Water Quenching in PHS Processes). The first production application was the 2012 Honda N-Box Center Pillar Reinforcement. H-49, S-112
Figure 37: Honda N-Box Center Pillar Reinforcement created with In-Die Trimming during Hot Stamping.H-49
Figure 38: Internal Die Trimming Process at Honda. (re-created after Citations H-49 and T-40).
Forming a part at room temperature creates elastic strains, which will require some form of springback correction to bring the stamping back to part print. Forming at sufficiently high temperatures, such as with press hardening steels, allows for stress relief before the part leaves the die.
Springback correction can take many forms. The first approach is to apply an additional process that changes the elastic strains to a less damaging form. One example is a post-stretch operation that reduces sidewall curl by changing the tensile-to-compressive elastic strain gradient through the thickness of the sidewall to all tensile elastic strains though the thickness. Another example is over-forming panels and channels so that the release of elastic strains brings the part dimensions back to part print instead of becoming undersized.
A second approach is to modify the process and/or tooling to reduce the level of elastic strains created during the forming operation. An example is to reduce sidewall curl by replacing sheet metal flowing through draw beads and over a die radius with a simple 90 degree bending operation.
A third approach for correcting springback problems is to modify product design to resist the release of the elastic strains. Here, mechanical stiffeners added to the part design lock in the elastic strains and maintain desired part shape.
The approaches to springback correction described below are applicable to all higher strength steels, and typically will address both angular change and sidewall curl. AHSS grades having high flow stress in the formed part may require one or more of these approaches for satisfactory dimensional accuracy.
Minimizing springback through compensation in the first draw stage is more effective and less expensive than attempting to correct for existing springback in subsequent re-strike or re-forming operations. Approaches for improved dimensional accuracy include:
Minimizing bending/unbending as the metal flows to the final part shape reduces distortion and tool wear.
Reaching minimum strain levels across the panel minimizes springback and sidewall curl.
Accounting for tool material loss during recuts helps ensure sufficient tool stiffness to counteract the higher press forces required with AHSS grades.
Keeping the depth of AHSS channel-shaped parts as uniform as possible avoids forming distortions. Gradual shape transitions will minimize distortions, especially in areas of metal compression. Designing radii so there are only gradual transitions avoids stress risers and minimizes distortions. Minimize stretch/compression flanges wherever possible.
If die and process design cannot relieve all elastic strains, then creating a uniformly distributed residual stress pattern across the sheet and through the thickness will help eliminate the source of mechanical multiplier effects and thus lead to reduced springback problems.
Correcting Springback by Changing the Elastic Strain Distribution: Post-Stretch (Stake Beads, Hybrid Beads, and Active Binder Force Control)
One of the most effective techniques for significant reduction of both angular change and sidewall curl is a post-stretch operation. Applying an in-plane tensile force after all operations in which the sheet metal is bent and unbend over draw beads and across die radii can change the through-thickness tensile-to-compressive elastic strain gradients to all tensile elastic strains.
When the part is still in the die, the outer surface of the bend over the punch radius is in tension (Point A in Figure 1), while at the same time the inner surface is in compression (B). After the punch retracts and the part is no longer under load, the tensile elastic forces (A) tend to shrink the outer layers and the compressive elastic forces (B) tend to elongate the inner layers. These opposite forces form a mechanical advantage to magnify the angular change. The differential stress ∆σ is the driver for the dimensional change. Note that this reversal in stress direction after removal of the applied load is the same root cause that results in snap-through reverse tonnage reactions when punching higher strength steels.
Figure 1: Sheet metal bent over a punch radius has elastic strains of the opposite sign creating a mechanical advantage to magnify angular change. Similar effects create sidewall curl for sheet metal pulled through draw beads and over die radii. When the part is no longer under load, it will change shape to relieve these elastic strains.
In the case of side wall curl, this differential stress ∆σ increases as the sheet metal is work hardened going through draw beads and around the die radius into the wall of the part.
To correct this angular change and sidewall curl, apply a tensile stress to the flange end of the wall to generate a minimum tensile strain of 2% within the sidewall of the stamping. Figure 2 describes the sequence of events. The initial elastic states are tensile (A1) and compressive (B1). When approximately 2% tensile strain is added to A1, the strain point work hardens and moves up slightly to A2. However, when 2% tensile strain is added to B1, the compressive elastic strain state first decreases to zero, then climbs to a positive level and work hardens slightly to point B2. The neutral axis is moved out of the sheet metal. The stress differential ∆σ now approaches zero. Instead of bending or curving outward, the wall simply shortens by a small amount similar to releasing the load on a tensile test sample. This shortening of the wall length can be easily corrected by an increased punch stroke.
Figure 2: The large stress differential shown in Figure 1 is significantly reduced by applying a 2% tensile strain.
Post-Stretch with Stake Beads
Two die design methods currently in use can create the desired minimum 2% post-stretch on the sidewall of AHSS parts, both of which utilize what are commonly referred to as stake beads.
The first method involves retractable beads located in machined slots in the lower blankholder. The upper blankholder has machined stake bead pockets. Adjustable stop blocks located directly under the retractable stake beads can be shimmed to alter the timing when the stake bead engages the stamping, if required.
At the targeted punch stroke position, the retractable beads hit the stop blocks which forces them into the sheet metal flange. This creates a blank locking action while the punch continues to deform the part. As the die opens, the stake beads retract, and the cycle repeats itself from press stroke to press stroke. Adjustability of the draw bead height has advantages, particularly during initial die tryout.
As the retractable beads are inserts, removing them for hardening, coating, polishing, etc., is much easier than moving an entire die to perform bead work. Duplicate inserts can also be made, even utilizing alternative tool steels to increase durability. Locating the retractable stake bead on the blankholder, however, can lead to a larger required blank size. Die construction costs for retractable stake beads are also higher due to the additional machining required.
It is important to have adequate structural die support to avoid breaking the die. Significantly greater lateral thrust forces can cause catastrophic die failure if the stake beads are located too close to the punch opening. This is also true for many other die components, so die construction standards for mild and HSLA steels may not apply to AHSS.
An alternate approach is to locate the stake beads on the punch. Stake beads are machined directly in the punch casting, with the stake bead pockets machined into the upper die cavity. This approach may allow for a reduced blank size, since less material is needed outside the punch opening to accommodate both the draw bead and the stake bead. Figure 3 shows a DP590 B-pillar draw panel with draw beads located on the blankholder and stake beads located on the punch just inboard of the draw beads.
Figure 3: DP590 B-pillar with draw beads on the blankholder and stake beads on the punch. Yellow arrows point to the stake beads; blue arrows point to the draw beads located closer to the edge of the draw panel.
Figure 4 shows a draw die punch with stake beads machined at the very edge of the punch opening, along with the upper die with the stake bead pockets machined out.
Figure 4: Left Image – Stake beads machined into the punch of this DP780 die; Right Image: Stake bead pockets machined into the upper draw die. Note that there are no draw beads on this blankholder.
Draw beads control metal flow in draw dies. However, draw beads may become less functional when forming higher strength sheet steels having higher work hardening characteristics. Here, bending and straightening when pulling the sheet through the punch opening radius, combined with bearing on the binder surface, may be sufficient to control metal flow.
The punch and upper binder in Figure 4 have no draw beads, and instead exhibit stake beads that engage late in the press stroke. This solution is lower in cost but provides limited flexibility since the beads are machined directly into the die. In contrast, Figure 5 shows a die with removable stake bead inserts located on the punch. This approach has improved adjustability, but the added expense of machining the die and installing stake bead inserts.
Figure 5: This die has adjustable stake beads located on the punch as inserts, and do not retract during every press stroke. Note also that there are no draw beads on the blankholder.A-6
A third option to achieve the post forming 2% strain on the part with stake beads involves an additional die or die station. After nearly fully forming the part in the first die, a second die locks the remaining flange in place and further deforms the part by the additional 2%. This approach is expensive since it requires construction of an additional die, or if processed in a progressive die, adding this extra station increases the size and complexity of the progressive die.
Ensuring dimensional precision may require a restrike operation after trimming. In addition to sharpening the radii, the restrike die may provide the sidewall stretch (post-stretch) of approximately 2% required to eliminate curl.
Studies have shown that the height and geometry of the stake bead can impact springback control. Insufficient stretching below the targeted 2% post-stretch may not sufficiently address springback. If the restraining force of the stake bead is too great, it could lead to fracture at the bead or punch opening radius.
Adjusting the stake bead geometry around the part creates an unbalanced post-stretching configuration. Researchers applied this approach to counteract springback in a 3rd Generation steel, with more shallow beads used on deeper drawn sections of the tested part.J-11
The magnitude of springback is a function of the uniformity of the stress distribution through the thickness direction the wall of the formed sheet. An optimized combination of draw beads and stake beads promotes a uniform stress distribution through the thickness, which leads to improved springback control (Figures 6 and 9). Successful simulation provides a range of acceptable combinations of draw bead and stake bead heights.Z-15
Figure 6: A combination of draw beads and stake beads promote a uniform stress distribution through the thickness, leading to improved springback control.Z-15
Press Force and Energy Considerations when using Stake Beads
These post-stretch forming operations normally require significantly higher forming forces and energy requirements to be effective for several reasons.
Any sheet metal will work harden after going through draw beads. Since AHSS grades work harden to a greater degree than conventional high strength steels, the AHSS grades have significantly higher yield strength once the blank has passed over the draw beads. As stake beads are located inboard of draw beads, the stake bead must now deform material with a much higher yield strength due to the work hardening created by the bending and straightening of the material from being pulled through the draw bead.
Since stake beads engage late in the press stroke, their use has similar implications as creating embossments as discussed in a Press Energy case study in the Press Requirements page. This Case StudyH-3 shows that the last increment of punch travel required to finish embossing requires significantly higher energy for AHSS versus conventional mild or HSLA steel. In the current discussion on stake beads, inducing an additional 2% post forming strain into the part will also require higher forming forces and energy requirements, since the forming process work hardened and strengthened the sidewalls. Even if the press has sufficient force and energy characteristics, avoid necking down and tearing the sheet metal as it bends over the punch radius.
Case Studies: Using Stake Beads to Reduce Springback L-1
This case study evaluated springback on specially constructed dies tested using several grades of conventional and advanced high strength steels, including HSLA, dual phase, and TRIP grades with tensile strength ranging from 450 MPa to 980 MPa. One die used the conventional approach, allowing for metal to flow from the flange without a bead. The second die had a recessed square stake bead in the flange that created a post-stretch condition near the end of the stroke. As expected, the post-stretch die resulted in dramatically lower springback (Figure 7). In addition, springback on parts made with this die was not a function of the sheet metal tensile strength, making for a more robust process.
Figure 7: Comparison of two DP 450/750 parts, where stake beads in the bottom part minimized springback. Both images are different angles of the same parts.L-1
Post-Stretch with Hybrid Beads
As seen in the prior figures, the stake beads geometry plays an important role in restricting the metal flow when stretching the sidewalls during the last stages of the punch stroke. This approach requires a larger blank to accommodate the bead, and must be used in a press with sufficient tonnage to set the bead.
A modified approach significantly reduces the blank size requirements as well as lowers the required tonnages to create the bead. It uses stinger beads to penetrate the sheet metal as well as create a wave shape in the deformed region which restricts metal flow. This so-called hybrid bead takes up less than 25% of the bead surface area compared with a conventional stake bead, allowing for a measurably smaller blank. There is no bending over tight bead radii, eliminating the splitting risk at the bead. The restricted metal motion across the beads further minimizes the stress differential between the two sheet steel surfaces, which eliminates a significant root cause of sidewall curl.
Figure 8 highlights the influence a hybrid bead has on springback of a 3rd Generation Steel having a minimum tensile strength of 980MPa.
Figure 8: Hybrid bead dramatically reduces springback in a 3rd Generation steel having 980 MPa minimum tensile strength, while taking up less space and requiring reduced tonnage than stake beads.A-6
Animations of the process sequence is presented in Figures 9 and 10, with more information available in Citations J-12 and W-19.
Figure 9: Animation showing a combination of draw beads and stake beads to reduce springback.A-6
Figure 10: Animation showing application of hybrid beads to reduce springback.A-6
Post-Stretch with Active Binder Force Control
While most stamping processes apply binder pressure uniformly throughout the press stroke, modern stamping presses can be equipped with cushions having multipoint-control systems. Adjusting the associated pressure profile around the panel and throughout the stroke optimizes metal flow, prevent splits and wrinkles, and minimize thinning. This active binder force control capability allows for application of increased blank holder force at any point of the stroke, including at the end to achieve the targeted 2% post-stretch needed to minimize springback. (See the AHSS Insights blog by Dr. Daniel Schaeffler from Engineering Quality Solutions, Inc.)
Beyond simply increasing the blank holder force at the end of the stroke, varying the pressure sequence during the stroke may be beneficial as well. DP 340/590 steel was stamped using a constant binder force, an increasing binder force starting low and finishing high, and a third approach where the initial part of the stroke formed the part with a medium binder force which dropped for most of the stroke but increased at the end to apply the sidewall tension. This third approach resulted in the least angular change and sidewall curl, as seen in Figure 11.
Figure 11: DP 340/590 stamped with constant binder force (top), low-to-high binder force (middle), and medium-to-low-to-high binder force (bottom).P-14
Correcting Springback by Changing the Elastic Strain Distribution: Over-Forming
Many angular change problems initiate when constructing the tooling either to part print or without sufficient springback compensation. Achieving targeted dimensions may require over-forming or over-bending.
Use rotary bending tooling where possible instead of flange wipe dies. Rotary bending allows for easy adjustment of the bending angle to correct for changes in springback due to variations in steel properties, die set, lubrication, and other process parameters. In addition, the tensile loading generated by the wiping shoe is absent.
However, if over-bending with flange wipe dies is the chosen approach to minimize angular change, use die radii less than the part radius and use back relief for the die and punch (Figure 12). This approach intentionally subjects the bending radius to compressive stresses between the punch and die. The squeezing and associated thinning at the bend radius results in plastic deformation of the sheet steel, with little elastic recovery after unloading from the press.
Figure 12: Providing back relief on the flange steel and lower die aids over-bending.A-2
Cross section design for longitudinal rails, pillars, and cross members impacts the effectiveness of springback compensation methods. The rail cross section in sketch A of Figure 13 does not allow the use of over-bending for springback compensation in the forming die. In addition, this design likely leads to severe sidewall curl in AHSS channel-shaped cross sections. Minimize these quality issues by designing a cross section that allows for over-bending during forming, as shown in sketch B. Reduced sidewall curl is another benefit of this cross-sectional design. Springback allowance must increase as strength increases. Typical wall opening angles are 3-degrees for Mild steel, 6 degrees for DP 350/600 and 10 degrees for DP 850/1000 or TRIP 450/800. In addition, the cross section in sketch B will have the effect of reducing the impact shock load when the draw punch contacts the AHSS sheet. The vertical draw walls shown in sketch A require higher binder pressures and higher punch forces to maintain process control.
Figure 13: Changing a rail cross section from A to B allows easier over-bending for springback control.N-3
Producing closed box sections involves welding two channel sections together at their flanges. Hat-sections with 90-degree corners such as seen in sketch A of Figure 14 will experience many production problems since each component will have issues with sidewall curl and angular change. The hexagonal section in sketch B will reduce sidewall curl and twist problems, while permitting over-bend for springback compensation in the stamping dies.
Figure 14: Changing the design of a closed cross section from A to B leads to a reduction in springback problems.N-3
Adding extra stages to the forming process allows for secondary operations to return a sprung part back to nominal dimensions. For example, Figure 15 shows a process where a crown existing in the first step when forming a channel section uses a second die for flattening and eliminating sidewall springback.
Figure 15: Schematic showing how flattening a crown corrects angular springback.A-3
As a related process, multiple stage forming (Figure 16) is an option to minimize springback and improve dimensional accuracy when stamping rails or other parts with a hat-shaped cross section consisting of right angles. This processing approach creates a design which avoids re-working previously-formed (and therefore work hardened) sections.
In the first operation, all 90-degree radii and mating surfaces are formed using “gull-wing” processes with over bending to compensate for springback. The larger radius in the top of the hat section gets flattened in the second stage. Certain cases may require an over bending of the flat top section.
Multiple-stage forming also helps when forming parts having small geometrical features of severe geometry that can be formed only in the re-strike operation. A part that has a variable cross section in combination with small geometrical features may need a coining operation in the second or last stage of the forming process. This may be the only way to control the geometry.
Figure 16: Two-stage forming produces a dimensionally accurate hat section with relatively small radii.R-1
Correcting Springback by Reducing or Minimizing the Elastic Strains
The process design, and therefore the tooling design, can drastically affect the level of the elastic strains in the part.
As an example, different blankholder actions provide four possible processes to form a hat-profile channel, each with different dimensional accuracy (Figure 17). The four processes are:
Draw: the conventional forming type with continuous blankholder force and all blank material undergoing maximum bending and unbending over the die radius. This forming mode creates maximum sidewall curl.
Form-draw: a forming process in which application of the blank holder force occurs between the middle and last stage of forming. It is most effective to reduce the sidewall curl because this approach minimizes bend unbend deformation at the beginning of the stroke prior to application of any blank holder force. Applying a large tensile stress during the last stage of forming creates the post-stretch condition to further minimize curl.
Form: a process where the flange is created during in the last stage of forming and the material undergoes only a slight amount of bend-unbend deformation. Depending on the part geometry, the lack of a blankholder may lead to wrinkles.
Bend is a simple bending process to reduce the sidewall curl, which avoids the bend and unbend sequence associated with sidewall curl. However, this approach likely leads to an angular change in the sidewall.
Figure 17: Four processes for generating a channel for bumper reinforcement create different levels of elastic strain and springback.K-5
Correcting Springback by Locking in the Elastic Strains
Where part design allows, geometrical features like darts, beads, and stiffeners prevent the release of the elastic strains and reduce various forms of springback. Minimize twist by adding strategically placed vertical beads, darts, or other geometric stiffeners in the shorter length wall to equalize the length of line.
Applying these features in a restrike operation may not be possible due to equipment or design limitations, since the yield strength of the sheet metal increases after work hardening. In the case of AHSS grades, this work hardening leads to a dramatic increase in strength.
Any elastic strain locked into the panel remains trapped in the part and manifests as residual stress. Subsequent forming, trimming, punching, heating, or other processes may unbalance the residual stress and change the part shape. For these reasons, the full process needs to be simulated, incorporating both material and geometrical changes occurring in all prior operations.
Figures 18 to 22 present examples of how elastic strains can be locked into the part to control for springback.
Figure 18: Geometrical stiffeners like flanges or beads lock elastic strains into the part, fixing the part shape.A-2
Figure 19: B-pillar using stiffening darts to control springback.A-41
Figure 20: Step flange locks in elastic strains on a draw wall.A-41
Figure 21: Hat section showing the effects geometrical features have on controlling springback. Angular change and sidewall curl are noticeably less pronounced on the left side having the vertical beads, compared with the right side where no springback mitigation methods were employed.K-14
Figure 22: DP600 front rail upper reinforcement with vertical beads designed into the part geometry for springback control.F-9
Tooling Design and Stamping Process Contributions to Springback
An American Iron and Steel Institute study defined several tool and process parameters that reduced angular change and side wall curl (Figures 23 and 24). As expected, angular change and curl increase with yield strength. Tighter clearances, smaller punch radii, and higher drawbead restraining forces reduced both types of springback.S-47
Figure 23: The effect of tool parameters in angular change. The lower values are better.S-47
Figure 24: The effect of tool parameters in sidewall curl. Higher values of radius of curl are better.S-47
Figure 25 highlights the importance of keeping the die clearance as tight as allowed by formability and press capability. Unwanted bending and unbending work hardens the sheet metal and promotes increases in springback.
Figure 25: Reducing die clearance restricts additional bending and unbending as the sheet metal comes off the die radius, minimizing angular change.Y-2
Figure 26 illustrates that angular change increases dramatically for higher strength steels as the bend radius increases. Minimizing angular change requires designing the punch radius as sharp as formability and product/style allows. However, with AHSS grades, sharp radii may promote the local formability failure mode of shear fracture. Inside product feature radii should be a minimum of 3T for any AHSS grade having a tensile strength at or above 590 MPa. Die radii at draw beads, punch openings, etc., where the material is pulled under tension over a radius should be at least 5T for any AHSS grade over 590 MPa. Minimum bend radii requirements may be even greater as strength levels continue to increase, roll forming excluded. To avoid problems due to specifying the wrong AHSS grade for the wrong application, bend testing and hole expansion testing should be used in conjunction with close communication with the steel supplier when selecting the proper die radius for the intended AHSS material. In addition, sharp radii contribute to excessive thinning at the tangent to the radius when global formability failures are of concern.
Figure 26: Angular change increases with yield strength and bend radius at a constant thickness.S-2
Case Study in Springback Reduction Strategies
Automakers face conflicting constraints of lightweighting while improving safety performance. The B-Pillar Inner plays a significant role in meeting ever-increasing roof crush and side impact performance requirements. A studyM-17 published in 2007 showed the tooling and design changes made when transitioning from HSLA 340/440 to DP 550/980. These changes, shown in Figure 27, include adding sidewall beads to control springback, along with geometry to improve section stiffness.
Figure 27: Strategies to reduce springback in a DP 550/980 B-Pillar Inner.M-17
Another approach is highlighted in a Webinar from 2020.S-105 When forming hat-shaped sections, sidewall curl is minimized by using a cam to form the sidewall-flange area, followed by a more conventional sidewall stretch at the end (Figure 28). The animation in Figure 29 shows the process.S-6
Figure 28: Cam bending of sidewall-flange area minimizes springback.S-105
Figure 29: Animation of hat-section forming process to minimize springback.S-6
Compressive Stress Superposition for Springback Reduction
As explained above, springback and curl initiate when there are tensile stresses on one surface and compressive stresses on the other surface of the sheet. One of the keys to springback reduction is balancing these stresses through the sheet thickness.
A patented process known commercially as Smartform® relies on compressive stress superposition to achieve this stress balance. B-76 , L-65,B-77,, V-23
Achieving compressive stress superposition uses a two-step process where in the first preform step, the blank is formed into a “U” shape having a similar contour to the finished component, and then a sizing step to adjust the dimensional accuracy. This second step compresses the sheet metal during sizing rather than making it thinner from a drawing operation.
In the preforming stage (OP20), geometrical flexibility in the design of the tool surface exists, as the final component contour is not set until the sizing calibration stage (OP30). This allows for enlarged radii and wall angles to be used as countermeasures to prevent wrinkling and cracks.
Since the preform is not drawn, the starting blank can be cut to almost the same size as its final geometry before it is formed, reducing the number of trimming operations in the die process, as well as the amount of material used. Reportedly, an average of 15 percent materials savings occurs relative to conventional types of forming, with the actual savings being dependent on the size and complexity of the component.
Another benefit: resulting from the way the stress balance is achieved, this technology is relatively insensitive to variations in sheet metal properties, leading to a highly robust process.
Compressive stress superposition has been shown to work for steels having minimum specified tensile strength of 590 MPa through 1180 MPa.
Figure 31: Compressive Stress Superposition Die Process.L-65
Key Points
Several process and design modifications remove (or at least minimize and stabilize) the different modes of springback found in channels and similar configurations:
Open wall angles achieved with minimized metal flow over die radii minimize angular change and sidewall curl.
Overbending accounts for angular change, allowing the part to spring back to the targeted dimensions. Subjecting the bending radius to compressive stresses at the bottom of the press stroke plastically deforms the sheet metal, minimizing the elastic strains associated with springback. Note that this approach is less successful in addressing sidewall curl.
Applying in-plane tension to the side walls after forming reduces springback. Methods include using stake-beads, hybrid beads, or active binder force control. However, with higher strength steels, it may be difficult to achieve sufficient stretch to the sidewall by simply increasing the blank holding force. Preventing metal flow into the wall during post-stretching may require lock beads. Bead geometry affects blank size and press requirements.
Geometric stiffeners like darts, beads, and flanges lock elastic strains in place preventing springback from occurring. Subsequent forming or trimming operations may relieve these stresses, resulting in dimensional distortion. In addition, the selected press must have the load and energy requirements to form these features.
Design the part and tool in such a way that springback is desensitized to variations in material, gauge, tools and forming processes (a robust system and process) and that the effects of springback are minimized rather than attempt to compensate for it.
The accuracy of forming simulation programs to predict springback continues to improve, especially if it incorporates a complete material characterization and the chosen model is appropriate for the challenges of the specific part and forming method. Even without full accuracy, springback simulations can predict the trend and test the effectiveness of proposed countermeasures. In all cases, verify predictions against physical measurements.
In its simplest explanation hot stamping consists of five operations: (1) blanking (or cutting-to-length), (2) forming, (3) heating, (4) cooling (quenching) and (5) trimming/piercing. Each process route listed below has a distinct order or type of these operations.
In most sources, hot stamping is explained with only two processes: Direct hot stamping (also known as Press Hardening) and indirect hot stamping (also known as Form Hardening). Although we define Press Hardening as a synonym to “Direct Hot Stamping” in this context, the term Press Hardening is also used throughout these AHSS Application Guidelines in a broader sense to collectively describe the different hot forming and quenching processes, including these 11 processes for part manufacturing:
Direct Process (Blanking > Heating > Forming > Quenching > Trimming > [Surface Conditioning if uncoated]) a. Direct Process with Direct Water Quenching
The most common process route in hot stamping is still the direct process (also known as press hardening).D-20 Here, previously cut blanks are heated typically in a roller hearth or a multi-chamber furnace to over 900 °C to create a fully austenitic microstructure. Depending on the material handling system, transfer from the furnace to the press may take up 6 to 10 seconds.B-14 During this time, the blank may cool down to 700 °C.G-24 Forming is done immediately after the blanks are transferred on the die, and should be completed before the blank cools below 420 °C.G-24, K-18 The blanks are formed in hot condition (state ❷ in Figure 1), and quenched in the same die to achieve the required properties. For 22MnB5 steel, if the quenching rate is over 27 °C/s, the part will transform to almost 100% martensite. For productivity purposes, higher cooling rates are often realized.K-18 Typical cycle times for a direct process with the 22MnB5 chemistry could be between 10 and 20 seconds, depending on the thickness.B-14 Global R&D efforts target improvements in cycle time.
The process is typically used for bare/uncoated steels (UC) or AlSi coated steels (AS). Zn coated blanks (GI or GA) are not suitable for direct process, as pure Zn melts around 420 °C and GA (Zn-Fe) coatings around 530-780 °C. (see Figure 3)G-25 If forming is done with liquid Zn over the blank, microcracks may fill with Zn and lower the fatigue strength of the final part significantly.K-20 A recently developed alloy minimizes these concerns, as explained in the “Pre-cooled Direct Process” section below.
Figure 1: A visual overview of the microstructural and property changes occurring during the press hardening process. In direct press hardening process, forming is done at state ❶, whereas the indirect process occurs at ❷. Re-created after B-14.
Typical Al-Si coatings prevent scale formation and decarburization at elevated temperatures. The aluminum-rich coating contains 7% to 11 wt.% Si, and acts as a barrier to offer corrosion resistance during service.F-14 In automotive industry, typical coating weights are AS150 (75 g/m2 coating on each side) or AS80 (40 g/m2 coating on each side).A-51 Refer to our page on Al-Si coatings for more details.
Formed parts must be trimmed and pierced to final geometry. In the direct process, the most common trimming method is laser cutting. The capital expense and cycle times associated with laser trimming factor into overall part cost calculations. In most plants, every hot stamping line has 3 to 5 laser trimming machines.B-14
When using uncoated blanks, controlled atmosphere in the furnace helps avoid excessive decarburization and scale formation. Surface scale locally changes the critical cooling rate, alters the metal flow and friction, and leads to premature tool wear. When uncoated material is hot stamped, a surface conditioning step like shot blasting may be required after forming to remove the scale.A-52Varnish coatings may also be used with direct hot stamping.
The grades used with the direct process may be referred to as CR1500T-MB-DS (Cold Rolled steel with typical 1500 MPa Tensile strength, Manganese-Boron alloyed for Direct [Hot] Stamping).
Direct Water Quenching
In conventional direct process, quenching is done by pumping water through the cooling channels drilled (or cast) in upper and lower tools. Since 2012, Japanese OEM’s and tier suppliers are commonly using a modification to this process, called “direct water quenching.”T-40 In this method, upper and/or lower tools are drilled with nozzles shown in Figure 2. The technique can be used with coated blanks. N-27
Figure 2: Direct water quenching: (a) schematic of the nozzles [N-27], (b) blank on the lower tool before deformation [T-51].
This technique may lead to productivity improvements: On a 1.4 mm steel, the 10-second quenching time associated with a conventional approach was reduced to 2.5 seconds with direct water quenching.N-28
Quenching time would be especially longer with thick blanks. When patchwork blanks are used, the thickest portion of the part dictates the quenching time duration. One Japanese OEM claims that at 3.8 mm thickness, water quenching may increase the part per minute by 5 times.K-64
Typically used for galvanized blanks, indirect hot stamping, also known as form hardening, starts by cold forming the part (at ❶ in Figure 1) in a transfer press or a tandem transfer line. The direct process is limited in that only one forming die can be used– which also doubles as quenching die. However, the indirect process can accommodate multiple die stations, allowing for the production of more complicated geometries, even those with undercuts. The part has almost the final shape exiting the cold forming press, where piercings and trimming could also be completed. The formed parts are then heated in a special furnace and quenched in a second die set.B-14,K-21,F-15
BMW 7 Series (2008-2015, codenamed F01) was the first car to have Zn-coated indirect hot stamped steel in its body-in-white.P-20 Zn-based coatings are favored for their cathodic protection. Zn-coated blanks may develop a thin oxide layer during heating, even if a protective atmosphere is used in the furnace. This layer helps preventing evaporation of the Zn (pure Zn evaporates at 907 °C at 1 atm. pressure), but must be removed before welding and painting. To achieve this, sandblasting, shot blasting or dry-ice (CO2) blasting are typically used.F-14, F-15 The grades for indirect process may be referred to as CR1500T-MB-IS (Cold Rolled steel with typical 1500 MPa Tensile strength, Manganese-Boron alloyed for Indirect [Hot] Stamping).
The indirect process cannot be applied to Al-Si coated blanks, as they have a hard but brittle intermetallic layer which would crack during cold deformation.F-14
In this process, as summarized in Figure 3, some of the forming occurs at the cold stage [❶ in Figure 1]. The semi-formed part then is heated in the furnace, significantly deformed to a final shape [❷ in Figure 1] and subsequently quenched in the same die. This process had found greater use in Europe, especially for deep drawn parts such as transmission tunnels. To avoid scale formation in the furnace and hot forming, a special varnish-type coating is commonly used. The final part must be surface cleaned with a process like shot blasting before welding to remove the varnish coating.S-63 Since the early 2010s, the process has been replaced by the direct process of Al-Si-coated blanks.N-15
Figure 3: Summary of “hybrid process” where deformation is done both at cold and hot conditions.B-14
A galvannealed (GA) coating primarily contains zinc and iron, and solidifies at temperatures between 530 °C and 782 °C, depending on the zinc content, as shown in Figure 4. Liquid Metal Embrittlement (LME) is not a concern if forming is done in the absence of liquid zinc.G-25 Hensen et al. conducted several studies heating galvannealed 22MnB5 blanks to 900 °C, but forming after a pre-cooling stage. As seen in Figure 5, the microcrack depth is significantly reduced when the forming starts at lower temperatures.H-26
Figure 4: Temperature limit to ensure absence of Zn-rich liquid (re-created after Citations G-25 and G-26)
Figure 5: Crack depth reduces significantly if the forming is done at lower temperature (re-created after Citation H-26)
In the pre-cooled direct process, the blank is heated above the austenitization temperature (approximately 870-900 °C), and kept in the furnace for a minimum soaking time of 45 seconds. Once the blank leaves the furnace, it is first pre-cooled to approximately 500 °C and then formed. Typical 22MnB5 cannot be formed at this temperature due to two reasons: (1) its formability would be reduced and (2) forming could not be completed before the start of martensite formation at approximately 420 °C.K-22, V-8
The development of a “conversion-delayed” hot stamping grade (see PHS Grades with approximately 1500 MPa TS), commonly known as 20MnB8, addresses these concerns. This steel has lower carbon (0.20%, as the number 20 in 20MnB8 implies), but higher Mn (8/4 = 2%). This chemistry modification slows the kinetics of the phase transformation compared with 22MnB5 – the critical cooling rate of 20MnB8 is approximately 10 °C/s. This allows the part to be transferred from pre-cooling stage to the forming die.
Then the blank is transferred to “pre-cooling stage” in less than 10 seconds. Precooling must be done at a rate over 20 °C/s, until the blank is cooled to approximately 500 °C. Then the part is transferred from the pre-cooling device to the press in less than 7 seconds. The forming is done in one hit in a hydraulic or servo-mechanical press, which can dwell at the bottom. The cooling rate after pre-cooling is advised to be over 40 °C/s. The final part may have zinc oxides and surface cleaning may be required.K-22, V-8 The grade may be referred to as CR1500T-MB-PS (Cold Rolled steel with typical 1500 MPa Tensile strength, Manganese-Boron alloyed, for Pre-cooled Stamping process).
Recently, several researchers have shown that pre-cooling may be used for drawing deeper partsO-6 or to achieve better thickness distribution of the final part.G-24 Since formed parts are typically removed from the press at approximately 200 °C, a pre-cooled part may require shorter time to quench, thus may increase the parts per minute.G-24
Multi-Step Process
(Blanking > Heating > Pre-cooling > Forming and Trimming > Air Quenching)
22MnSiB9-5 (see PHS Grades with approximately 1500 MPa TS) is a new steel grade developed by Kobe SteelH-27 for a transfer press process, named as “multi-step”. This steel has higher Mn and Si content, compared to typical 22MnB5. As quenched, the material has similar mechanical properties with 22MnB5. As of 2020, there is at least one automotive part mass produced with this technology and is applied to a compact car in Germany.G-27 Although critical cooling rate is listed as 2.5 °C/s, even at a cooling rate of 1 °C/s, hardness over 450HV can be achieved.H-27 This critical cooling rate allows the material to be “air-hardenable” and thus, can handle a transfer press operation (hence the name multi-step) in a servo press. This material is available only with Zn coating and requires a pre-cooling step before the transfer press operation.B-15 The grade may be referred to as CR1500T-MB-MS (Cold Rolled steel with typical 1500 MPa Tensile strength, for Multi-Step process).
Also known as inline hardening, this process is used to make profiles with constant cross sections and linear shapes. It is also possible to have closed profiles (tubes and similar) with this technology by adding a laser welding to the line (see Figure 6a). The process has been successfully used in many car bodies. Typical uses are: cross members, roof bows, side impact door beams, bumpers (with no sweep), front crash components and similar.G-28, H-28, F-16
Figure 6: Roll form PHS: (a) steps of the lineH-28, (b) photo of the induction heated area.G-28
The heating is typically done with induction heating, see Figure 6b. In one of the installations, the first induction coil operates at 25 kHz and the second at 200 kHz. The total heating power was approximately 700 kW and the line can run as fast as 6 m/s. It was found that if lubrication, speed and bending radius can be optimized, AlSi coated blanks could also be cold roll formed. However, they are not suitable for induction heating and may require a different process, such as form fixture hardening.K-23
The main difference between roll form PHS and form fixture hardening is the secondary “hot bending and forming” in the press. Here, cold roll formed profiles are cut-to-length and heated in a furnace. Heated profiles are then transferred to a press die, where sweep bending and/or further forming operations are completed. The parts are subsequently quenched in the same press die, similar to direct process. A typical line layout can be seen in Figure 7a. The secondary forming makes variable sections possible, as seen in Figure 7b. As the parts are cold roll formed and furnace heated, uncoated, Zn-coated and AlSi-coated (with precautions not to crack AlSi) blanks may be used in this process.H-28, K-23
Figure 7: Form fixture hardening: (a) schematic of a lineK-23, (b) bumper beam of Ford Mustang (2004-2014) made by this process..L-26
Form fixture hardening parts have been used in low volume cars such as Porsche 911 or Bentley Mulsanne. In some cars, form fixture hardening was used to manufacture the A-pillar of the convertible (cabriolet) versions of high-volume cars, especially in Europe. Most of these applications involved uncoated boron alloyed tubes (similar to 22MnB5).H-28 The 5th generation Ford Mustang (2004-2014) had form fixture hardened bumper beams in the front and rear, as seen in Figure 7b.L-26 The form fixture hardening process allows for use of AlSi coatings, since the steel goes through a furnace rather than an induction hardening step. Special care must be taken in cold roll-forming process to ensure the AlSi coating is not damaged.K-23
3-Dimensional Hot Bending and Quenching (3DQ)
(Cut-to-length tube > Local induction heating > 3-D Bending > Direct Water Quenching > Piercing)
In the 3DQ process, a tubular profile with constant cross section is quickly heated by induction heaters. By using movable roller dies, the part is bent. As the material is fed, water is sprayed on the induction heated portion of the tube to quench and harden it. The schematic of the process and the material strength through the process is illustrated in Figure 8. It is also possible to replace the movable roller dies with an industrial robot to bend and twist the tubular part.T-25
Figure 8: Schematic of 3DQ system (re-created after Citation T-25)
In January 2013, Mazda announced that the ISOFIX connection in the rear seats of a Premacy MPV (known as Mazda 5 in some markets) model was produced by this method, as shown in Figure 9a.M-24 In 2016, Honda started production of the sports car NSX (known as Acura NSX in some markets). This vehicle’s A-pillars were produced by 3DQ process, as shown in Figure 9b.H-29
Details of induction heating parameters, robot programming, cooling systems are explained in detail in reference L-71. The technology has been used on uncoated blanks, where a secondary e-coating may be used for corrosion prevention.T-52 In 2019, an academic study showed the feasibility of using Zn coated blanks in the 3DQ process.R-10
Form Blow Hardening / Hot Gas Metal Forming
(Cut-to-length tube or roll formed and welded profile > Heating > Pressure forming > Quenching > Piercing)
In hot gas metal forming, the tube or roll formed closed profile is heated first and placed onto a die set. The ends of the tube are sealed and pressurized gas or granular medium is forced inside the tubular blank. The forming forces are applied by the high pressure built inside the tube.C-16 It is also possible to end-feed material as in the case of (cold) tube hydroforming. After the deformation, the part is quenched either with water (form blow hardening) or by the air inside and the surface of the tool cavity (hot gas metal forming). In the latter case, similar to direct process, a water-cooling channel system inside the die inserts are typically required.K-23
Fraunhofer IWU has developed a hot gas metal forming setup in which both forming and quenching are done by compressed air. As shown in Figure 10a, the internal pressure can be increased to 70 MPa (700 bars) in only 6 seconds. The tools are cooled with internal cooling channels, Figure 10b. The parts produced with this technique have hardness values between 460 and 530 HV. Crashbox and camshafts are among the parts produced.L-27, N-16
Figure 10: Blow forming and quenching with air: (a) change of pressure in the tube and temperature of the tube, (b) simulation of heat transfer to the dies and cooling channels (recreated after Citation N-16)
In 2011, Spanish car maker SEAT published a study on form blow hardening process. In this study, they replaced the A-pillar and cantrail assembly of the SEAT León (Mk2, SOP 2005) with one form blow hardened part. The results were summarized asO-7:
7.9kg weight reduction per car,
Sheet material utilization increased from 40 to 95%,
Number of components in the assembly on one side of the car reduced from 5 to 2, and the roof rail was eliminated.
One advantage of this technology is the possibility to use the same die set for different wall thickness tubes. By doing so, parts can be produced for different variants of a car (i.e., coupe and cabrio, or North American spec. vs. emerging market spec.). This information applies to monolithic (i.e., same thickness throughout the tube) and tailor rolled/welded tubes as well.F-16 In 2017, tubular parts are hot gas formed by using 1900 MPa PHS tubes for customer trials.F-17
Since 2018, form blow hardening is being used in the Ford FocusB-16 and Jeep Wrangler.B-17 In the Ford Focus, a tailor rolled tube with thicknesses between 1.0 and 1.8 mm is used in Europe, whereas in China it is a monolithic (same thickness everywhere) 1.6 mm thick tube.F-16
A recent study using 42SiCr10 steel tubes of 2.5 mm wall thickness showed that the final part may have as high as 2500 MPa tensile strength. The heat treatment is summarized in Figure 11. When the tubes are removed from the dies (at around 195 °C) and heated in a furnace for 10 minutes at 260 °C, the total elongation is improved to over 20%, while the tensile strength is reduced to about 2000 MPa, as shown in Figure 12.W-43.
Figure 11: Process route of HMGF, including an additional Q&P process (re-created after W-43).
Figure 12: 42SiCr10 tubes after hot metal gas forming and additional partitioning process (re-created after W-43).
Steel Tube Air Forming process (STAF) is a modified and enhanced version of hot gas metal forming. In the STAF process, a metal tube is bent in a small press at room temperature. The preformed tube is transferred to the main press, where it is heated to the critical temperature using electrical conduction (Joule heating) by passing current through the tube. The first step creates the flanges where the press closes on the partially air blow formed tube. In the second step, air pressure completes the process by forming the desired cross section and overall shape.
As seen in Figure 13, the parts made with the STAF process can have a flange area for further welding/joining to other car body components. Some peripheral parts can be integrated into a single STAF part, improving productivity and manufacturing cost. The continuous closed cross section is created without the need for spot welding, improving stiffness and further reducing manufacturing costs. These factors combine to result in mass savings compared with conventional hot formed components, as indicated in Figure 14. F-18,F-41,F-42
Figure 13: The Steel Tube Air Forming process compared with other manufacturing approaches. STAF integrates flange formation without the need for additional spot welding.F-42 HSS stands for High-Strength Steel and may refer to conventional HSS or Advanced High-Strength Steels (AHSS).
Figure 14: The STAF process may reduce part count, assembled weight, and manufacturing complexity compared with other manufacturing approaches.F-41
The following video, kindly provided by Sumitomo Heavy Industries, highlights the STAF process along with associated benefits.F-41
In 2020, a Chinese company developed a new process route, named as vacuum hot stamping. In this technology, uncoated blanks are used. Parts are heated in a vacuum furnace (10-5 to 10-3 atm), resulting in a very thin (< 2μm) oxide layer and a decarburization layer of approximately 30 μm. The parts are formed in conventional hot stamping tools and press. The formed parts are first laser cut and then electro-galvanized. An additional tempering may be applied. Finally the coated parts are oiled for storage purposes. The process route is shown in Figure 15.A-86, A-87
Figure 15: Process route of vacuum hot stamping.A-87
The technique allows using uncoated blanks, thus has the following advantages over AlSi coated blanks:
Higher bending angle
No contamination on the furnace rollers
Fast heating possible
Ablation is not required for LWTB preparation
Since final part is Zn coated, has better corrosion resistance
Compared to uncoated blanks without vacuum forming, the advantages can be listed as:
Thin layer of oxides
No shot blasting required
Final part is Zn coated, has high corrosion resistance.
Advanced High-Strength Steels (AHSS) exhibit high degrees of work hardening, resulting in improved forming capabilities compared to conventional HSLA steels. However, the same high work hardening creates higher strength and hardness in sheared or punched edges, leading to reduced edge ductility. Microstructural features in some AHSS grades contribute to their sheared edge performance. While laser cutting results in less edge damage than mechanical cutting methods, the heat from laser cutting produces a localized hear treatment, changing the strength and hardness at the edge. Achieving the best formability for chosen processing path requires generating a consistent good quality edge from the cutting operation.
To avoid unexpected problems during a program launch, use production intent tooling as early in the development as possible. This may be a challenge since blanking dies are usually among the last set of tools completed. In the interim, many companies choose to use laser cut blanks. Tool, blank, and process development must account for the lower-ductility sheared edges in production blanks.
Edge Ductility Measurements
This article describes the impact of cutting and cut-edge quality on edge ductility. The primary tests which quantify edge ductility are Hole Expansion Testing, 2-D Edge Tension Testing, and Half Specimen Dome Testing. These links detail the testing procedures. The Hole Expansion Testing article has additional information pertaining to the effect of burr orientation and punch shape.
Cut Edge Quality
Any mechanical cutting operation such as blanking, piercing, shearing, slitting, or trimming reduces edge ductility. Each of these processes generate a zone of high work hardening and a reduced n-value. This work hardened zone can extend one-half metal thickness from the cut edge. This is one reason why edges fail at strains lower than that predicted by the forming limit curve for that particular grade (Note that FLCs were developed based on necking failure, and that edge cracking is a different failure mechanism).
DP and TRIP steels have islands of martensite located throughout the ferritic microstructure, including at the cut edges. These hard particles act as crack initiators and further reduce the allowable edge stretch. Metallurgical changes to the alloy minimize the hardness differences between the phases, resulting in improved edge ductility. Laser, EDM or water jet cutting approaches minimize work hardening at the edges and the associated n-value reduction, also leading to improved edge ductility.
Putting shear angles into cutting tools is a well-known approach to reduce cutting forces. Modifying the cutting tool leads to other benefits in terms of edge ductility. Researchers studied the effects of a beveled punch instead of the traditional flat bottom punch.S-9,S-50, S-52 In these studies, the optimized bevel angle was between 3 and 6 degrees, the shear direction was parallel the rolling direction of the coil with a die clearance of 17%. With the optimal cutting parameters, the hole expansion ratio increased by 60% when compared to conventional flat punching process. As expected, a reduction in the maximum shearing force occurred – by more than 50% in certain conditions. Dropping the shearing force helps reduce the snap through reverse tonnage, leading to longer tool and press life.
Multiple studies examine the trimmed edge quality based on various cutting conditions in mechanical shearing operations and other methods to produce a free edge such as milling and cutting using a laser or water jet. Edge quality varies based on parameters like cutting clearances, shear angles, and rake angles on mechanical shearing operations.
A typical mechanically sheared steel edge has 4 main zones – rollover, burnish, fracture, and burr, as shown in Figure 1.
Figure 1: Cross Section of a Punched Hole Showing the Shear Face Components and Shear Affected Zone.K-10
Parts stamped from conventional mild and HSLA steels have historically relied on burr height as the main measure of edge quality, where the typical practice targeted a burr height below 10% of metal thickness and slightly larger for thicker steel. Finding a burr exceeded this threshold usually led to sharpening or replacing the trim steels, or less likely, adjusting the clearances to minimize the burr.
Greater burr height is associated with additional cold working and creates stress risers that can lead to edge splitting. These splits, however, are global formability related failures where the steel thins significantly at and around the split, independent of the local formability edge fractures associated with AHSS. A real-world example is shown in Figure 2, which presents a conventional BH210 steel grade liftgate with an excessive burr in the blank that led to global formability edge splitting in the draw die. The left image in Figure 2 highlights the burr on the underside of the top blank, with the remainder of the lift below it. The areas next to the split in the right image of Figure 2 shows the characteristic thinning associated with global formability failures.
Figure 2: Excessive burr on the blank led to a global formability split on the formed liftgate. The root cause was determined to be dull trim steels resulting in excessive work hardening.U-6
Due to their progressively higher yield and tensile strengths, AHSS grades experience less rollover and smaller burrs. They tend to fracture with little rollover or burr. As such, detailed examination of the actual edge condition under various cutting conditions becomes more significant with AHSS as opposed characterizing edge quality by burr height alone. Examination of sheared edges produced under various trimming conditions, including microhardness testing to evaluate work hardening after cold working the sheared edge, provides insight on methods to improve cut edge formability. The ideal condition to combat local formability edge fractures for AHSS was to have a clearly defined burnish zone with a uniform transition to the fracture zone. The fracture zone should also be smooth with no voids, secondary shear or edge damage (Figure 3).
Figure 3: Ideal sheared edge with a distinct burnish zone and a smooth fracture zone (left) and a cross section of the same edge (right).U-6
If clearances are too small, secondary shear can occur and the potential for voids due to the multiphase microstructure increases, as indicated in Figure 4. Clearances that are too large create additional problems that include excessive burrs and voids. A nonuniform transition from the burnish zone to the fracture zone is also undesirable. These non-ideal conditions create propagation sites for edge fractures.
Figure 4: Sheared edge with the trim steel clearance too small (left) and a cross section of the same edge (right) showing a micro crack on the edge. Tight clearance leading to secondary shear increases likelihood of edge fracture.U-6
There are multiple causes for a poor sheared edge condition, including but not limited to:
the die clearance being too large or too small,
a cutting angle that is too small,
worn, chipped, or damaged tooling,
improperly ground or sharpened tooling,
improper die material,
improperly heat-treated die material,
improper (or non-existent) coating on the tooling,
misaligned die sections,
worn wear plates, and
out of level presses or slitting equipment.
The higher loads required to shear AHSS with increasingly higher tensile strength creates additional deflection of dies and processing equipment. This deflection may alter clearances measured under a static condition once the die, press, or slitting equipment is placed under load. As a large percentage of presses, levelers, straighteners, blankers, and slitting equipment were designed years ago, the significantly higher loads required to process today’s AHSS may exceed equipment beyond their design limits, dramatically altering their performance.
A rocker panel formed from DP980 provides a good example showing the influence of cut edge quality. A master coil was slit into several narrower coils (mults) before being shipped to the stamper. Only a few mults experienced edge fractures, which all occurred along the slit edge. Understanding that edge condition is critical with respect to multiphase AHSS, the edge condition of the “good” mults and the “bad” mults were examined under magnification. The slit edge from a problem-free lift (Figure 5) has a uniform burnish zone with a uniform transition to the smooth fracture zone. This is in contrast with Figure 6, from the slit edge from a different mult of the same coil in which every blank fractured at the slit edge during forming. This edge exhibits secondary shear as well as a thick burnish zone with a non-uniform transition from the burnish zone to the fracture zone.
Figure 5: Slit edges on a lift of blanks that successfully produced DP980 rocker panels. Note the uniform transition from the burnish zone to the fracture zone with a smooth fracture zone as well.U-6
Figure 6: Slit edges on a lift of blanks from the same master coil that experienced edge fractures during forming. Note the obvious secondary shear as well as the thicker, nonuniform transition from the burnish to the fracture zone.U-6
Cutting Clearances: Burr Height and Tool Wear
Cutting and punching clearances should be increased with increasing sheet material strength. The clearances range from about 6% of the sheet material thickness for mild steel up to 16% or even higher as the sheet metal tensile strength exceeds 1400 MPa.
A study C-2compared the tool wear and burr height formation associated with punching mild steel and several AHSS grades. In addition to 1.0 mm mild steel (140 MPa yield strength, 270 MPa tensile strength, 38% A80 elongation), AHSS grades tested were 1.0 mm samples of DP 350Y600T (A80=20%), DP 500Y800T (A80=8%), and MS 1150Y1400T (A80 = 3%). Tests of mild steel used a 6% clearance and W.Nr. 1.2363 / AISI A2 tool steel hardened to 61 HRC. The AHSS tests used engineered tool steels made from powder metallurgy hardened to 60-62 HRC. The DP 350/600 tests were run with a TiC CVD coating, and a 6% clearance. Tool clearances were 10% for the MS 1150Y1400T grade and 14% for DP 500Y800T.
In the Tool Wear comparison, the cross-section of the worn punch was measured after 200,000 hits. Punches used with mild steel lost about 2000 μm2 after 200,000 hits, and is shown in Figure 7 normalized to 1. The relative tool wear of the other AHSS grades are also shown, indicating that using surface treated high quality tool steels results in the same level of wear associated with mild steels punched with conventional tools.
Figure 7: Tool wear associated with punching up to DP 500Y800T using surface treated high quality tool steels is comparable to mild steel punched with conventional tools.C-2
Figure 8 shows the burr height test results, which compared burr height from tests using mild steel punched with conventional tool steel and two AHSS grades (DP 500Y800T and MS 1150Y1400T) punched with a PM tool steel. The measured burr height from all AHSS and clearance combinations evaluated were sufficiently similar that they are shown as a single curve.
Figure 8: Burr height comparison for mild steel and two AHSS grades as a function of the number of hits. Results for DP 500Y800T and Mart 1150Y1400T are identical and shown as the AHSS curve.C-2
Testing of mild steel resulted in the expected performance where burr height increases continuously with tool wear and clearance, making burr height a reasonable indicator of when to sharpen punching or cutting tools. However, for the AHSS grades studied, burr height did not increase with more hits. It is possible that the relatively lower ductility AHSS grades are not capable of reaching greater burr height due to fracturing, where the more formable mild steel continues to generate ever-increasing burr height with more hits and increasing tool wear.
Punching AHSS grades may require a higher-grade tool steel, possibly with a surface treatment, to avoid tool wear, but tool regrinding because of burrs may be less of a problem. With AHSS, engineered tool steels may provide longer intervals between sharpening, but increasing burr height alone should not be the only criterion to initiate sharpening: cut edge quality as shown in the above figures appears to be a better indicator. Note that regrinding a surface treated tool steel removes the surface treatment. Be sure to re-treat the tool to achieve targeted performance.
Cutting Clearances: General Recommendations
Depending on the source, the recommended die clearance when shearing mild steels is 5% to 10% of metal thickness. For punched holes, these represent per-side values. Although this may have been satisfactory for mild steels, the clearance should increase as the tensile strength of the sheet metal increases.
The choice of clearance impacts other aspects of the cutting process. Small cutting clearances require improved press and die alignment, greater punching forces, and cause greater punch wear from abrasion. As clearance increases, tool wear decreases, but rollover on the cut edge face increases, which in the extreme may lead to a tensile fracture in the rollover zone (Figure 9). Also, a large die clearance when punching high strength materials with a small difference in yield and tensile strength (like martensitic grades) may generate high bending stresses on the punch edge, which increases the risk of chipping.
Figure 9: Large rollover may lead to tensile fracture in the rollover zone.
Figure 10 compares cut edge appearance after punching a martensitic steel with 1400 MPa tensile strength using either 6% or 14% clearance. The larger clearance is associated with greater rollover, but a cleaner cut face.
Figure 10: Cut edge appearance after punching CR 1400T-MS with 6% (left) and 14% (right) die clearance. The bottom images show the edge appearance for the full sheet thickness, Note using 6% clearance resulted in minimal rollover, but uneven burnish and fracture surfaces. In contrast, 14% clearance led to noticeable rollover, but a clean burnish and fracture surface.T-20
A comparison of the edges of a 2 mm thick complex phase steel with 700 MPa minimum tensile strength produced under different cutting conditions is presented in Figure 11. The left image suggests that either the cutting clearance and/or the shearing angle was too large. The right image shows an optimal edge likely to result in good edge ductility.
Figure 11: Cut edge appearance of 2 mm HR 700Y-MC, a complex phase steel. The edge on the right is more likely to result in good edge ductility.T-20
The recommended clearance is a function of the sheet grade, thickness, and tensile strength. Figures 12 to 15 represent general recommendations from several sources.
Figure 12: Recommended Clearance as a Function of Grade and Sheet Thickness.T-23
Figure 13: Recommended Cutting Clearance for Punching.D-15
Figure 14: Recommended die clearance for blanking/punching advanced high strength steel.T-20
Figure 15: Multiply the clearance on the left with the scaling factor in the right to reach the recommended die clearance.D-16
Figure 16 highlights the effect of cutting clearance on CP1200, and reinforces that the historical rule-of-thumb guidance of 10% clearance does not apply for all grades. In this studyU-3, increasing the clearance from 10% to 15% led to a significant improvement in hole expansion. The HER resulting from a 20% clearance was substantially better than that from a 10% clearance, but not as good as achieved with a 15% clearance. These differences will not be captured when testing only to the requirements of ISO 16630, which specifies the use of 12% clearance.
Figure 16: Effect of hole punching clearance on hole expansion of Complex Phase steel grade CP1200.U-3
Cutting speed influences the cut edge quality, so it also influences the optimal clearance for a given grade. In a study published in 2020G-49, higher speeds resulted in better sheared edge ductility for all parameters evaluated, with those edges having minimal rollover height, smoother sheared surface and negligible burr. Two grades were evaluated: a dual phase steel with 780MPa minimum tensile strength and a 3rd Generation steel with 980 MPa minimum tensile strength.
Metallurgical characteristics of the sheet steel grade also affects hole expansion capabilities. Figure 17 compares the HER of DP780 from six global suppliers. Of course, the machined edge shows the highest HER due to the minimally work-hardened edge. Holes formed with 13% clearance produced greater hole expansion ratios than those formed with 20% clearance, but the magnitude of the improvement was not consistent between the different suppliers.K-56
Figure 17: Cutting clearance affects hole expansion performance in DP780 from six global suppliers.K-56
A different studyL-79 looked at the influence of punching clearance on hole expansion of the three AHSS grades shown in Table 1.
Table 1: Tensile and Hole Expansion properties of Three AHSS Grades.L-79
Steel
Type
Thickness
mm
Yield
Strength (MPa)
Tensile
Strength (MPa)
Uniform
Elongation (%)
Elongation
A80 (%)
n-value
at UE
r-value
(at 4%)
hole expansion
ratio, punched (λ, %)
hole expansion
ratio, drilled (λ, %)
DP1000
CR700Y980T-DP-UC
0.8
735
1,074
7.5
10.5
0.073
0.94
37
48
CP1000HD
CR780Y980T-CH-UC
1.5
909
1,062
7.1
10.7
0.068
0.96
86
126
CP1200
CR900Y1180T-CP-GI50/50
1.5
1,079
1,215
5.1
8.3
0.049
0.92
67
137
Transverse orientation, A80 ISO II samples.
Testing was done to the ISO 16630 test procedure, aside from the cutting clearance or the drilled reference condition. Consistent with other studies, a 10% punch-to-die clearance does not produce the best hole expansion performance. The optimal level appears to be at approximately 15% clearance (Figure 18). In this study, burr-free holes were punched until clearance exceeded approximately 25%.
Figure 18: Hole expansion as a function of cutting clearance or drilled holes for three AHSS grades.L-79
Punch Face Design
Practitioners in the field typically do not cut perpendicular to the sheet surface – angled punches and blades are known to reduce cutting forces. For example, long shear blades might have a 2 to 3 degree angle on them to minimize peak tonnages. There are additional benefits to altering the punch profile and impacting angle.
Snap-though or reverse tonnage results in stresses which may damage tooling, dies, and presses. Tools may crack from fatigue. Perhaps counter to conventional thinking, use of a coated punch increases blanking and punching forces. The coating leads to lower friction between the punch and the sheet surface, which makes crack initiation more difficult without using higher forces.
Unlike a coated tool, a chamfered punch surface reduces blanking and punching forces. Figure 19 compares the forces to punch a 5 mm diameter hole in 1 mm thick MS-1400T using different punch shapes. A chamfered punch was the most effective in reducing both the punching force requirements and the snap-through tonnage (the shock waves and negative tonnage readings in Figure 19). The chamfer should be large enough to initiate the cut before the entire punch face is in contact with the sheet surface. A larger chamfer increases the risk of plastic deformation of the punch tip.T-20
Figure 19: A chamfered punch reduces peak loads and snap-through tonnage.K-15
A different study P-16 showed more dramatic benefits. Use of a rooftop punch resulted in up to an 80% reduction in punching force requirements compared with a flat punch, with a significant reduction in snap-through tonnage. Cutting clearance had only minimal effect on the results. (Figure 20)
Figure 20: A rooftop-shaped punch leads to dramatic reductions in punch load requirements and snap-through tonnage.P-16
Use of a beveled punch (Figure 21) provides similar benefits. A study S-52 comparing DP 500/780 and DP 550/980 showed a reduction in the maximum piercing force of more than 50% with the use of a beveling angle between 3 and 6 degrees. The shearing force depends also upon the die clearance during punching, with the optimum performance seen with 17% die clearance. The optimal punching condition results in more than 60% improvement in the hole expansion ratio when compared to conventional flat head punching process. The optimal bevel cut edge in Figure 22 shows a uniform burnish zone with a uniform transition to the smooth fracture zone – the known conditions to produce a high-ductility edge.
Figure 22: A bevel cut edge showing uniform burnish zone with a uniform transition to the smooth fracture zone.S-52
The effect of convex and concave punch geometries are likely a function of the chosen dimensions, the tool material, and the sheet metal being punched. Citation L-XX studied a convex roof top punch shape that is flat in the bottom middle with a 17° angle on both sides and a concave bottom punch shape that is flat on the outer regions with a 5 mm radius hollow shape in the center. The hole expansion response to these punch conditions in the three steels documented in Table 1 above is shown in Figure 23.
Figure 23: ISO 16630 HER ratio vs. cutting tool geometry (orthogonal, concave, convex).L-79
Figure 24 shows the punched edge of the CP1000HD steel, highlighting the variability in edge condition associated with the convex and concave punches. Here, the amount of rollover and burnish varied around the perimeter of the punched hole. The notch stress concentration level in the hollow concave configuration at the transition between flat and curved punch regions leads to punch tool wear, resulting in early chipping after only 22 strokes.
Figure 24. Cut edge morphology as a function of cutting tool geometry when punching CP1000HD.L-79
Effect of Edge Preparation Method on Ductility
A flat trim condition where the upper blade and lower blade motions are parallel and there is no shear rake angle is known to produce a trimmed edge with limited edge stretchability (Figure 25, left image). In addition to split parts, tooling damage and unexpected down time results. Metal stampers have known that shearing with a rake angle Figure 25, right image) will reduce cutting forces compared with using a flat cut. With advanced high strength steels, there is an accompanying reduction in forming energy requirements of up to 20% depending on the conditions, which represents a tremendous drop in snap-through or reverse tonnage. Figure 25 visually describes the upper and lower blade rake angles and the shear rake angle.
Figure 25: Flat trim (left) and shear trim (right) conditions showing rake angle definitions.S-53
Researchers have also found that it is possible to increase sheared edge ductility with optimized rake angles. CitationS-53used 2-D Edge Tension Testingand the Half-Specimen Dome Testto qualify the effects of these rake angles, and determine the optimum settings. After preparing the trimmed edge with the targeted conditions, the samples were pulled in a tensile test or deformed using a hemispherical punch. The effect of the trimming conditions was seen in the measured elongation values and the strain at failure, respectively. The results are summarized in Figures 26-28. Some of the tests also evaluated milled, laser trimmed, and water jet cut samples. Shear Trim 1, 2, and 3 refer to the shear trim angle in degrees. The optimized shear condition also includes a 6-degree rake angle on both the upper and lower blades, as defined in Figure 25.
Conclusions from this study include:
Mechanically shearing the edge cold works the steel and reduces the work hardening exponent (n-value), leading to less edge stretchability.
Samples prepared with processes that avoided cold working the edges, like laser or water jet cutting outperformed mechanically sheared edges.
Optimizing the trim shear conditions or polishing a flat trimmed edge approaches what can be achieved with laser trimming and water jet cutting.
Shearing parameters such as clearance, shear angle and rake angle also play a large part in improving edge stretch.
Figure 26: Effect of edge preparation on stretchability as determined using a tensile test for DP 350Y600T (left) and DP 550Y980T (right).S-53
Figure 27: Effect of edge preparation on stretchability as determined using a dome test for DP 350Y600T (left) and DP 550Y980T (right).S-53
Figure 28: Optimizing the trim shear conditions or polishing a flat trimmed edge approaches what is achievable with laser trimming and water jet cutting. Data from dome testing of DP 350Y/600T.S-53
The optimal edge will have no mechanical damage and no microstructural changes as you go further from the edge. Any process that changes the edge quality from the bulk material can influence performance. This includes the mechanical damage from shearing operations, which cold works the edge leading to a reduction in ductility. Laser cutting also changes the edge microstructure, since the associated heat input is sufficient to alter the engineered balance of phases which give AHSS grades their unique properties. However, the heat from laser cutting is sometimes advantageous, such as in the creation of locally softened zones to improve cut edge ductility in some applications of press hardening steels.
The effects of edge preparation on the shear affected zoneis presented in Figure 29. A flatter profile of the Vickers microhardness reading measured from the as-produced edge into the material indicates the least work-hardening and mechanical damage resulting from the edge preparation method, and therefore should result in the greatest edge ductility. This is certainly the case for water jet cutting, where a flat hardness profile in Figure 29correlates with the highest ductility measurements in Figures 25 to 28. Unfortunately, water jet cutting is not always practical, and introduces the risk of rust forming at the newly cut edge.
Figure 29: Microhardness profile starting at cut edge generated using different methods. Left image is from Citation S-53, and right image is from C-13.
Two-stage piercing is another method to reduce edge strain hardening effects. Here, a conventional piercing operation is followed by a shaving operation which removes the work-hardened material created in the first step, as illustrated in Figure 30.P-17 A related studyF-10evaluated this method with a 4 mm thick complex phase steel with 800 MPa tensile strength. Using the configuration documented in this reference, single-stage shearing resulted in a hole expansion ratio of only 5%, where the addition of the shaving operation improved the hole expansion ratio to 40%.
Figure 31 highlights the benefits of two-stage pre-piercing for specific grades, showing a 2x to 4x improvement in hole expansion ratio for the grades presented.
Figure 31: Pre-piercing improves the hole expansion ratio of AHSS Grades.S-10
Confirmation of the benefits of pre-piercing is seen in another study that centered on a 780 MPa grade hot rolled steel.U-16 This work compared conventional single punching, double punching, and use of a humped punch. The set-up used in this evaluation is summarized in Figure 32.
Figure 32: Set-up conditions for Single Punch (SPM), Double Punch (DPM), and Humped Punch Methods.U-16
The conventional single punch method was used to expand a 30 mm diameter hole, and the grade studied showed a hole expansion ratio (λ) of 80%. Both the double punch method and the humped punch approach using the dimensions of condition C from Figure 32 produced a λ of between 105% and 110%, for an improvement ratio (λ/λSPM) on the order of 35% of the conventional method. The relative lengths of the rollover, burnished, and fracture zones of the cut edges were measured, but no trend of hole expansion performance against these dimensions were observed.
The influence of the initial hole size was also studied, using a 10 mm diameter hole that is consistent with the requirements of ISO 16630. Here, the DPM approach produced an improvement ratio (λ/λSPM) of more than 55% of the value obtained from the conventional punching method. One of the HPM conditions (narrow punch, deeper penetration) resulted in an improvement ratio close to 35%. Similar to the larger diameter holes, there did not appear to be a correlation between the dimensions of the cut edge zones and hole expansion.
For the pre-piercing Double Punch Method, the improved hole expansion was attributed to the large deformation on the scrap side and depressing plastic strain in the punched edge. For the Humped Punch Method, the improvement was attributed to the increased stress triaxiality of the blank by the humped part and a reduced work hardening owing to the mechanics of the punching operation.
For at least the larger diameter hole, the Humped Punch Method saw the same improvement as the Double Punch Method, but with fewer manufacturing steps.
Furthermore, shaving, or pre-piercing, was also shown to be beneficial on 1.6 mm steel with 1280 MPa tensile strength.Y-16 Using that technique, the hole expansion ratio was approximately three times that measured in the conventionally prepared hole pierced with a 10% metal thickness clearance. This led to a substantial reduction in residual stresses on the cut edge, which in turn dramatically improves resistance to hydrogen embrittlement and delayed cracking.
Creating a Visual Guide for Shear Face Assessment (based on Citation S-118)
With conventional grades, monitoring burr height and ensuring that it remains less than 10% of the sheet thickness is the primary action that most companies take to minimize the risk of cracks coming from edge stretching.
For advanced grades, the importance of burr height decreases. In these steels, both the hardness uniformity of microstructural components as well as the uniformity of the manufactured edge influence the degree to which an edge can be expanded before fracturing.
Quantifying visual uniformity is, of course, challenging. Citation S-118 shows the steps involved in creating a visual matrix of edge quality, with the highlights presented below. This content is intended for general information only. No license under any patents or other proprietary interests is implied by this content. Those making use of or relying upon the material assume all risks and liability arising from such use or reliance.
Creating a Visual Reference
Different tests can be done to characterize edge expandability. The sheared edge tension (SET) test focuses on two-dimensional (2D) deformation, and the half specimen dome test (HSDT) characterizes three-dimensional (3D) deformation. Although the HSDT may be a better representation of reality, there is greater access to tensile testing machines for SET testing. For this reason, the discussion below centers on SET testing only.
The first step is to create edges with different visual characteristics. In production slitting this can be accomplished by varying the vertical and horizontal clearances between slitter knives. In a laboratory environment, the shear rake angle and the cutting clearance can be varied.
Next, samples for tensile testing are produced. The SET test sample can be either a rectangle with both long edges sheared under the conditions of interest, or have one side sheared with the other side milled to half of a conventional dogbone sample (Figure 33). Half-dogbone samples may be preferred, since the central section of reduced width promotes failure in the monitored gauge region.
Figure 33: Sheared Edge Tension Test Samples. Bottom configuration promotes failure in the gauge region.
Create test coupons under conditions that represent the extremes of what will be encountered in production as well as many variants of the conditions falling within these extremes. Create an additional sample where both edges are milled to a conventional dogbone shape. The elongation from this sample represents the reference condition showing what is achievable with an optimum edge. All other sheared samples are considered relative to this value.
For each sheared condition, measure the decrease relative to the value from the milled condition. Rank these and group them into practical categories as the data suggests. For example: Reduction of elongation up to 10% relative to the milled condition, Reduction of elongation between 10% and 20% relative to the milled condition, Reduction of elongation more than 20% relative to the milled condition. The production or laboratory conditions that produced each of these results are known, and those conditions falling into that first category are better than those conditions that result in the third category.
The final step is to take the samples and photograph the edges. Group these photographs into the same categories as before to create a visual representation that can distinguish a good edge from a less than ideal one. Monitor edge quality during production. If the visual appearance veers away from that associated with the desired Group 1, then adjust the shearing conditions like clearance and alignment back to the nominal conditions as documented to create the Group 1 edges.
Case Study: Creating a Visual Guide for Shear Face Assessment (based on Citation S-118)
Using the framework described above, 23 different combinations of production shearing conditions were evaluated, and Sheared Edge Tensile samples were used to determine the elongation to fracture. A milled dogbone sample was used as reference. The results were ranked, and displayed in Figure 34. Additional testing found that results from mechanically shearing were the same as the trends from production shearing shown in Figure 35.
Figure 34: Total Elongation Measured in Sheared Edge Tension Test At Different Slitting Conditions. (Citation S-118)
Reduction in edge stretchability was determined as the difference in ductility between the sheared edge produced under many different cutting conditions and the optimal milled edge. These results were grouped into five categories, with Level 1 being the closest to the elongation from milled edges and Level 5 representing the most dramatic decrease in elongation.
A macro-photograph of the shear face was taken from cutting condition to aid in distinguishing between the resultant features, and grouped into the five categories of edge stretchability reduction. This collection of images is presented in Figure 35.
Figure 35: Shear Face Edge Condition Guideline for Edge Stretchability (Citation S-118)
Although these pictures cannot fully cover all types of appearance among all cutting conditions, this approach provides the basis for creating a visual guideline that production locations can use to assess the potential stretchability of the edges that are being produced with the existing set-up. Should edge quality appearance not match the target, then plant personnel must take appropriate actions to avoid edge cracking.
Key Points
Clearances for punching, blanking, and shearing should increase as the strength of the material increases, but only up to a point. At the highest strengths, reducing clearance improves tool chipping risk.
Lower punch/die clearances lead to accelerated tool wear. Higher punch/die clearances generate more rollover/burr.
ISO 16630, the global specification for hole expansion testing, specifies the use of 12% punch-to-die clearance. Optimized clearance varies by grade, so additional testing may prove insightful.
Recommended clearance as a percentage of sheet thickness increases with thickness, even at the same strength level.
Burr height increases with tool wear and increasing die clearances for shearing mild steel, but AHSS tends to maintain a constant burr height. This means extended intervals between tool sharpening may be possible with AHSS parts, providing edge quality and edge performance remain acceptable.
Edge preparation methods like milling, laser trimming, and water-jet cutting minimize cold working at the edges, resulting in the greatest edge ductility,
Laser cut blanks used during early tool tryout may not represent normal blanking, shearing, and punching quality, resulting in edge ductility that will not occur in production. Using production-intent tooling as early as possible in the development stage minimizes this risk.
Shear or bevel on punches and trim steel reduces punch forces, minimizes snap-through reverse tonnage, and improves edge ductility.
Mild steel punched with conventional tools and AHSS grades punched with surface treated engineered PM tool steels experience comparable wear.
Maintenance of key process variables, such as clearance and tool condition, is critical to achieving long-term edge stretchability.
The optimal edge appearance shows a uniform burnish zone with a uniform transition to a smooth fracture zone.
Thanks are given to Hua-Chu (Michael) Shih, Senior Research Engineer, United States Steel Corporation, for his contributions to the Shear Face Assessment section. Hua-Chu Shih is responsible for developing technical solutions for automotive applications, utilizing the advanced high strength steel portfolio of U.S. Steel and research in the areas of formability, processing, fracture in forming AHSS, die wear, coating adhesion, Tribology and dent resistance. He earned his Ph.D. and M.S. degree in Mechanical Engineering at Northwestern University.
The initial press hardening steels of the 1970s were delivered bare, without a galvanized or aluminized layer for corrosion protection (i.e., uncoated). During the heating process, an oxide layer of FeOx forms if the furnace atmosphere is not controlled. Through the years, several coating technologies have been developed to solve the following problems of uncoated steels:F-14, F-33
Scale formation, which causes abrasive wear and requires a secondary shotblasting process before welding,
Decarburization, which leads to softening close to the surface,
Risk of corrosion.
The first commercially available coating on press hardening steels was patented in 1998. The coating was designed to solve the scaling problem, but it also offered some corrosion resistance.C-24 Since the coating composition is primarily aluminium, with approximately 9% silicon, it is usually referred to as AlSi, Al-Si, or AS.
Coating thickness is nominally 25 μm (75 g/m2) on each side and referenced as AS150. A more recent offering is a thinner coating of approximately 13 μm, and is referenced as AS80.A-51 The AS coating requires a special heating curve and soaking time for better weldability, corrosion resistance and running health of the furnace. Most OEMs now include furnace dew point limitations to reduce/avoid hydrogen embrittlement risk.
In 2005, Volkswagen was looking for a method to manufacture deep drawn transmission tunnels and other complex-to-form underbody components using press hardened steels. Although AS coatings were available, parts could not be formed to the full draw depth using the direct process, and the coating on the AS coated blanks cracked during the cold forming portion of the two-step hybrid process. Using uncoated blanks led to severe scale formation, which increased the friction coefficient in hot forming. For this particular problem, a varnish coating was developed. The coating was applied at a steel mill, and shipped to Volkswagen’s stamping plant. The varnish coated blanks were first cold pre-formed and then heated in a furnace, as seen in Figure 1a. Hot pre-forms were then deep drawn to full depth tunnels. As shown in Figure 1b, scale formed on parts which did not have the coating. A varnish coated blank could be cold formed first without crack formation in the coating, and then hot formed without any scale, Figure 1c.S-63, F-34 Since then, some other varnish coatings also have been developed.
Figure 1: Transmission tunnel of 6th generation Volkswagen Passat (2005-2014): (a) hot forming of pre-form, and final parts: (a) uncoated blank would suffer from scaling, (c) scale-free parts can be formed from varnish-coated blanks.F-34
In car bodies, components that are sealed from external moisture are referred to as dry areas. These areas have low risk of corrosion. Areas that may be exposed to moisture are wet areas. Precautions must be taken to avoid corrosion of the sheet metal, such as using galvanized or pre-coated steel. Sealants can also be applied to joints to keep out moisture. The presence of humidity in these areas increases the risk of forming a galvanic cell, leading to accelerated corrosion. These areas have higher risk of corrosion and may require additional measures. Figure 2 shows dry and wet areas. In this figure, parts colored with yellow may be classified as wet or dry, depending on the vehicle design and the OEMs requirements.G-41
Figure 2: Dry and wet areas in a car body. (re-created after G-41)
An estimated ~40% of press hardened components are in dry areas. Thus, high corrosion protection is desired in the 60% of all press hardened components which are employed in wet areas.B-48 Zn-based coatings are favored for their cathodic protection, but require tight process control. The first commercial use of Zn-coated PHS was in 2008, using the indirect process.P-20 Since then, direct forming of Zn-coated PHS has been studied. When direct formed, furnace soaking temperature and time must be controlled carefully to avoid deep microcracks.G-41, K-20 Recently developed are two new Zn-coated press hardening steel grades, 20MnB8 and 22MnSiB9-5, both reaching approximately 1500 MPa tensile strength after processing. Using these grades requires a pre-cooling process after the furnace to solidify the Zn-based coating. 20MnB8 can be direct hot formed after pre-cooling, whereas 22MnSiB9-5 can be formed in a transfer press in the “multi-step” process.K-21, H-27
Depending on the coating type and thickness, the process type, controls and investment requirements may change significantly. For example, some press hardening lines may be designed to form blanks with only Al-based coatings. Table 1 summarizes the advantages and disadvantages of several coating systems.
Table 1: Summary of Coatings Available for PHS.
Coating Type
Advantages
Disadvantages
Uncoated
Lower cost
No corrosion protection
Scale forms during press hardening (shotblasting)
Surface decarburization (reduces strength)
Al-Based
No scale formation
No decarburization
Barrier corrosion protection from surface Al2O3 oxide layer
Weldable without sand blasting (oxide layer is thin enough)
No cathodic protection
Limited to direct process
High maintenance cost in roller hearth furnaces (coating sticks to rollers)
Only for direct process (cracks form if cold stamped)
Hard surface and abrasive
Zn-Based
Cathodic protection
May have lower friction coefficient
No decarburization; no scale
Cathodic corrosion protection
May require indirect or pre-cooled process
Risk of microcracks
Surface oxide slows but does not stop Zn evaporation
Liquid Zn can lead to LME and adhesion of Zn to tools
Sand blasting may be needed to remove oxide layer for welding
Varnish
Fast heating possible
Risk of microcracks
Direct, Indirect, Two-Step Hybrid, Roll-form PHS can be achieved
Applied at stamping facility
May require sandblasting for weldability
Uncoated Blanks
The earliest press hardening steels did not have any coating on them. These steels are still available and may be preferred for dry areas in automotive applications. If the steel is uncoated and the furnace atmosphere is not controlled, scale formation is unavoidable. Scale is the term for iron oxides which form due to high temperature oxidation. Scale thickness increases as the time in furnace gets longer, as seen in Figure 3. Scale has to be removed before welding, requiring a shotblasting stage. Thicker scale is more difficult and more costly to remove.M-53 Early attempts to reduce (if not avoid) scale formation saw the use of an inert-gas atmosphere inside the furnace.A-52 Today, a mixture of nitrogen (N2) and natural gas (CH4) is typically used.F-35 In China, at least one tier supplier is using a vacuum furnace to prevent scale formation.A-68
Figure 3: Oxide layer (scale) on press hardened steel after: (a) fast resistance heating (10 seconds in air), (b) furnace heating (120 seconds in air).M-53
While heating uncoated steel in the furnace, if the conditions are favorable for iron (Fe) oxidation, carbon (C) may also be oxidized. When the carbon is oxidized, layers close to the surface lose their carbon content as gaseous carbon monoxide (CO) and/or carbon dioxide (CO2) is produced.S-87 The depth of the “decarburization layer” increases with dwell time in the furnace, until an oxide layer (scale) formed. Scale acts as a barrier between the bare steel and atmosphere. As the carbon is depleted in the “decarburization layer”, the hardness of the layer is decreased, as seen in Figure 4. Decarburization is usually undesirable since it lowers the strength/hardness and may negatively affect fatigue life.C-26
Figure 4: Hardness distribution of an uncoated steel after 6 minutes in a 900 °C furnace, showing hardness decrease as the surface layers lose their carbon. (Re-created after C-26.
Several methods are available to improve the corrosion resistance of uncoated PHS parts:
E-coating after welding, before painting is a typical step of car body manufacturing, for rustproofing.
If descaling can be done by using chromium shots (in shotblasting), a thin film of chromium-iron may grow on the surface and improve the corrosion resistance.F-14
Vapor galvanizing (also known as Sherardizing) of uncoated steel after descaling, an experimental study described in Citation G-42.
Electro-galvanizing after hot stamping, as described in Citation A-68.
Change the base metal chemistry to one that is more oxidation resistant.L-60 Figure 5 compares the shiny non-oxidized surface appearance of parts made from this grade with that made from a conventional uncoated press hardening grade on the same production line with the same processing conditions.W-28
Figure 5: Oxidation resistant PHS grades may not need descaling or coatings for sufficient corrosion resistance. (re-created after W-28).
Aluminium-Based Coatings
The first commercially available coating on press hardening steels was patented by Sollac (now part of ArcelorMittal) in 1998. This coating was designed to address the scaling problem, but also offers some barrier corrosion resistance.C-24 The nominal coating composition is 9-10 wt.% Si, 2-4 wt.% Fe, with the balance Al.L-39 The coating may be referred to as AlSi, Al-Si, AluSi or more commonly AS. Nominal as-delivered coating thickness is 25 μm (approximately 75 g/m2) on each side, and is usually referred to as AS150, with 150 referencing the total coating weight combining both sides, expressed as g/m2. More recently, a thinner coating of 13 μm (30-40 g/m2 on each side, AS60 or AS80) is now commercially available.A-51 When AS coated blanks are “tailor rolled,” the coating thickness is also reduced in a similar percentage of the base metal thickness reduction. Corrosion protection is similarly reduced, and furnace parameters need to be adjusted accordingly.
As delivered, AS150 has a coating thickness of 20-33 μm and a hardness of approximately 60 HV. The “interdiffusion layer” (abbreviated as IDL) has a high hardness and low toughness at delivery, as seen in Figure 6a. Due to the brittle nature of the IDL, AS coated blanks cannot be cold formed unless very special precautions are taken. During heating, iron from the base metal diffuses to the coating forming very hard AlSiFe (or AlFe) layers close to surface. At the same time, Al and Si of the coating diffuse to the IDL, growing it in thickness and reducing its hardness, Figure 6b. Earlier studies have shown that heating time (and also furnace temperature) has direct effect on the final thickness of IDL, as shown in Figure 7. Once the IDL thickness surpasses approximately 16 to 17 μm, the welding current range (ΔI = Iexpulsion – Imin) may be well below 2 kA.V-15, V-21, W-34 The dwell time must be long enough to ensure proper surface roughness (see Figure 6b) for e-coatability.M-27, T-40Figure 10 summarizes the heating process window of AS coatings. The process window may change with base metal and coating thicknesses.
Figure 6: AS coating micrographs: (a) as-delivered, (b) after hot stamping process (re-created after V-15, V-21, W-34, G-32)
Figure 7: IDL thickness variation with furnace dwell time (Image created by B-55 using raw data from V-21, G-32, K-41.)
Hydrogen induced cracking (HIC, also known as hydrogen embrittlement) has been a major problem for steels over 1500 MPa tensile strength. AS coated steels may have higher diffusible hydrogen, when delivered, due to the aluminizing process occurring at 680 °C. In addition, AS coated grades may have a hydrogen absorption rate up to three times higher during heating.C-27 To reduce the hydrogen diffusion, it is essential to control the heating process (both heating rate and dew point in the furnace). AS coated blanks absorb hydrogen at room temperature; however, this happens at much lower rates than uncoated or Zn-coated blanks.J-21 Diffusible hydrogen can be removed from the press hardened part by re-heating the part to around 200 °C for 20 minutes or longer, in a process called de-embrittlement.V-21, G-32, G-43,J-21
For the abovementioned reasons, AS coated higher strength grades (i.e., PHS1800 and over) are required to have precise “dew point regulations” during the heating in furnace. Their final properties, especially elongation and bending angle, may be guaranteed only after paint baking, as shown in Figure 8.B-32 Paint baking is standardized in Europe as a treatment for 20 minutes at 170 °C, which may act like a de-embrittlement treatment.E-10Some OEMs also require dew point control and “subsequent de-embrittlement treatment” for AS coated PHS1500. This is typically done by the tier supplier, before the paint baking process.
Figure 8: Effect of diffusible hydrogen (Hdiff) on mechanical properties of: (a) uncoated PHS2000, (b) AS coated PHS2000 in an uncontrolled furnace atmosphere (re-created using raw data from C-27).
Another method to reduce the risk of hydrogen embrittlement is to adjust the coating composition. The bath chemistry for a standard AS coating consists of up to 90% aluminium, about 8% to 11% silicon and a maximum of 4% iron. Adding a maximum of 0.5% alkaline earth metals, like magnesium, for example has been shown to result in 40% less hydrogen diffusion into steel.R-29,T-45
Although not common in the industry, Al-Zn and Zn-Al-Mg based coatings have also been developed for press hardening processes.F-14 Recently introduced is an aluminium-silicon coating with magnesium additions. When oxidized with water vapor, Mg releases less H2 and thus may reduce the diffusible hydrogen.S-88
AS coatings may cause costly maintenance issues in roller hearth furnaces, as the coating may contaminate the rollers.B-14 Special care has to be taken to avoid the issue or prolong the maintenance intervals.
Zinc-Based Coatings
AS coatings provide some corrosion protection, known as “barrier protection”, as the coating forms a barrier between the oxidizing environment and the bare steel. It is quite common in Europe for a car to have 12 years corrosion protection warranty. To achieve such corrosion resistance, a typical car may have over 85% of its components galvanized.S-89
The use of Zn-coated PHS has been relatively low, compared to AS coated and uncoated grades. In 2015, 76% of the PHS sold in EU27+Turkey was AS coated. In these markets, 18% of the PHS sold was uncoated and only 6% was Zn coated.D-20 This can be attributed to the susceptibility of Zn-coated PHS to Liquid Metal Embrittlement (LME, also known as Liquid Metal Assisted Cracks (LMAC) and Liquid Metal Induced Embrittlement (LMIE)).C-28, L-46
After heating and soaking in the furnace, the base metal should be in the austenitic phase. During heating, the Zn coating reacts with the base metal and forms a thin solid layer of body-centered-cubic solid solution of Zn in α-Fe, shown as α-Fe(Zn) in Figure 9. During deformation, a microcrack can be initiated in this layer at the grain boundaries of the austenite in the base metal, as indicated in Figure 9a. As the crack propagates, zinc from the α-Fe(Zn) layer diffuses along the austenite grain boundary and combines with iron from the base steel to form additional α-Fe(Zn), Figure 9b. Cracks propagate through the weak a-Fe(Zn) grain boundary layer, allowing liquid zinc (with diffused iron) to advance into the capillary crack (Figure 9c). After quenching, the base metal transforms to martensite and the liquid Zn transforms to a hard and brittle intermetallic phase, Γ-Fe3Zn10.C-28
Figure 9: Schematic illustration of microcrack formation. (re-created based on C-28.)
In the direct forming of Zn-coated blanks, with or without pre-cooling, microcracks in the base metal may be observed. Microcracks less than 10 μm into the base metal does not affect the fatigue strength of the part.K-20 Microcrack depth is a function of coating thickness, furnace conditions (temperature and dwell time, see Figure 10), forming severity and forming temperature. It may be possible to direct form galvannealed (GA coated, ZF or ZnFe in the coating) blanks.
The boiling point of pure zinc (907 °C) is very close to the austenitization temperature of 22MnB5 (885 °C), so the heating process window of Zn-coated blanks must be controlled precisely. When the furnace dwell time is too short, deeper microcracks may be observed. When the furnace dwell time is too long, corrosion performance may be degraded. Thus, heating process window of Zn-coated blanks is significantly narrower than that of AS-coated blanks, as seen in Figure 10.B-14, S-90
Figure 10: Heating process window of AS and Zn coatings (representative data, may not be accurate for all sheet and coating thicknesses, re-created based on B-14, S-90.
Zn-based coatings may result in very low diffusible hydrogen after press hardening. In one studyJ-21, no diffusible hydrogen was detected, as long as the furnace dwell times are shorter than 6 minutes. Even after 50 minutes in the furnace, diffusible hydrogen was found to be around 0.060 ppm. Zn coatings do not act as a barrier for hydrogen desorption (losing H through the surface). Even at room temperature, Zn coated blanks may lose most of the diffusible hydrogen within a few days (also referred to as aging). See Figure 11.
Figure 11: Evolution of galvanized coating: (a) as delivered: Ferrite+Pearlite in base metal, almost pure Zn coating with Al-rich inhibition layer, (b) at high temperatures: austenite in base metal + α-Fe(Zn) and liquid Zn + surface oxides, (c) after press hardening: martensite in base metal + α-Fe(Zn) and Γ-phase coatings + surface oxides. The oxides are removed prior to welding and painting.J-21
Zn-based coatings may have a yellowish color after hot stamping. The surface oxides have to be removed before welding. This is typically done by shotblasting.
PHS blanks with a ZnNi coating were previously available. The ZnNi coating provided a low friction coefficient, a large process window in the furnace, the ability to be cold formed (indirect or two-step hybrid processes were also possible) and decreased susceptibility to LME.B-56 ZnNi coated PHS was used in the rear rail of the Opel Adam city carH-57 for a short period, until the coating was discontinued.C-29
Varnish Coatings
Another method to avoid scaling and decarburization is to apply varnish coatings, Figure 12. In this method, uncoated steel can be either coil coated or blanks can be manually coated with the paint-like varnish coatings.B-14 These coatings may also be referred to as “paint-type” or “sol-gel”.
Figure 12: Manual application of a varnish coating.F-34
Depending on the type of coating, they may allow very fast heating – including induction and conduction heating with electric current. Since the coating does not require time to diffuse, furnace heating may be completed in less than 2 minutes.F-34 Again, depending on the type, surface conditioning may not be required before welding or e-coating.B-14
They were used in automotive industry between 2005 and 2010. By 2015 there were four different types of varnish coatings, some of which are now discontinued.B-14 These coatings may be useful for prototyping and low volume production.


![Figure 12: Double door ring of Tesla Cybertruck: (a) approximate dimensions of the inner part (image re-created after [3]M-72), (b) schematic of outer ring and (c) inner ring (re-created after [4]=F-49).](https://ahssinsights.org/wp-content/uploads/2025/09/PHS-TailoredProps-Figure-12.svg)
![Figure 13: Double door ring applications: (a) GAC Aion UT (SOP 2025) [5]=G-50, (b) Lynk & Co 900 (SOP 2025) [6]=P-30.](https://ahssinsights.org/wp-content/uploads/2025/09/PHS-TailoredProps-Figure-13.svg)


![Figure 18: Sample automotive applications of patchwork PHS: B-pillar reinforcements of (a) 2007 Volvo V70 (re-crated after Citation N-4), (b) 2007 Fiat 500 (re-created after Citation Z-13); and (c) rear rail of 2015 Fiat Tipo/Egea (Citation T-43, recreated after Citation B-14); and (d) door ring of 2022 Voyah Dream (re-created after Citation [13]).H-70](https://ahssinsights.org/wp-content/uploads/2025/09/PHS-TailoredProps-Figure-18.svg)


![Figure 24: Soft zone applications to improve weld quality: (a) Mercedes EQE SUV [15]=D-47, and (b) Renault 5 BEV [14]=G-53.](https://ahssinsights.org/wp-content/uploads/2025/09/PHS-TailoredProps-Figure-24.svg)


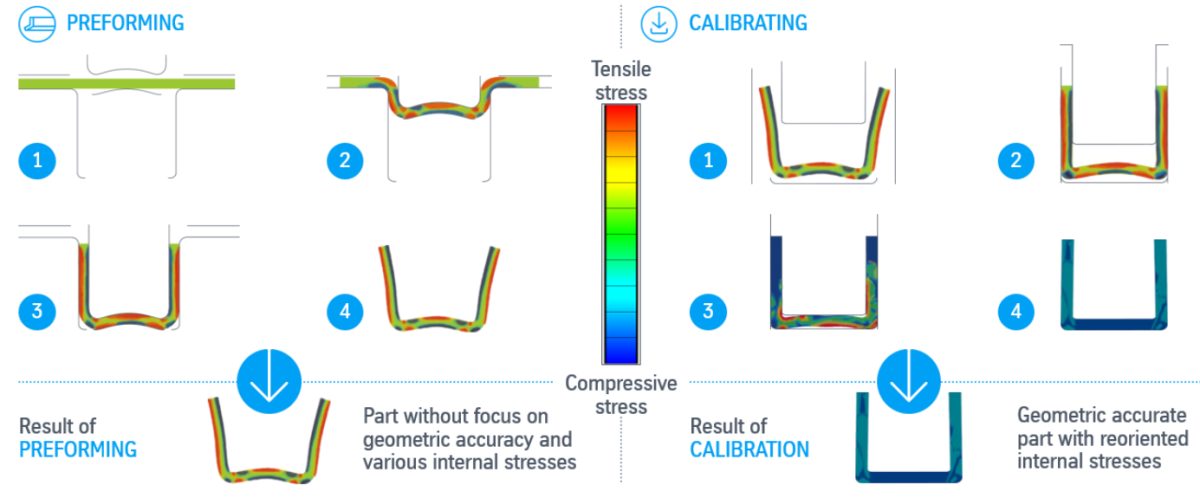
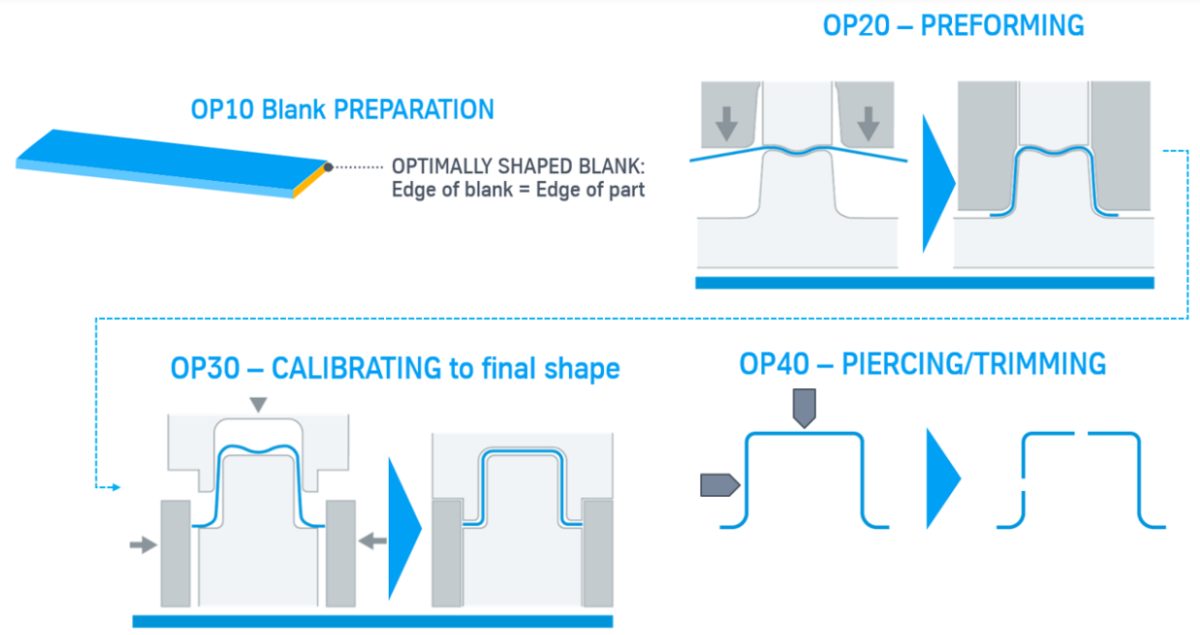

![Figure 2: Direct water quenching: (a) schematic of the nozzles [N-27], (b) blank on the lower tool before deformation [T-51].](https://ahssinsights.org/wp-content/uploads/2025/09/2-PHS-ProdMethods-Fig-2.svg)


![Figure 15: Process route of vacuum hot stamping [A-87]](https://ahssinsights.org/wp-content/uploads/2025/09/2-PHS-ProdMethods-Fig-15.svg)


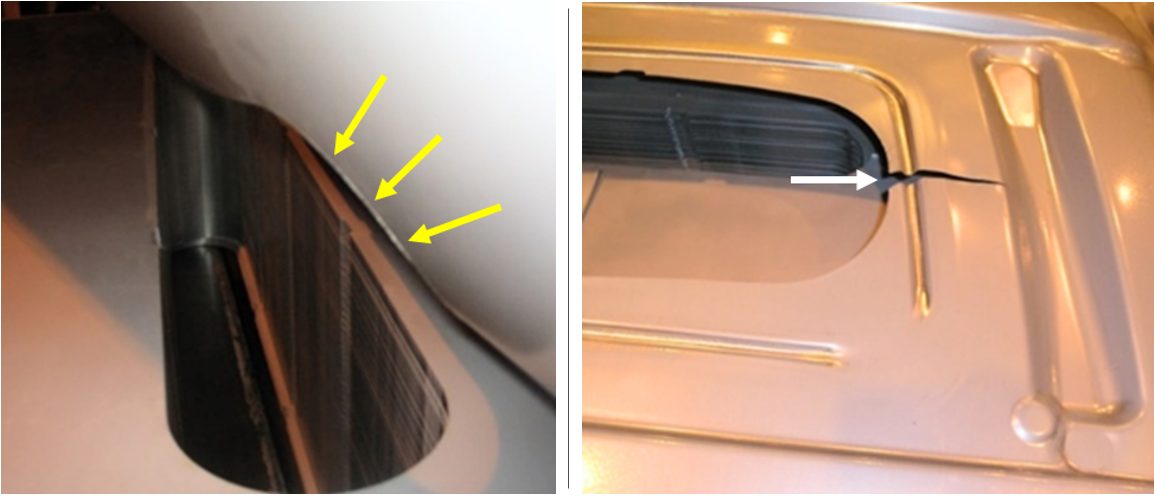


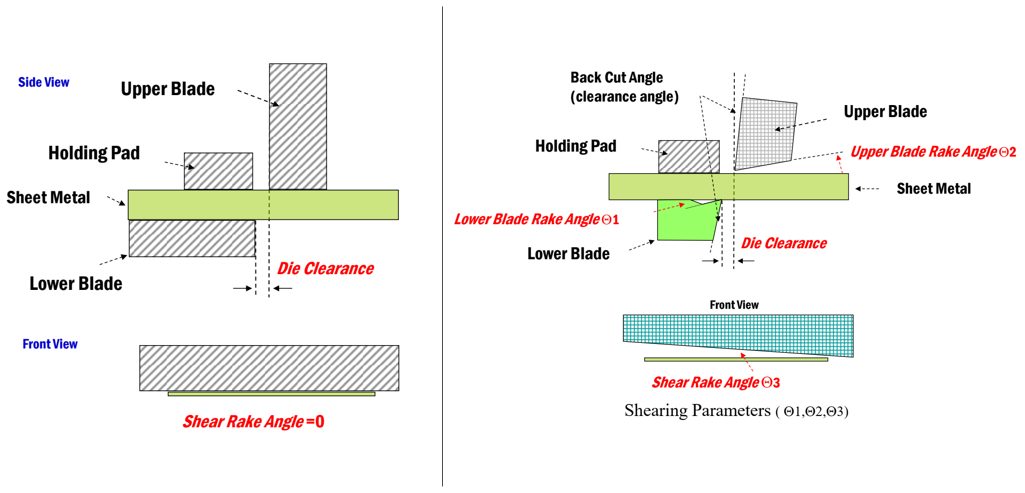


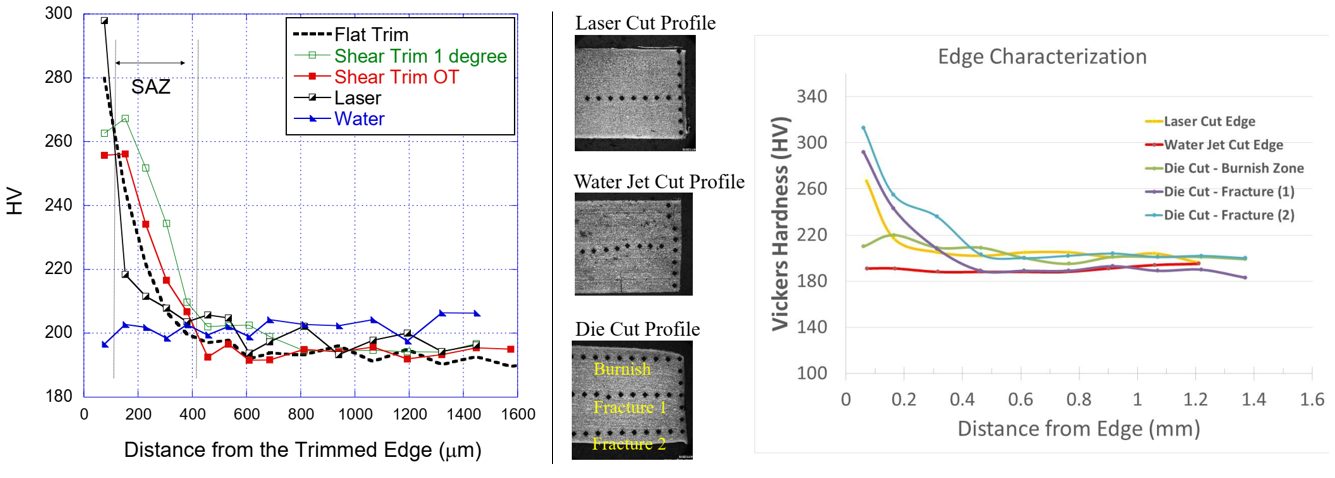


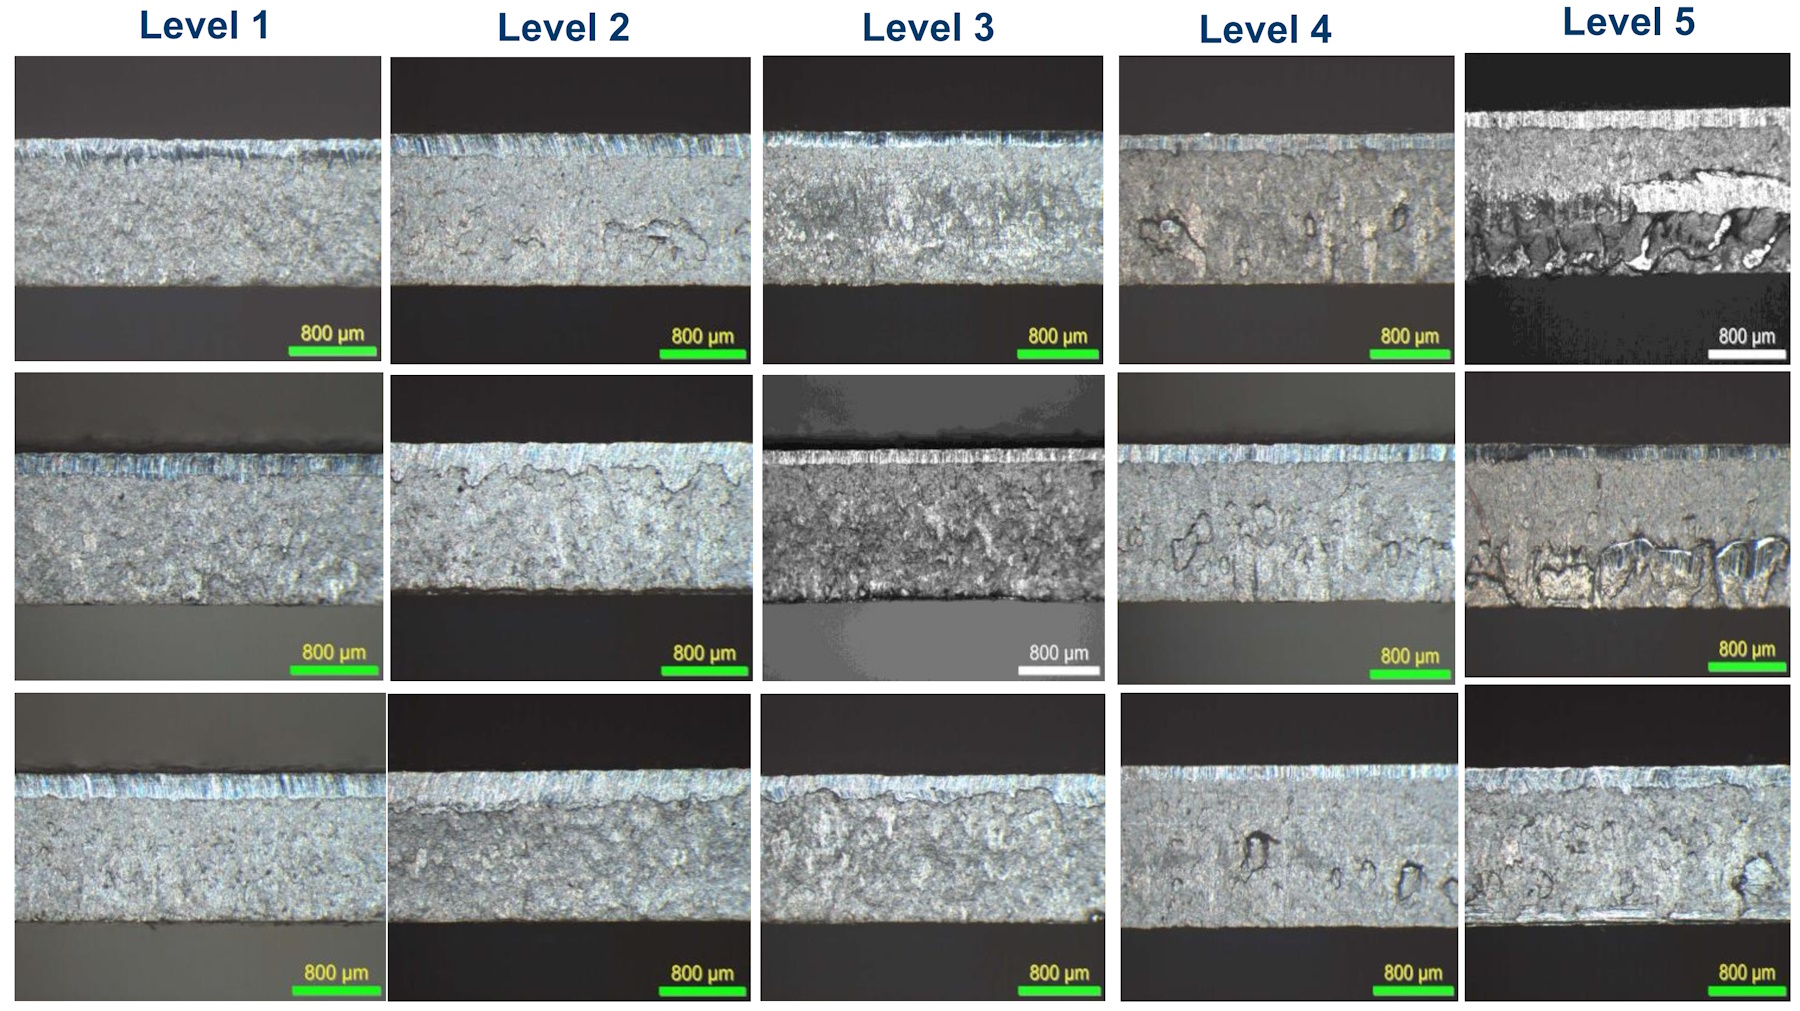
 Thanks are given to


