Blog, homepage-featured-top, Joining, Joining Dissimilar Materials, main-blog, News, Resistance Spot Welding, Resistance Welding Processes, RSW Modelling and Performance, RSW of Dissimilar Steel
This blog is a short summary of a published comprehensive research work titled: “Peculiar Roles of Nickel Diffusion in Intermetallic Compound Formation at the Dissimilar Metal Interface of Magnesium to Steel Spot Welds” Authored by Luke Walker, Carolin Fink, Colleen Hilla, Ying Lu, and Wei Zhang; Department of Materials Science and Engineering, The Ohio State University
*****
There is an increased need to join magnesium alloys to high-strength steels to create multi-material lightweight body structures for fuel-efficient vehicles. Lightweight vehicle structures are essential for not only improving the fuel economy of internal combustion engine automobiles but also increasing the driving range of electric vehicles by offsetting the weight of power systems like batteries.
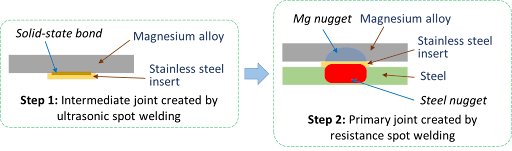
To create these structures, lightweight metals, such as magnesium (Mg) alloys, have been incorporated into vehicle designs where they are joined to high strength steels. It is desirable to produce a metallurgical bond between Mg alloys and steels using welding. However, many dissimilar metal joints form intermetallic compounds (IMCs) that are detrimental to joint ductility and strength. Ultrasonic interlayered resistance spot welding (Ulti-RSW) is a newly developed process that has been used to create strong dissimilar joints between aluminum alloys and high-strength steels. It is a two-step process where the light metal (e.g., Al or Mg alloy) is first welded to an interlayer (or insert) material by ultrasonic spot welding (USW). Ultrasonic vibration removes surface oxides and other contaminates, producing metal-to-metal contact and, consequently, a metallurgical bond between the dissimilar metals. In the second step, the insert side of the light metal is welded to steel by the standard resistance spot welding (RSW) process.
Cross-section View Schematics of Ulti-RSW Process Development
For resistance spot welding of interlayered Mg to steel, the initial schedule attempted was a simple single pulse weld schedule that was based on what was used in our previous study for Ulti-RSW of aluminum alloy to steel . However, this single pulse weld schedule was unable to create a weld between the steel sheet and the insert when joining to Mg. Two alternative schedules were then attempted; both were aimed at increasing the heat generation at the steel-insert interface. The first alternative schedule utilized two current pulses with Pulse 1, high current displacing surface coating and oxides and Pulse 2 growing the nugget. The other pulsation schedule had two equal current pulses in terms of current and welding time.
Lap shear tensile testing was used to evaluate the joint strength using the stack-up schematically, shown below. Note the images of Mg and steel sides of a weld produced by Ulti-RSW.
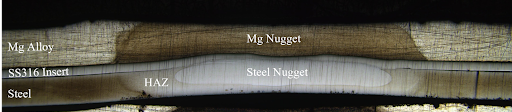
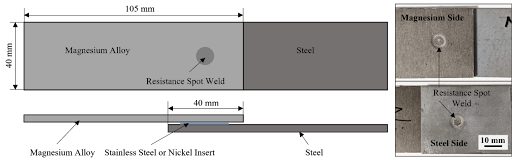 Lap Shear Tensile Test Geometry and the Resultant Weld Nuggets
An example of a welded sample showed a distinct feature of the weld that is comprised of two nuggets separated by the insert: the steel nugget formed from the melting of steel and insert and the Mg nugget brazed onto the unmelted insert. This feature is the same as that of the Al-steel weld produced by Ulti-RSW in our previous work. Although the steel nugget has a smaller diameter than the Mg nugget, it is stronger than the latter, so the failure occurred on the Mg sheet side.
Joint strength depends on several factors, including base metal strength, sheet thickness, and nugget size, making it difficult to compare how strong a weld truly is from one process to another. To better compare the dissimilar joints created by different processes, joint efficiency, a “normalized” quantity was calculated for various processes used for dissimilar joining of Mg alloys to steels in the literature, and those results, along with the efficiencies of Ulti-RSW with inserts, are shown together below. Most of the literature studies also used AZ31 as the magnesium base metal. The ones with high joint efficiency (about 53%) in the literature are resistance element welding (REW) and friction stir spot welding (FSSW). In our study, Ulti-RSW with SS316 insert was able to reach an excellent joint efficiency of 71.3%, almost 20% higher than other processes.
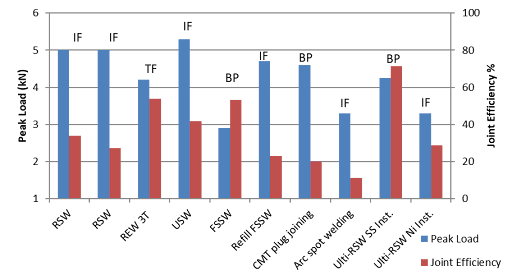 Process Evaluation and Comparison

Thanks are given to Menachem Kimchi, Associate Professor-Practice, Dept of Materials Science, Ohio State University, and Technical Editor – Joining, AHSS Application Guidelines, for this article.
Blog, homepage-featured-top, main-blog, News
WorldAutoSteel is focused on advancing steel’s advantages in the automotive, autonomous vehicle, and future mobility industries. To encourage careers in engineering, we are committed to engaging with future engineers at post-secondary education organizations around the globe. Our most recent engineering project, Steel E-Motive, was created to help the industry meet the challenges of future mobility and Level-5 autonomous vehicles and eventually reach net zero emissions targets.
We engaged Ricardo plc to collaborate with our technical directors to develop a Level 5 Autonomous Vehicle for the Steel E-Motive project. The project uncovered a few challenges that were solved by student engineering teams through Senior Capstone Projects. Here we summarize the Side Door and Door Hinges project, created at Michigan Technological University by the engineering students and faculty members listed herein.
Michigan Tech University – Senior Capstone Project #2: Adaptation of SEM2 from People Mover to Commercial Delivery Vehicle
MTU Senior Capstone Team: Kyle Davis, Nick Palatka, Evan Larson, Logan Pietila, Blake Pietila, Tej Bergin
Introduction and Background
This Senior Capstone Design Team was sponsored by WorldAutoSteel and Ricardo Engineering (UK engineering and consultancy firm) to develop a solution for expanding the serviceability within a 24-hour period for Steel E-Motive 2 (SEM2), their extra-urban electric autonomous vehicle concept.
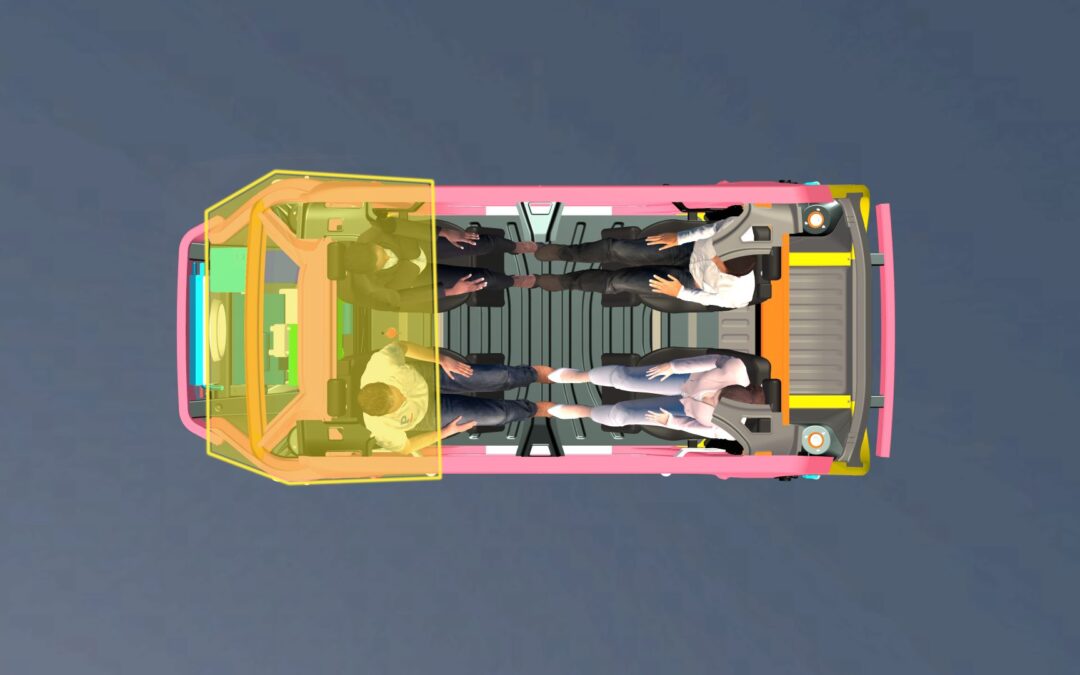
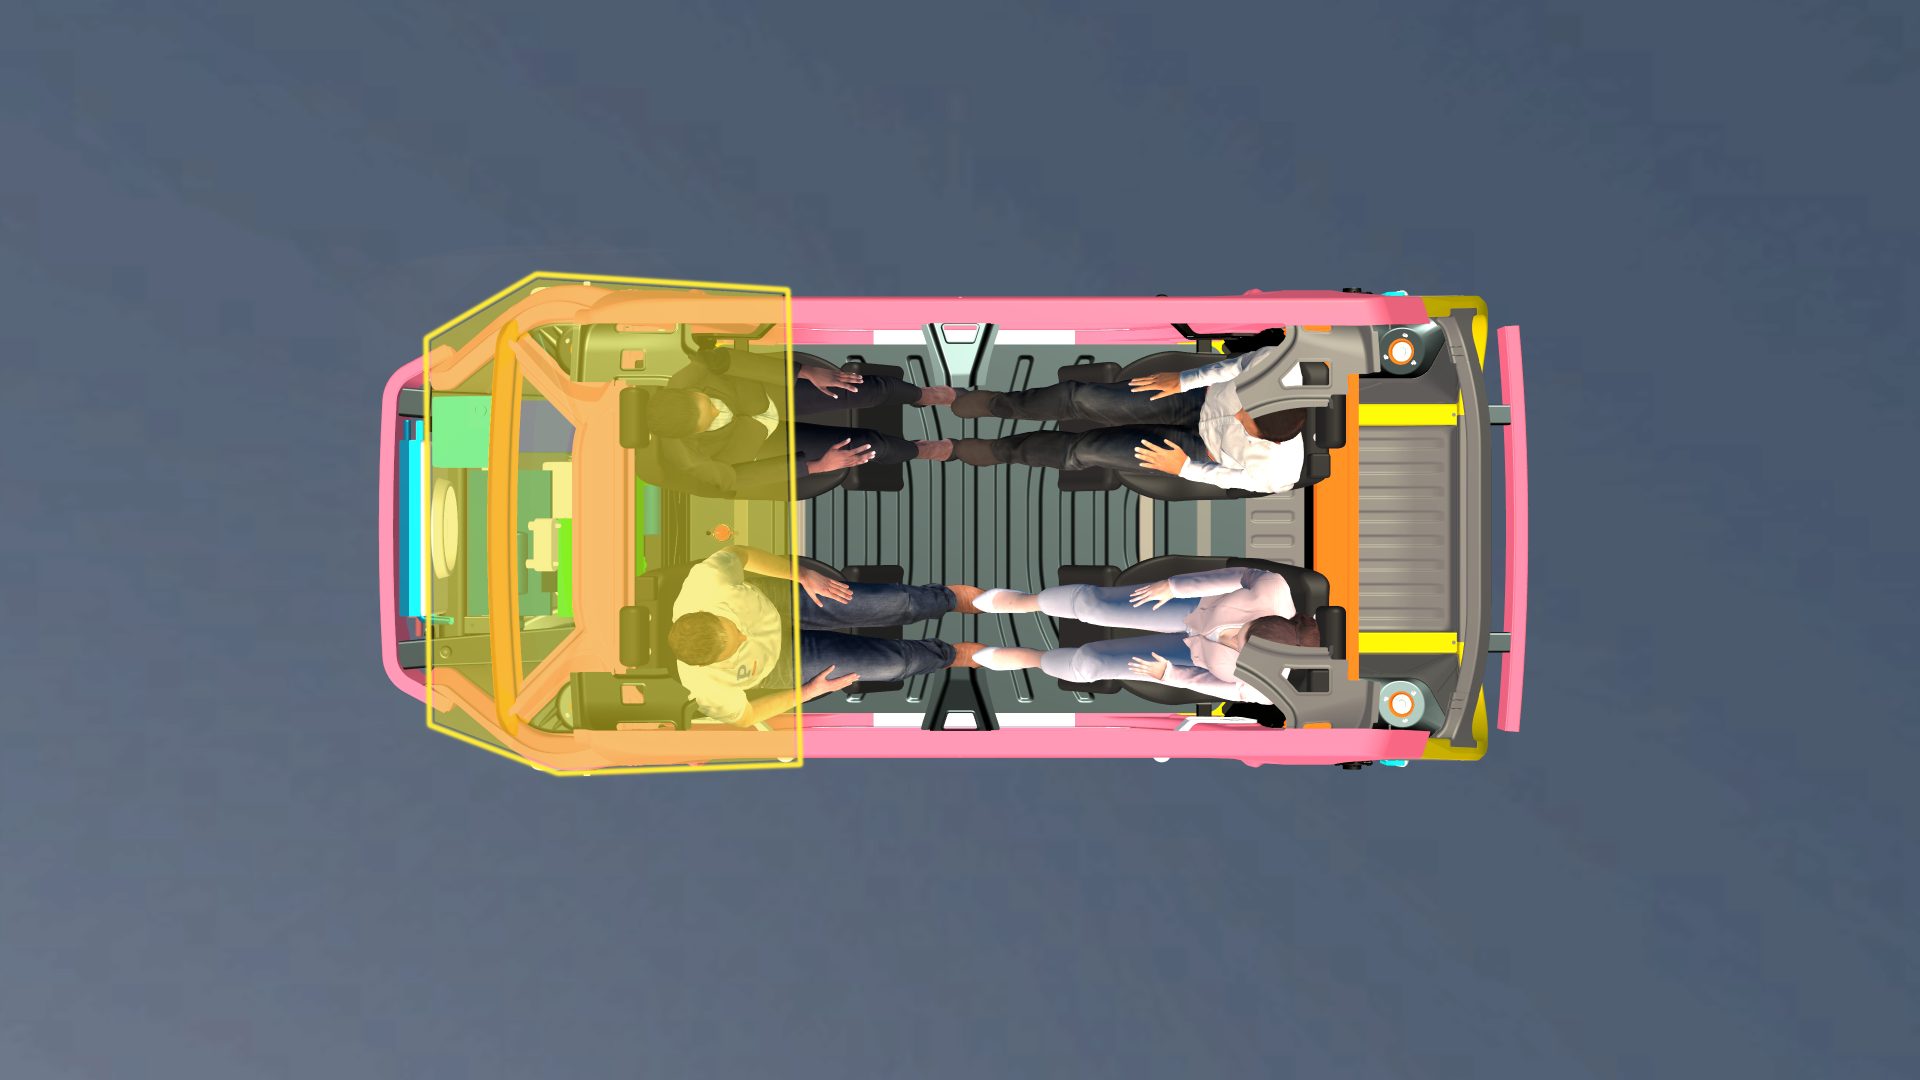
The SEM2 vehicle is a stretched 6-passenger commuter targeting longer journeys with expanded occupancy or additional luggage capacity. In non-commuting hours, the Mobility Fleet Operator would like to continue revenue generation by quickly adapting the vehicle for commercial delivery services. Currently, occupant packaging contrasts with the storage requirements of a package delivery vehicle; thus, the SEM2 vehicles can only be utilized to either transport people or goods. Our project aims to develop interior seating that enables quick removal and adaptation to an optimal delivery van.
Project Details and Results of the Autonomous Vehicle Challenge
From the requirements outlined by WorldAutoSteel, the team focused further research on interior vehicle and seat design. Modern delivery methods, delivery vehicle layout, passenger vehicle seat safety requirements, and seat folding or locking mechanisms were sub-categories of research that hold value within the project’s scope. The main takeaways from our research include different pin and slot mechanisms that are incorporated into a preliminary design for a quick-release system. We also benchmarked a vertical folding seat based on International Harvester designs, and we have modified these for application to the SEM2 autonomous vehicle’s specific needs.
The quick-release system will benefit MSP technicians responsible for performing the conversion of multiple SEM2 vehicles in its fleet at their depot during off-commuting hours. In under 30 minutes, the fleet operators (MSP) must be able to convert the vehicle from a vehicle stressing passenger comfort to an autonomous delivery van and vice versa, using common tools and techniques while meeting all necessary safety standards and regulations. The fleet operators that provide the robotaxi service are not expected to see any major disruption in ride services; however, they may observe improved utilization and profitability if they use the vehicles for package delivery.
Our current engineering requirements include:
- Maximum total payload of 675 kg (6 passengers and 6 seats)
- Individual seat weight of 30kg (6 seats)
- Total volumetric storage space requirement of 1 cubic meter
- Total seating width equal to or less than 1220 mm
- Changeover time less than 30 minutes and
- Minimal number of changeover movements (Fewer than 50 for the complete conversion from passenger to cargo transportation)
Concept Solutions
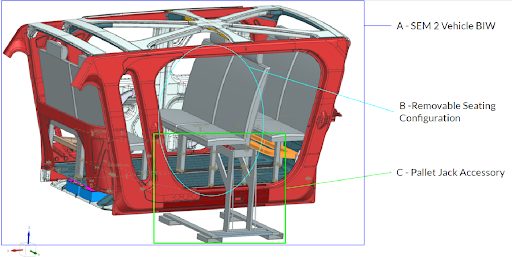
A graphical rendering of our selected system-level autonomous vehicle concept is provided in Figure 1. This design showcases two pairs of T-shaped rails placed in the fore-aft direction of the vehicle. These T-Rails are compatible with a slider system connecting to each seat leg’s bottom.
A sliced view of the rails and slider system are seen in Figure 2. On each slider, in the port-starboard direction, a circular slot approximately 20 mm in diameter (dependent on pin material and size) is cut-out to allow for the insertion of a spring-loaded steel pin. This pin engages both the slider and an equivalent slot cut into the rail, to allow the seat to be locked into a specified position along the rail (Figure 3). The rails run the full length of the vehicle’s interior, allowing 3 seating modules to be placed and locked into a position. Inserting and removing the slider on the rails will be possible through narrow sections where the slider can be vertically lifted or placed on the rail system.
In order to “drop the seats” onto the rails without manual lifting, the team has designed an accompanying “pallet jack accessory” that will be able to hold, transport, and lower the seating modules onto the rail system through the use of an industry-standard pallet jack with a lifting range of 6 inches. The pallet jack accessory can be seen in Figure 1, item C.
Figure 1 – System level concept – rapid adaptation of SEM2 to autonomous vehicle delivery services
The slider mechanism, seen in Figure 2 below, will house a ball roller bearing that allows for the translational motion along the rail to slide the seats into position.
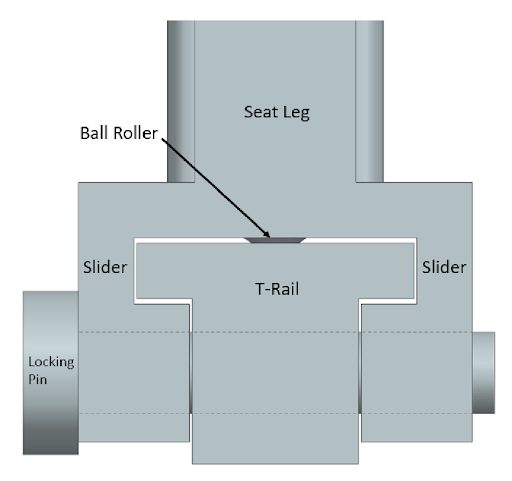
Figure 2 – Slider mechanism in Steel E-T-rail system
The roller bearing bolts into the slider mechanism allowing for fast and easy replacement. The T-Rails are then bolted to the structural members of the vehicle, where engineers from WorldAutoSteel have confidence the design can withstand any and all static and dynamic loading scenarios. The rails will feature a narrow section near the center, allowing the seating module to be removed. This narrow section is tapered to allow the slider to be “homed” and slid into its final, fixed position.
The arms of the pallet jack system reach out to allow a set of seats to be placed on the rail at one time. The pallet jack will drive through the open slots on the ground, lift the seats to the vehicle, align itself using markings on the vehicle, and drop the seats into the rails, where they can then be manually moved to their correct position. The system is designed to remove and insert these seats as fast as possible while exerting minimum effort that might stress the MSP technician. With ease of use and safety being the critical elements of every project, we’ve removed manual lifting from the equation and ensured a factor of safety of 2 is kept for all required crash loads under our current design.
Many integral components are COTS parts and can be bought in bulk to use for mass production as well as reserved parts, helping maintain low cost of ownership for the MSP. The components that are not COTS items, such as the rails and sliders, can be manufactured using high-volume, low-cost fabrication techniques such as stamping. Assembly of the system will be just as easy as all components are connected together using industry-standard fastening and welding techniques.
Conclusions
Validation – To confirm the ease of changeover and our objectives, a simulation was conducted to estimate the time and difficulty of changing from delivery service to people transporter. In a warehouse setting, a location was established as the “vehicle maintenance spot.” We developed a “seat module storage area” approximately 30 meters away. In this simulation, the following steps were conducted:
- A pallet jack was pre-staged near the vehicle, signaling the beginning of the conversion and timer
- A technician walked 30 m to the seating storage area and picked up the seats via accessory
- They carried seats back to the vehicle, aligned the pallet jack with the door, lowered seats onto the rail system, and removed the pallet jack accessory from the vehicle
- They slid the seats into the correct position and inserted the locking pin into its slot
This simulation was repeated twice to replicate the insertion of all six seats. To remove the seats, the steps would be reversed. After five runs of this simulation, ensuring adequate time to perform each simulated step, the average time to complete the simulation was 5 minutes 17 seconds with a total of 24 required movements.
These values were well within the 30-minute and 50-movement objectives. For further validation, we’ll repeat these simulations in the opposite direction, ie, removing the seats to transform into the delivery van. Finally, in Phase 2 of this project, we’ll continue to evaluate seat frame/track componentry to ensure robustness and durability in the proposed solutions.
More Info About Steel E-Motive
We are grateful to our student teams, their supportive leaders, and the universities providing automotive engineering education to our future industry leaders. Their contributions to Steel EMotive have been invaluable.
Interested in learning more about Steel E-Motive and the infinite tunability of steel for Future Mobility? Download the full engineering report here: Steel E-Motive Engineering Report
Blog, homepage-featured-top, main-blog, News
As an organization focused on advancing the advantages of steel to the automotive, autonomous vehicle, and future mobility industries, WorldAutoSteel is committed to engaging with future engineers at universities and colleges around the globe.
Our most recent engineering project, Steel E-Motive, was designed to unveil and meet the challenges of future autonomous vehicles that will help the automotive industry reach net zero emissions targets.
For the Steel E-Motive project, we engaged Ricardo plc to collaborate with our technical directors to develop a Level 5 Autonomous Vehicle. The project uncovered a few challenges that were solved by student engineering teams through Senior Capstone Projects.
Here we summarize the Side Door and Door Hinges project, created at Michigan Technological University by the students and faculty members listed herein.
Steel E-Motive Side Door Functionality and Door Hinge Assessment
The MTU Senior Capstone Team members were Gavin Sheffer, Leander Daavettila, Rob Oestreich, Steven Turnbull, Andrew Mitteer, and Jesse Ebenhoeh.
Introduction and Background
The MTU Senior Capstone Design Team, sponsored by WorldAutoSteel and the Auto/Steel Partnership, was challenged to design a new door hinge for the Steel E-Motive side closure mechanism. The current hinge design was referenced, but a few operational issues were identified for this team’s assessment and engineering study.
The door had unconstrained degrees of freedom, allowing it to swing freely about one axis. Thus, the project included a review of the kinematics of the door opening and hinge design for attachment to the A and C pillars.
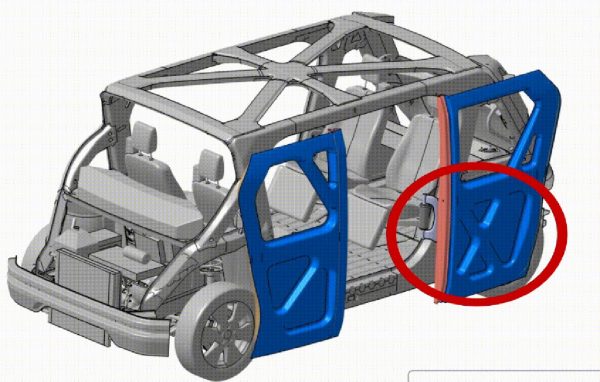
The previous hinge design interferes with the all-wheel steering, meaning in emergency situations, passengers could get trapped in the vehicle. For SEM1, it was also observed that when the wheels are turned, they would block the doors from opening fully, constraining the passenger exit (Figure 1 below).
An emergency release mechanism was needed to allow users to escape if a crash or electrical failure prevented the doors from opening. Power requirements and electric motor sizing for the hinge mechanism needed to be defined.
Figure 1: Side door opening constrained by present hinge mechanism and wheel position.
Project Details and Results – Autonomous Vehicle Solutions
MTU’s design solution uses a four-bar linkage hinge design to keep the door parallel to the vehicle’s body to avoid damage to either the door or the body. The team used a 4:1 gear ratio for the drive motor to open the door. Finally, one of the pins in the secondary arm linkage is accessible by passengers and removable, allowing users to manually push the door open in the event of an emergency (see Figure 2).
Their solution includes pressing a button to open and close the door. The stepper motor receives the input from the button and rotates the gears; the gears then rotate the primary arm, which drives the door. The primary arm is mounted to the door in two locations with bolts. The secondary arm is added to the mechanism to create a four-bar linkage, which helps maintain door orientation during operation. An emergency release was designed and added to the secondary arm to release the four-bar linkage. This allows the door to swivel around a turned wheel in the event of an emergency.
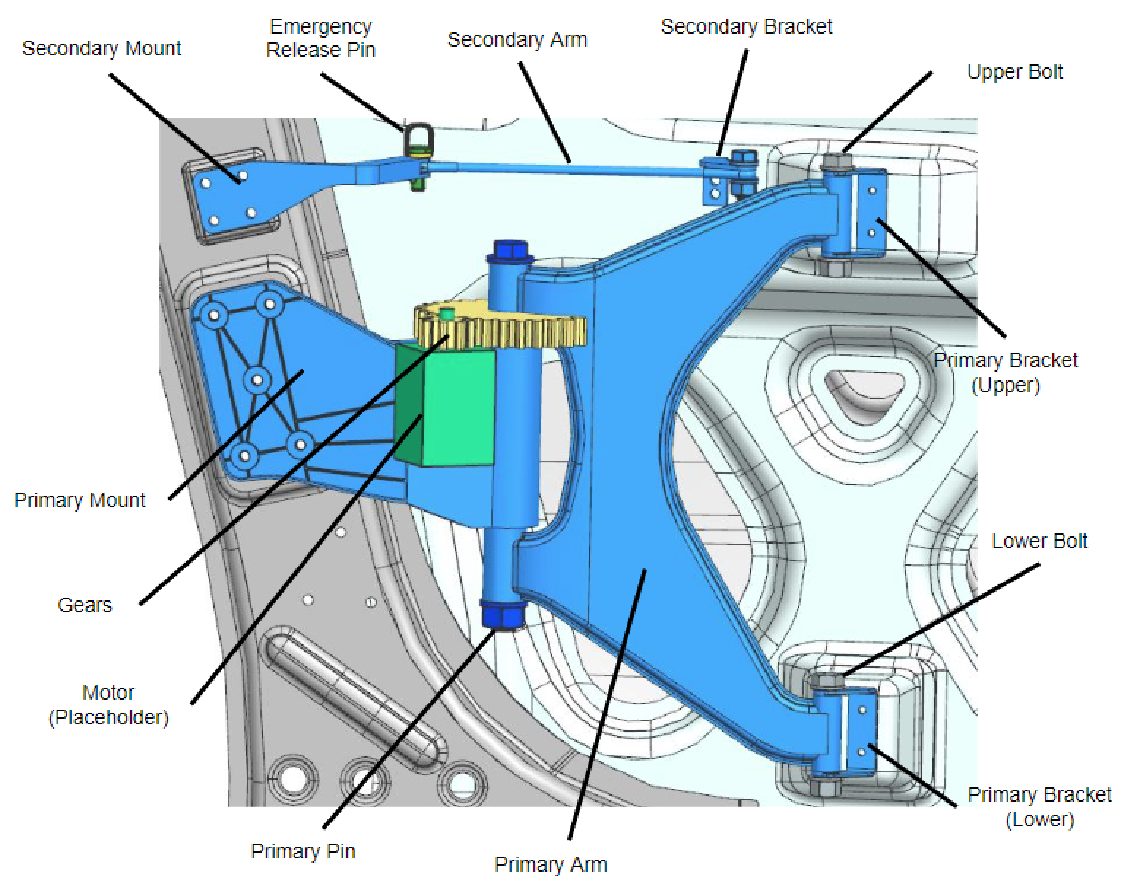
Figure 2: 3D model of the final design less the gear cover for clarity.
The emergency release was designed for safety and manufacturability of the autonomous vehicle. The emergency release pin was simplified to utilize off-the-shelf pins. A relay is suggested to cut power to the motor and allow the door to be manually pushed open. A gear cover was added for safety to protect the occupants from getting pinched by the gears. To maintain and service the design, each assembly part was designed to be attached with threaded fasteners. A gear drive was created so we could use a more cost-efficient motor. The gear ratio decreased the amount of torque required. The material was chosen based on strength and sustainability.
Conclusions
The CAD geometry and the quarter-scale prototype met all of our engineering requirements and objectives. The CAD model defines the mass and emergency release mechanism, and the kinematics are verified by the quarter-scale prototype. The FEA simulation verified set and sag under normal and abusive loading conditions.
In identifying specifications required for the full model, the projected production cost for one mechanism is $471. This includes stamped and cast components, off-the-shelf components such as the stepper motor and fasteners, and the assembly cost.
The team compared using AHSS for the components as opposed to an aluminum alloy. Steel components are stronger, half the price of aluminum, and produce 1/3 of the carbon emissions compared to the same amount of aluminum.
The prototype was 3D printed from PLA plastic at a quarter scale. This serves as a model to be shown by Auto/Steel Partnership for future presentations. It was also used to verify the kinematics of the door motion.
Learn more about Steel E-Motive and download the FREE Engineering Report here: Steel E-Motive
Blog, main-blog, News
As robotaxi companies in the USA prepare to launch their autonomous vehicles in more cities, safety is in the spotlight again. And rightly so. Autonomous vehicle safety challenges must be addressed and with the Steel E-Motive Level 5 autonomous concept, we did that.
Many autonomous mobility service companies have relied on two factors when developing their vehicles: active safety systems which help the vehicle avoid or mitigate the extent of a crash, and a maximum vehicle speed limit, which will reduce the extent of injuries to the occupants.
But the fact is that these vehicles are going to be out in mixed-mode traffic situations. There will be accidents – however much we all attempt to do everything possible to avoid them. When we developed the Steel E-Motive (SEM) body structure concepts for fully autonomous ride-sharing electric vehicles, we agreed on two basic principles – that these vehicles would operate at high speeds (top speed of 130 kph) in mixed mode traffic conditions, and that we, therefore, needed to engineer passive safety structures that met global high-speed crash requirements to protect occupants and the battery system in these use-case conditions. In this process, we discovered that no other provider of autonomous ride-sharing electric vehicles had fully shared details of passive safety structures engineered to those same high-speed crash standards. Autonomous vehicle safety had been addressed only on a limited basis.
Fortunately, our vehicle design process benefitted from a massive portfolio of modern advanced high-strength steels (AHSS) available through member companies of WorldAutoSteel. Steel E-Motive (SEM) was developed to show how AHSS can enable sustainable, comfortable, economical, and safe ride-sharing vehicles by 2030.
The AHSS Extended Passenger Protection Zone provides excellent cabin intrusion protection and ultimately lower risk of injury. PHS provides formability for challenging geometries, and Martensitic steel (MS) provides the strength to limit intrusion.
Visit this link to download the full engineering report: Steel E-Motive
The result is one of the first robotaxis to fully detail and report compliance to global high-speed safety standards. In developing Steel E-Motive, we targeted conformity with seven US crash standards, including US NCAP (New Car Assessment Program) IIHS and FMVSS (Federal Motor Vehicle Safety Standards) front, side, and rear impact tests while also assessing performance against worldwide protocols, including NHTSA (US) Euro NCAP (European) and China’s GB 38031 standard for battery protection.
As an example, Steel E-Motive achieves the highest IIHS rating of “good.” This is particularly important as IIHS (the US-based Insurance Institute for Highway Safety) is highly regarded for its dedication to reducing deaths, injuries, and property damage from motor vehicle crashes.
Most production vehicles use new generation, advanced high-strength steels, and technologies. We had no fewer than 64 AHSS materials to select from, enabling us to choose exactly the right steel for every need and purpose in the vehicle, including safety protection. These make a car stronger, more fuel efficient, and safer.
Nearly all vehicles on the road today are made of steel because it has the broadest range of properties while being the most affordable structural material for designing safe vehicles. Steel has a unique capacity to absorb an impact, and, therefore, to diffuse crash energy. It also becomes harder when it’s crushed, which means it will become stronger on impact, retarding further penetration into the vehicle’s passenger zone.
Taking on Autonomous Vehicle Safety Challenges
Here is an outline of how we designed steel’s benefits into the Steel E-Motive (SEM) concept when considering front and side crashes.
SEM features a high-strength front protection zone, which reacts to the crush loads and minimizes intrusion for the occupants in front crashes. The crush zones have been engineered to decelerate the vehicle progressively. The longitudinal mid rails, featuring tailor-welded blanks fabricated with Dual Phase steels, are tuned to give a lower deceleration pulse into the passenger cabin to minimize injury threat. The side crush rails are designed to minimize intrusion into the cabin for occupant protection. Finally, a novel design geometry and Press Hardened Steels enable the new glance beam architecture to force the vehicle off of the Small Offset barrier; the resulting “glance-off” achieves significantly reduced crash energy and pulse into the passenger cabin.
When considering side crashes, we engineered the body structure for the IIHS 60kph deformable barrier test and 30kph side pole test, assessing both occupant and battery protection and achieving the IIHS “good” performance rating. Our side structures are comprised of a large one-piece tailor-welded door ring fabricated with press hardened steels, the TRIP steel B pillar housed in the side scissor doors, and a roll-formed hexagon rocker beam fabricated with Dual Phase steel.
These attain a very safe design, giving good levels of protection for both the occupants and battery modules, exceeding 30mm intrusion clearance at critical measurement points.
SEM was also engineered for rear crash and roof crush, and once again, the robust steel-intensive architecture exceeds crash standard requirements.
Electric-powered vehicle sales are accelerating, reflecting industry investment, and will soon achieve market domination from the combustion engine. In megacities, where congestion, pollution, and exorbitant vehicle ownership costs reign, Autonomous cars will replace drivers, and ride-sharing will become the norm. As we look into the future and recognize the need for these vehicles to offer comfortable, safe, affordable, and sustainable transportation, we will still be designing them by harnessing the unique properties of steel.
Visit this link to download the full engineering report: Steel E-Motive
Blog, homepage-featured-top, main-blog, News, Resistance Spot Welding, RSW of Dissimilar Steel, Tool & Die Professionals
Urbanization and waning interest in vehicle ownership point to new transport opportunities in megacities around the world. Mobility as a Service (MaaS) – characterized by autonomous, ride-sharing-friendly EVs – can be the comfortable, economical, sustainable transport solution of choice thanks to the benefits that today’s steel offers.
The WorldAutoSteel organization is working on the Steel E-Motive program, which delivers autonomous ride-sharing vehicle concepts enabled by Advanced High-Strength Steel (AHSS) products and technologies.
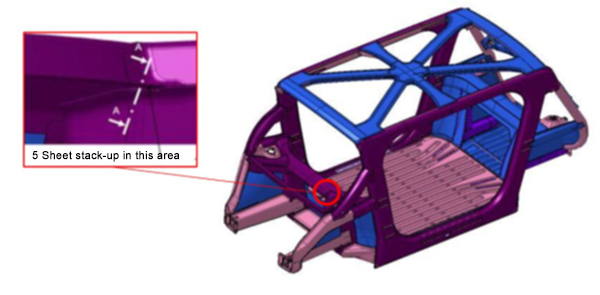
The Body structure design for this vehicle is shown in Figure 1. It also indicates the specific joint configuration of 5 layers AHSS sheet stack-up as shown in Table 1. Resistance spot welding parameters were developed to allow this joint to be made by a single weld. (The previous solution for this welded joint is to create one spot weld with the bottom 3 sheets indicated in the table and a second weld to join the top 2 sheets, combining the two-layer groups to 5T stack-up.)
NOTE: Click this link to read a previous AHSS Insights blog that summarizes development work and recommendations for resistance spot welding 3T and 4T AHSS stack-ups: https://bit.ly/42Alib8
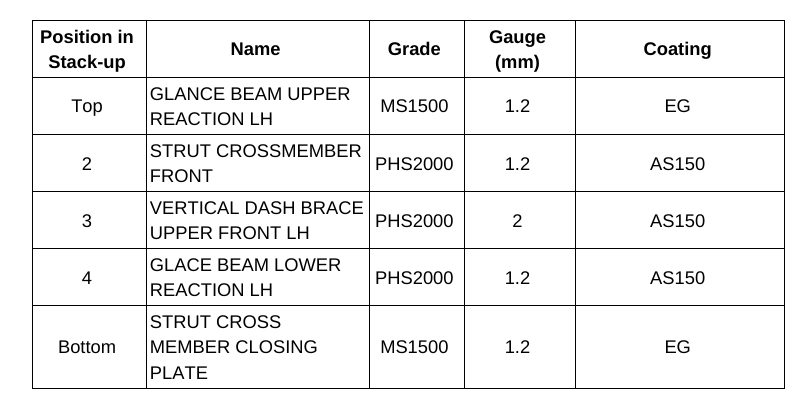
Table 1. Provided materials organized in stack-up formation showing part number, name, grade, gauge in mm, and coating type. Total thickness = 6.8 mm
The same approach of utilizing multiple current pulses with short cool time in between the pulses was shown to be most effective in this case of 5T stack-up. It is important to note that in some cases, the application of a secondary force was shown to be beneficial, however, it was not used in this example.
To establish initial welding parameters simulations were conducted using the Simufact software by Hexagon. As shown in Figure 2, the final setup included a set of welding electrodes that clamped the 5-layer AHSS stack-up. Several simulations were created with a designated set of welding parameters of current, time, number of pulses, and electrode force.
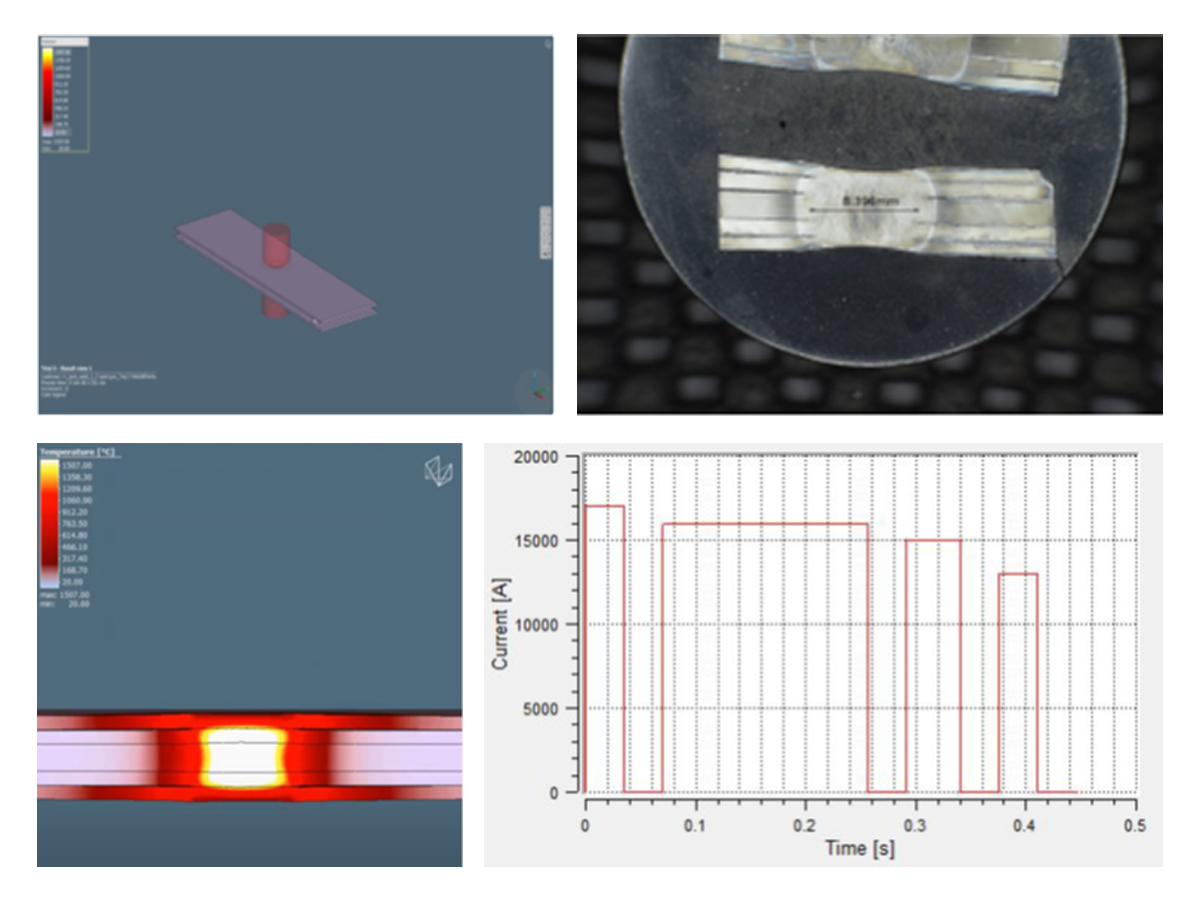
Figure 2. Example of simulation and experimental results showing acceptable 5T resistance spot weld (Meets AWS Automotive specifications)
Thanks is given to Menachem Kimchi, Associate Professor-Practice, Dept of Materials Science, Ohio State University and Technical Editor – Joining, AHSS Application Guidelines, for this article.