![Uniform Elongation]()
Mechanical Properties
During a tensile test, the elongating sample leads to a reduction in the cross-sectional width and thickness. The shape of the engineering stress-strain curve showing a peak at the load maximum (Figure 1) results from the balance of the work hardening which occurs as metals deform and the reduction in cross-sectional width and thickness which occurs as the sample dogbone is pulled in tension. In the upward sloping region at the beginning of the curve, the effects of work hardening dominate over the cross-sectional reduction. Starting at the load maximum (ultimate tensile strength), the reduction in cross-sectional area of the test sample overpowers the work hardening and the slope of the engineering stress-strain curve decreases. Also beginning at the load maximum, a diffuse neck forms usually in the middle of the sample.

Figure 1: Engineering stress-strain curve from which mechanical properties are derived.
The elongation at which the load maximum occurs is known as Uniform Elongation. In a tensile test, uniform elongation is the percentage the gauge length elongated at peak load relative to the initial gauge length. For example, if the gauge length at peak load measures 61 mm and the initial gauge length was 50mm, uniform elongation is (61-50)/50 = 22%.
Schematics of tensile bar shapes are shown within Figure 1. Note the gauge region highlighted in blue. Up though uniform elongation, the cross-section has a rectangular shape. Necking begins at uniform elongation, and the cross section is no longer rectangular.
Theory and experiments have shown that uniform elongation expressed in true strain units is numerically equivalent to the instantaneous n-value.
Deformation Prior to Uniform Elongation is Not Uniformly Distributed
Conventional wisdom for decades held that there is a uniform distribution of strains within the gauge region of a tensile bar prior to strains reaching uniform elongation. Traditional extensometers calibrated for 50-mm or 80-mm gauge lengths determine elongation from deformation measured relative to this initial length. This approach averages results over these spans.
The advent of Digital Image Correlation (DIC) and advanced processing techniques allowed for a closer look. A studyS-113 released in 2021 clearly showed that each of the 201 data points monitored within a 50 mm gauge length (virtual gauge length of 0.5-mm) experiences a unique strain evolution, with differences starting before uniform elongation.
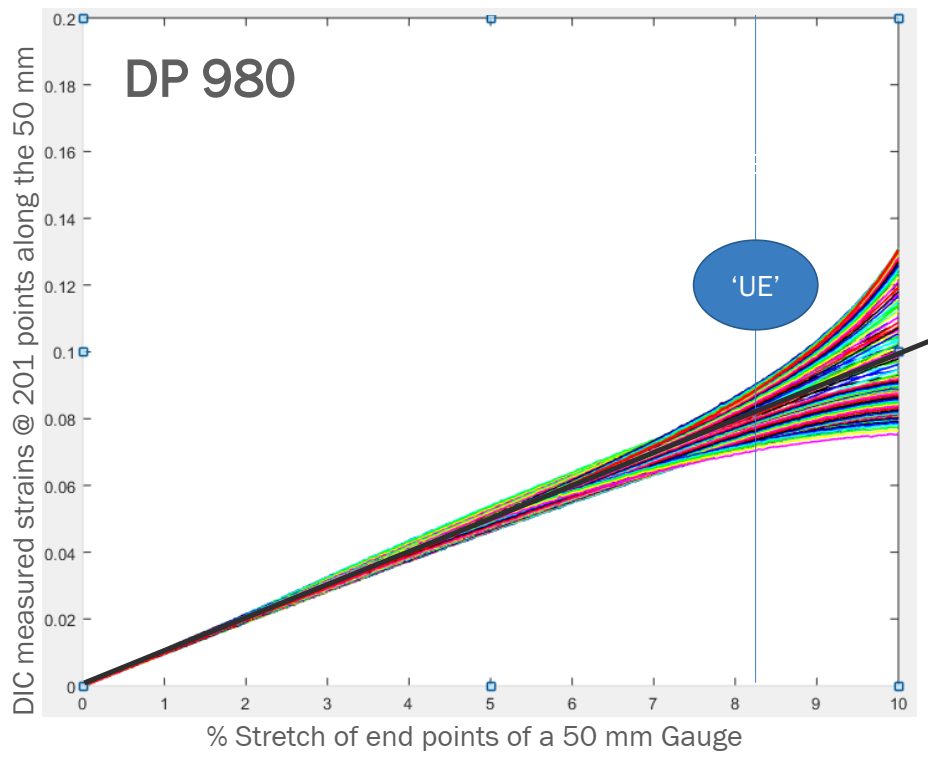
Figure 2: Strain evolution of the 201 points on the DP980 tensile-test specimen exhibits divergence beginning before uniform elongation—counter to conventional thinking.S-113
![Uniform Elongation]()
Mechanical Properties
Necking: Diffuse Neck and Local Neck
A tensile bar increases in length as it is pulled, with a concurrent reduction in width and thickness. The cross section is rectangular in shape through uniform elongation. After uniform elongation, however, strains concentrate in the reduced section of the tensile test sample, resulting in a non-uniform section of reduced width. This region is known as a diffuse neck. The diffuse neck further accentuates and accelerates the cross-section reduction, leading to a concentration of strains within this region.
A local neck is a narrow band in the sheet metal part that is thinner than its surroundings (Figure 1). This local or through-thickness neck occurs shortly before the traditional fracture of the specimen. When the local neck begins, deformation stops in the remainder of the stamping. In a tensile bar, no deformation occurs along the width of the neck – only increased elongation and thinning. A local neck prevents a deeper section from being formed and serves as a crack initiation site. Additional loading, including fatigue loading during the life of the part, may cause a neck to progress to fracture (Figure 2). The strains resulting in a local neck are defined by the Forming Limit Curve, or FLC.

Figure 1: A local neck prevents forming a deeper section and serves as a crack initiation site.

Figure 2: Necking and fracture on a sample formed with a hemispherical dome.S-57
Traditional methods of detecting the onset of necking include tactile or visible sensing of the groove of the neck. Researchers are focusing on the use of non-contact approaches to define a neck. ISO 12004-2 calls for a polynomial fit of data outside the neck, but results from this method are a function of the order of the polynomial as well as the geometry of the tooling and the blank.
Using Digital Image Correlation allows for the detection in curvature evolution in the area that subsequently develops into a neck. The signature is detected for the many types of AHSS grades tested as well as other sheet metals, and correlates well with other methods. Citation S-57 presents an overview of the technique, with greater detail covered in Citations M-19 and S-58. Using the surface data geometry as measured by DIC to detect the true onset of necking enables better and more efficient use of AHSS grades through more reliable knowledge of their actual limits.
![Uniform Elongation]()
Mechanical Properties
Engineering stress-strain units are based on the starting dimensions of the tensile test sample: Engineering stress is the load divided by the starting cross-sectional area, and engineering strain is the change in length relative to the starting gauge length (2 inches, 50mm, or 80mm for ASTM [ISO I], JIS [ISO III], or DIN [ISO II] tensile test samples, respectively.)
Metals get stronger with deformation through a process known as strain hardening or work hardening. This is represented on the stress strain curve by the parabolic shaped section after yielding.
Concurrent with the strengthening as the tensile test sample elongates is the reduction in the width and thickness of the test sample. This reduction is necessary to maintain consistency of volume of the test sample.
Initially the positive influence of the strengthening from work hardening is greater than the negative influence of the reduced cross-section, so the stress-strain curve has a positive slope. As the influence of the cross-section reduction begins to overpower the strengthening increase, the stress-strain curve slope approaches zero.
When the slope is zero, the maximum is reached on the vertical axis of strength. This point is known as the ultimate tensile strength, or simply the tensile strength. The strain at which this occurs is known as uniform elongation.
Strain concentration after uniform elongation results in the formation of diffuse necks and local necks and ultimately fracture.

Figure 1: Tensile Strength is the Strength at the Apex of the Engineering Stress – Engineering Strain Curve.
![Uniform Elongation]()
Testing and Characterization
topofpage
Tensile testing characterizes the forming and structural behavior of sheet metals. The test involves loading a sample with a well-defined shape along the axis in tension, generally to fracture, and recording the resultant load and displacement to calculate several mechanical properties. Global standardsI-7, A-24, D-19, J-15 prescribe the conditions under which tests must occur.
Sample Size and Shape
Full-size samples for tensile testing of metal sheets have a rectangular section at the edges for gripping by the test machine. Reducing the width in the central area promotes fracture in the monitored region. These geometrical features result in a sample shape which resembles a dogbone, leading to a descriptive term applied to test samples.
Dimensions of the dogbone samples are associated with tensile test standard from which they apply. ISO I, II, and III (described in Citation I-7) corresponds to the ASTMA-24, DIND-19, and JISJ-15 shapes, respectively. Figure 1 shows the dogbone shapes, highlighting the critical dimensions of width and gauge length. Refer to the Test Standards for other dimensions, tolerances, and other requirements.

Figure 1: Full-size tensile sample shapes for ISO I (ASTM), ISO II (DIN), and ISO III (JIS) standards.I-7, A-24, D-19, J-15
Significant differences exist in the width and gauge length of these tensile bar shapes. Although the ASTM and JIS bars have similar gauge length, the width of the JIS bar is twice that the ASTM bar. The ASTM and DIN bars have a 4:1 ratio of gauge length to width, where the JIS bar has a 2:1 ratio.
These shape differences mean that the calculated elongation changes depending on the test-sample standard used, even when testing identical material. With the combination of the shortest gauge length and widest sample, elongation from JIS bars typically are higher than what would be generated from the other shapes.
Yield strength and tensile strength are not a function of the shape of the tensile bar. Strength is defined as the load divided by the cross-sectional area. Even though each of the bars specify a different sample width (and therefore different cross-section), the load is normalized by this value, which negates differences from sample shape.
Shearing or punching during sample preparation may work-harden the edges of the tensile bar, which may lead to generating an inaccurate representation of the mechanical properties of the sheet metal. Test Standards require subsequent machining or other methods to remove edge damage created during sample preparation. Milling or grinding the dogbone samples minimizes the effects sample preparation may have on the results.
Tensile Test Procedure
The gauge length is the reference length used in the elongation calculations. Depending on the test standard, the gauge length is either 2 inches, 80 mm, or 50 mm. Multiplying the width and thickness within the gauge length determines the initial cross-sectional area before testing.
Grips tightly clamp the edges of the sample at opposite ends. As the test progresses, the grips move away from each other at a prescribed rate or in response to the restraining load. A load cell within the grips or load frame monitors force. An extensometer tracks displacement within the gauge length. Samples are typically tested until fracture.
During the tensile test, the sample width and thickness shrink as the length of the test sample increases. However, these dimensional changes are not considered in determining the engineering stress, which is determined by dividing the load at any time during the test by the starting cross-sectional area. Engineering strain is the increase in length within the gauge length relative to the starting gauge length. (Incorporating the dimensional changes occurring during testing requires calculating true stress and strain. The differences between engineering and true stress/strain are covered elsewhere (hyperlink to 2.3.2.1-Engineering/True)
A graph showing stress on the vertical axis and strain on the horizontal axis is the familiar engineering stress-strain curve, Figure 2. From the stress-strain curve, numerous parameters important for sheet metal forming appear, including:

Figure 2: Engineering stress-strain curve from which mechanical properties are derived.
Influence of Test Speed
Conventional tensile testing is done at strain rates slow enough to be called “quasi-static.” These rates are several orders of magnitude slower than the deformation rates during stamping, which itself is several orders of magnitude slower than what is experienced during a crash event.
Stress-strain curves change with test speed, typically getting stronger as the speed increases. The magnitude of these changes varies with grade. Significant challenges exist when attempting to characterize the tensile response at higher strain rates. Improved equipment and data collection capabilities are among the required upgrades.
Influence of Tensile Test Equipment
Advanced High-Strength Steels (AHSS) may challenge older test equipment. The load and displacement response must reflect only the contributions of the sheet metal, and not be influenced by the load frame and other testing equipment. In much the same way that insufficiently stiff press crowns deflect when stamping AHSS parts, tensile test load frames may similarly deflect, resulting in inaccuracies in the load-displacement measurements.
Grip strength also becomes critical when testing AHSS samples. The high strength of the metal sheets requires more grip pressure to prevent sample slippage through the grips. Pneumatic grips and even some mechanical grips may not generate the necessary pressure. Hydraulically actuated grips may be necessary as the strength increases.
Back to the Top