RSW of Dissimilar Steel
This article is the summary of a paper entitled, “HAZ Softening of RSW of 3T Dissimilar Steel Stack-up”, Y. Lu., et al.L-15
Electromechanical Model
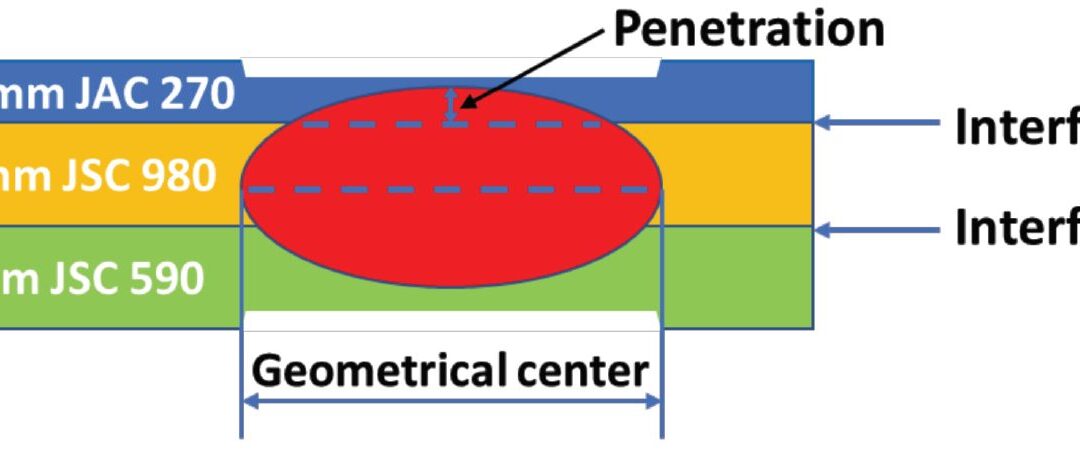
The study discusses the development of a 3D fully coupled thermo-electromechanical model for RSW of a three sheet (3T) stack-up of dissimilar steels. Figure 1 schematically shows the stack-up used in the study. The stack-up chosen is representative of the complex stack-ups used in BIW. Table 1 summarizes the nominal compositions of the three steels labeled in Figure 1.
Figure 1: Schematics of the 3T stack-up of 0.75-mm-thick JAC 270/1.4-mm-thick JSC 980/1.4-mm-thick JSC 590 steels.L-15
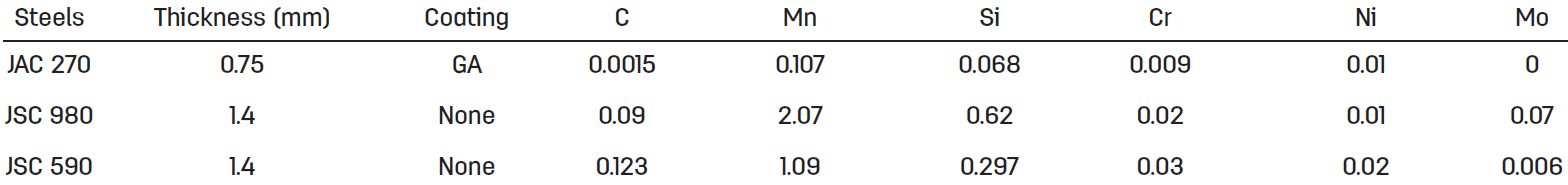
Table 1: Nominal Composition of Steels.L-15
JAC270 is a cold rolled Mild steel with a galvanneal coating having a minimum tensile strength of 270 MPa. JSC590 and JSC980 are bare cold rolled Dual Phase steels with a minimum tensile strength of 590 MPa and 980 MPa, respectively.
The electrodes used were CuZr dome-radius electrodes with a surface diameter of 6 mm. The welding parameters are listed in Table 2.
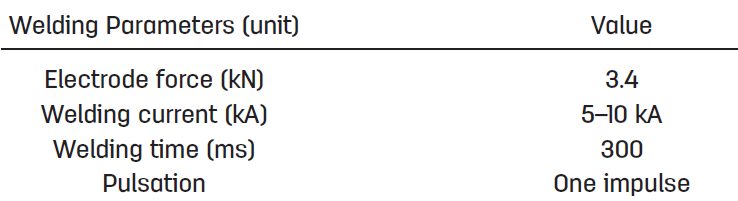
Table 2: Welding Parameters for Resistance Spot Welding of 3T Stack-Up of Steel Sheets.L-15
Figure 2 shows consistent nugget dimensions between simulation and experiment, supporting the validity of the RSW process model for 3T stack-up. The effect of welding current on nugget penetration into the thin sheet is similar to that on the nugget size. It increases rapidly at low welding current and saturates to 32% when the welding current is higher than 9 kA, as shown in Figure 2C.
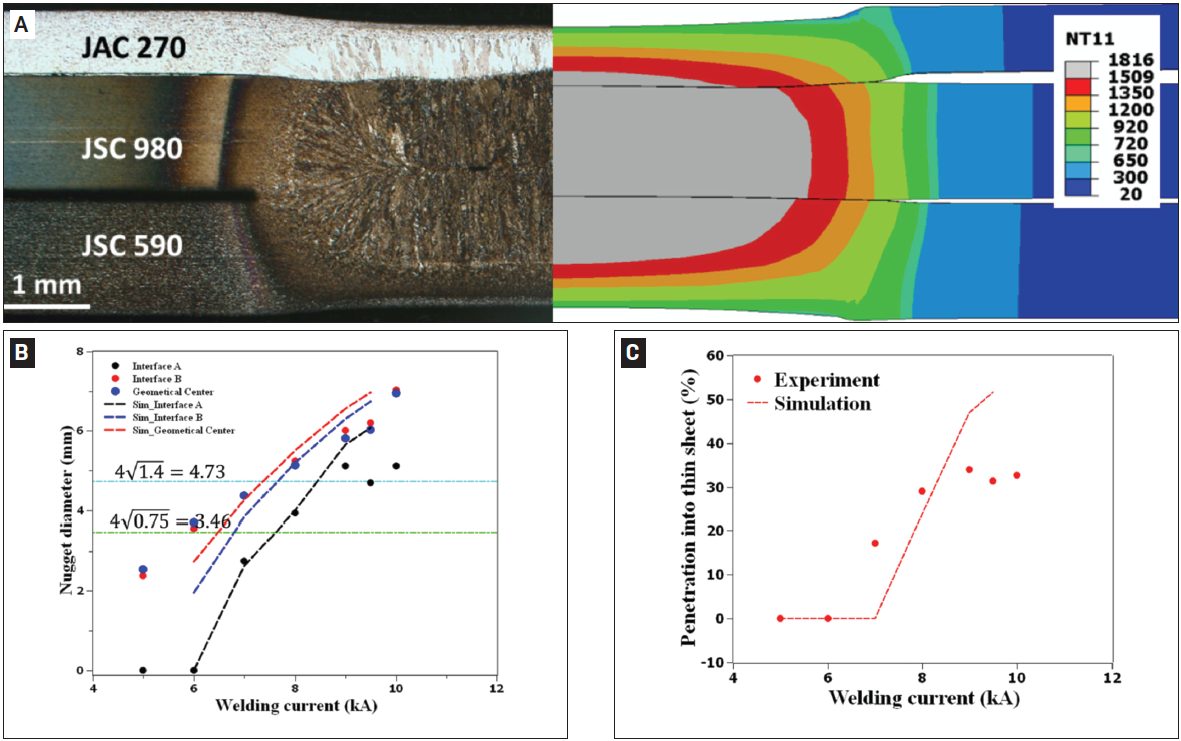
Figure 2: Comparison between experimental and simulated results: A) Nugget geometry at 8 kA; B) nugget diameters; C) nugget penetration into the thin sheet as a function of welding current. In Figure 2A, the simulated nugget geometry is represented by the distribution of peak temperature (in Celsius). The two horizontal lines in Figure 2B represent the minimal nugget diameter at Interfaces A and B calculated, according to AWS D8.1M: 2007, Specification for Automotive Weld Quality Resistance Spot Welding of Steel. Due to limited number of samples available for testing, the variability in nugget dimensions at each welding current was not measuredL-15.
The results for nugget formation during RSW of the 3T stack-up are show in Figures 3-5. Figure 2 shows that, at the start of welding, the contact pressure at interface A (thin/thick) has a higher peak and drops more quickly along the radial direction than that at interface B (thick/thick). Due to the more localized contact area (Figure 3), a high current density can be observed at interface A, as shown in Figure 4A. Additionally, due to the high current density at interface A, localized heating is generated at this interface, as shown in Figure 5A.
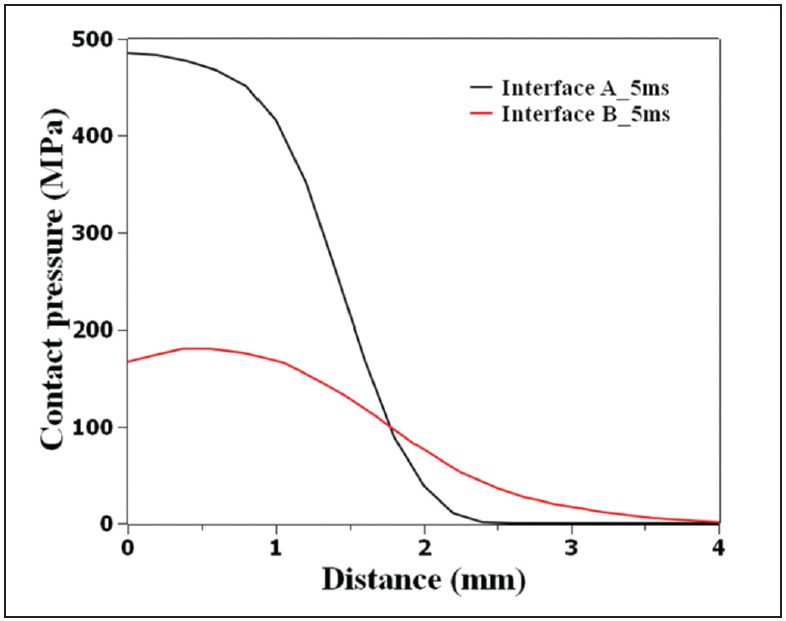
Figure 3: Calculated contact pressure distribution at interfaces A (thin/thick) and B (thick/thick) at a welding time of 5 ms, current of 8 kA, and electrode force of 3.4 L-15
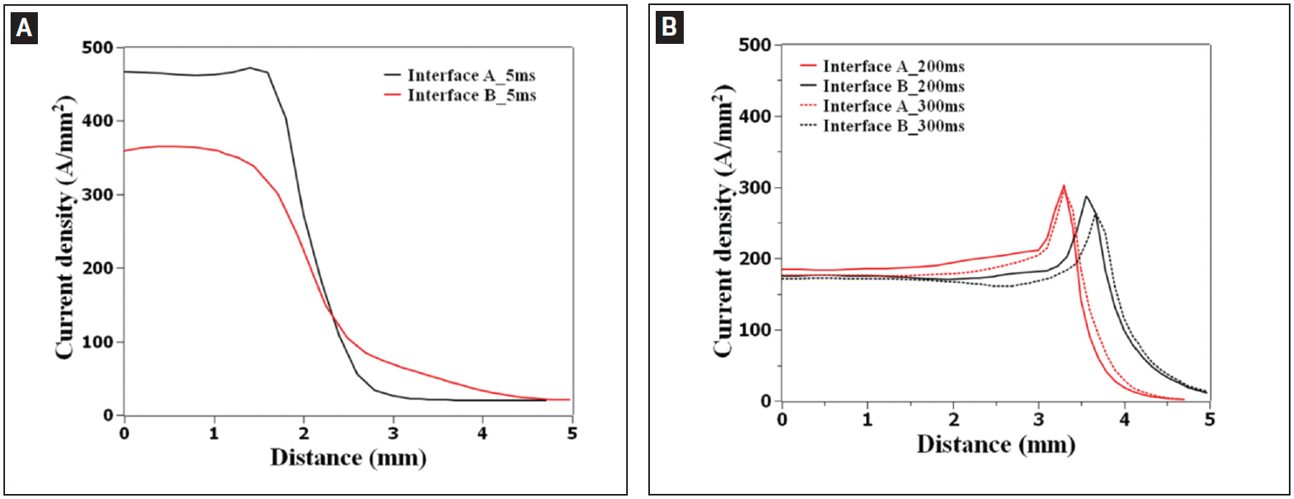
Figure 4: Calculated current density distribution at interfaces A (thin/thick) and B (thick/thick) at welding time of A — 5 ms; B — 200 and 300 ms.L-15
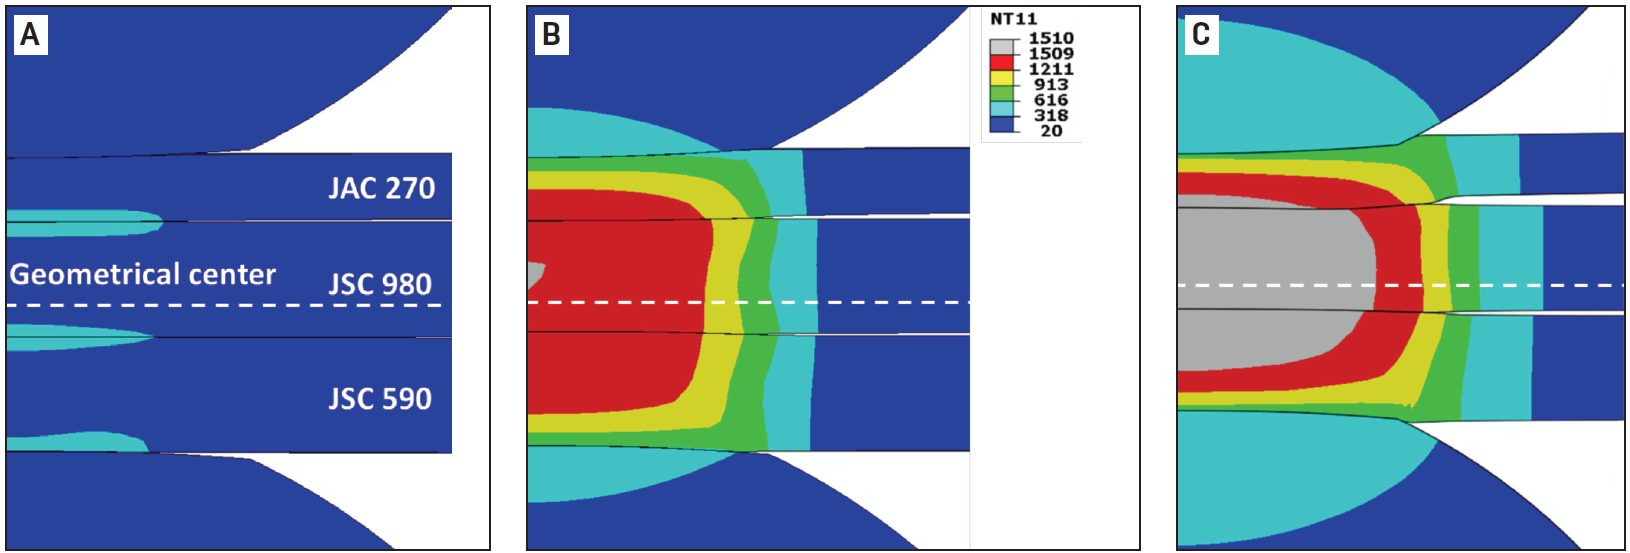
Figure 5: Temperature distribution during resistance spot welding of 3T stack-up at welding times of A) 5 ms; B) 102 ms; C) 300 ms. Welding current is 8 kA and electrode force is 3.4 kN. Calculated temperature is given in Celsius.L-15
As welding time increases, the contact area is expanded, resulting in a decrease of current density. The heat generation rate is shifted from interfaces to the bulk and the peak temperature occurs near the geometrical center of the stack-up.
Figure 6 illustrates that the predicted value corresponds well with the experimental data indicating a sound fitting to the isothermal tempering experimental data.
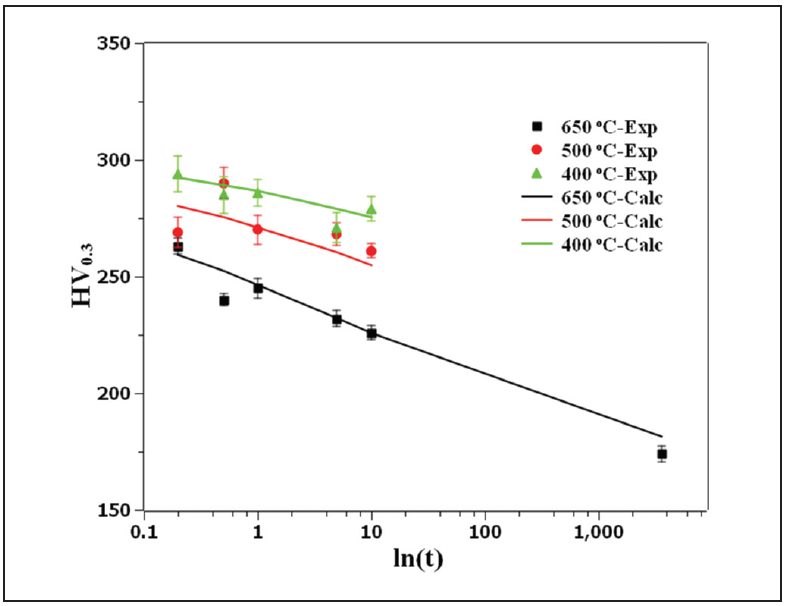
Figure 6: Comparison of the measured hardness with JMAK calculation showing the goodness of fit of the JSC 980 tempering kinetics parameters.L-15
Figure 7 shows the predicted hardness map of RSW 3T stack-up as well as the predicted and measured hardness profiles for JSC 980.
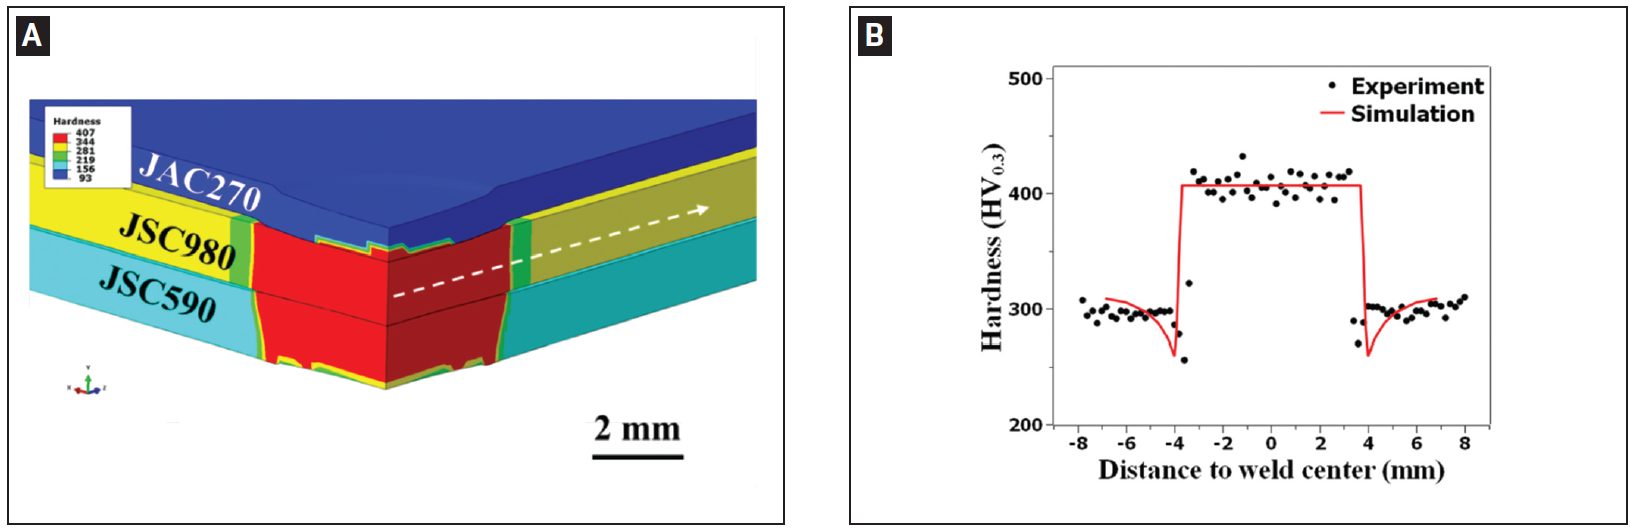
Figure 7: A) Predicted hardness map of resistance spot welded 3T stack-up; B) predicted and measured hardness profiles along the line marked in (A) for JSC 980.L-15
Automotive Welding Process Comparison
Introduction
A solution to improve the spot weld strength is to add a HS adhesive to the weld. Figure 1 illustrates the strength improvement obtained in static conditions when crash adhesive (example: Betamate 1496 Dow Automotive) is added. The trials are performed with 45-mm-wide and 16-mm adhesive bead samples.
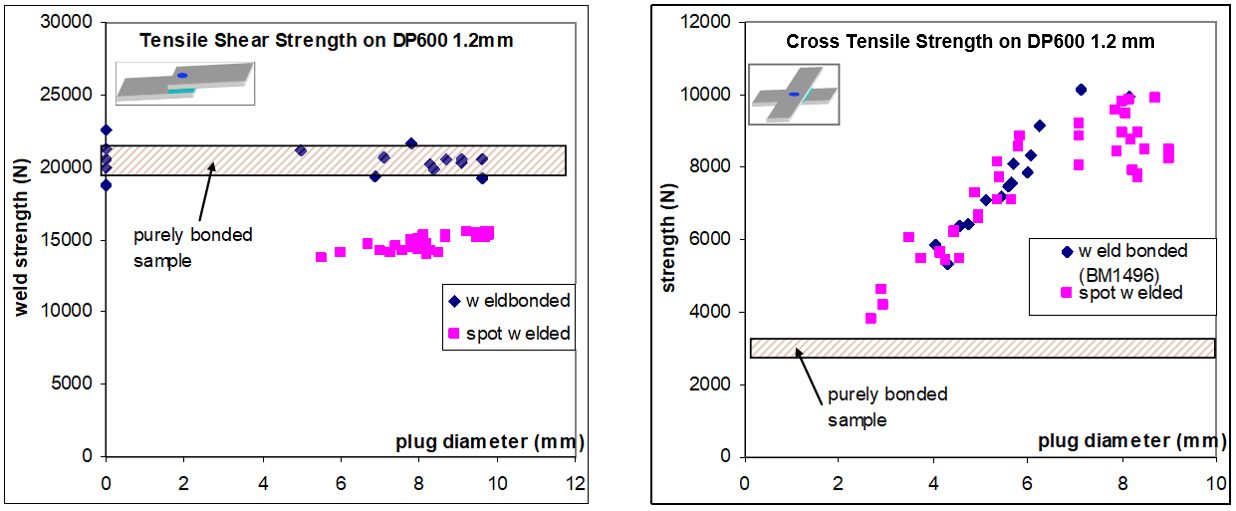
Figure 1: TSS and CTS on DP 600.A-16
Another approach to improve the strength of welds is done by using laser welding instead of spot welding. The technologies based on remote welding optics have been introduced and a high productivity can be obtained. The effective welding time is maximized and a wide variety of weld geometries becomes feasible. Compared to spot welding, the main advantage of laser welding, regarding mechanical properties of the joint, is the possibility to adjust the weld dimension to the requirement. One may assume that, in tensile shear conditions, the weld strength depends linearly of the weld length (Figure 2).
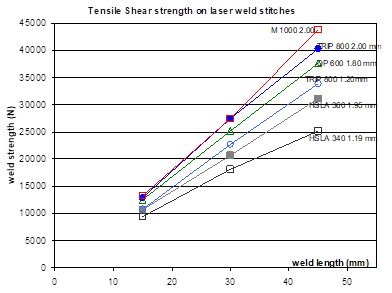
Figure 2: Tensile-shear strength on laser weld stitches of different length.A-16
Comparing spot weld strength with laser weld strength cannot be restricted to the basic tensile shear test. Tests were performed to evaluate the weld strength in both quasi-static and dynamic conditions under different solicitations, on various UHSS combinations. The trials were performed on a high-speed testing machine, at 5 mm/min for the quasi-static tests and 0.5 m/s for the dynamic tests (pure shear, pure tear or mixed solicitation) (Figure 3). The strength at failure and the energy absorbed during the trial have been measured. It should be noticed that the energy absorbed depends also on the deformation of the sample. However, as all the trials were made according to the same sample geometry, the comparison of the results is relevant. Laser stitches were done with a 27-mm length. C- and S-shape welds were performed with the same overall weld length. This lead s to various apparent length and width of the welds. A shape factor, expressed as the ratio width/length of the weld, can be defined according to Table 1.
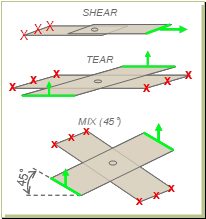
Figure 3: Sample geometry for quasi-static and dynamic tests. A-16
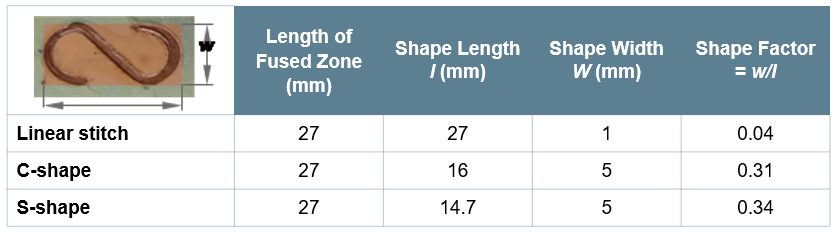
Table 1: Shape factor definition.A-16
The weld strength at failure can be easily described with an elliptic representation, with major axes representing pure shear and normal solicitation (Figure 4). For a reference spot weld corresponding to the upper limit of the weldability range, globally similar weld properties can be obtained with 27-mm laser welds. The spot weld equivalent length of 25-30 mm has been confirmed on other test cases on UHSS in the 1.5- to 2-mm range thickness. It has also been noticed that the spot weld equivalent length is shorter on thin mild steel (approximately 15-20 mm). This must be considered in case of shifting from spot to laser welding on a given structure. There is no major strain rate influence on the weld strength; the same order of magnitude is obtained in quasi-static and dynamic conditions.
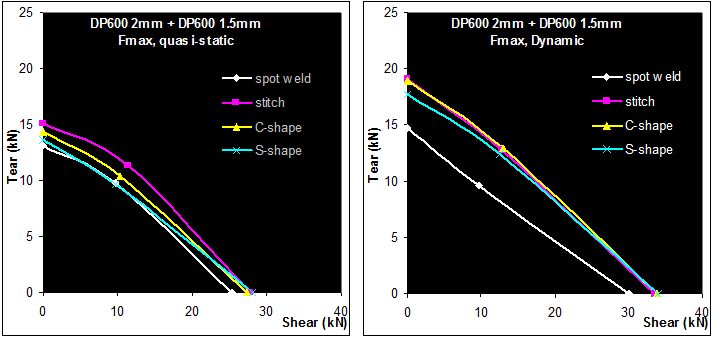
Figure 4: Quasi-static and dynamic strength of welds, DP 600 2 mm+1.5 mm.A-16
The results in terms of energy absorbed by the sample are seen in Figure 5. In tearing conditions, both the strength at fracture and energy are lower for the spot weld than for the various laser welding procedures. In shear conditions, the strength at fracture is equivalent for all the welding processes. However, the energy absorption is more favorable to spot welds. This is due to the different fracture modes of the welds. IF fracture is observed on the laser welds under shearing solicitation (Figure 6). Even if the strength at failure is as high as for the spot weds, this brutal failure mode leads to lower total energy absorption.
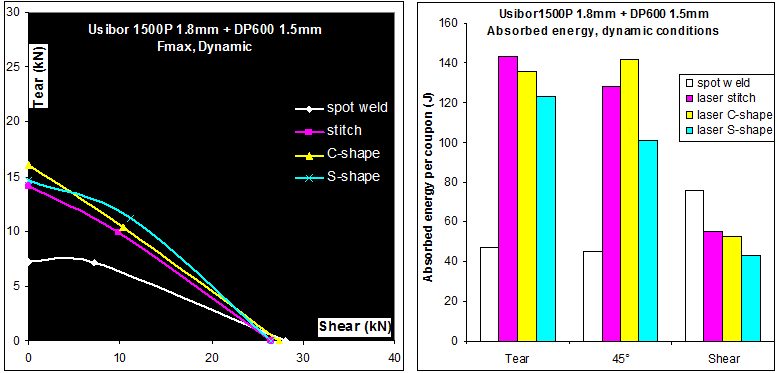
Figure 5: Strength at fracture and energy absorption of HF1500P 1.8-mm + DP 600 1.5-mm samples for various welding conditions. A-16
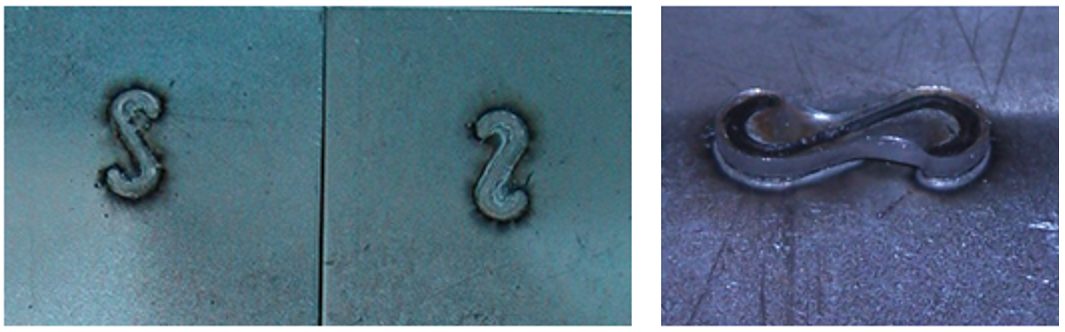
Figure 6: IF fracture mode (left), “plug-out” fracture mode (right).A-16
Figure 7 represents the energy absorbed by omega-shaped structures and the corresponding number of welds that fail during the frontal crash test (here on TRIP 800 grade). It appears clearly that laser stitches have the highest rate of fracture during the crash test (33%). In standard spot welding, some weld fractures also occur. It is known that UHSS are more prone to partial IF fracture on coupons, and some welds fail as well during the crash test. By using either Weld-Bonding or adapted laser welding shape, there is no more weld fractures during the test, even if the parts are severely crashed and deformed. As a consequence, higher energy absorption is also observed.
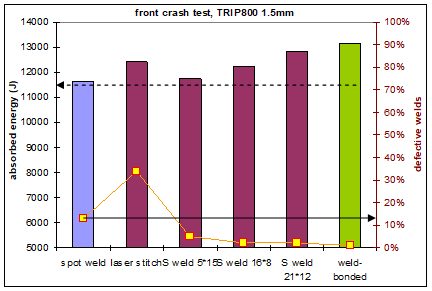
Figure 7: Welding process and weld shape influence on the energy absorption and weld integrity on frontal crash tests. A-16
Regarding stiffness, up to 20% improvement can be obtained. The best results are obtained with continuous joints, and particularly using adhesives. Adhesive bonding and weld- bonding lead to the same results of the stiffness improvement only being due to the adhesive, not to the additional welds.
Figure 8 shows the evolution of the torsional stiffness with the joining process.
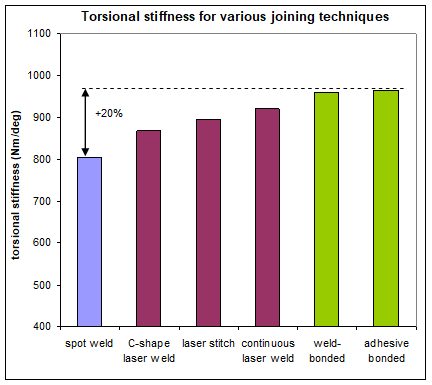
Figure 8: Evolution of the torsional stiffness with the joining process.A-16
Optimized laser joining design leads to same performances as a weld bonded sample regarding fracture modes seen in Figure 9.
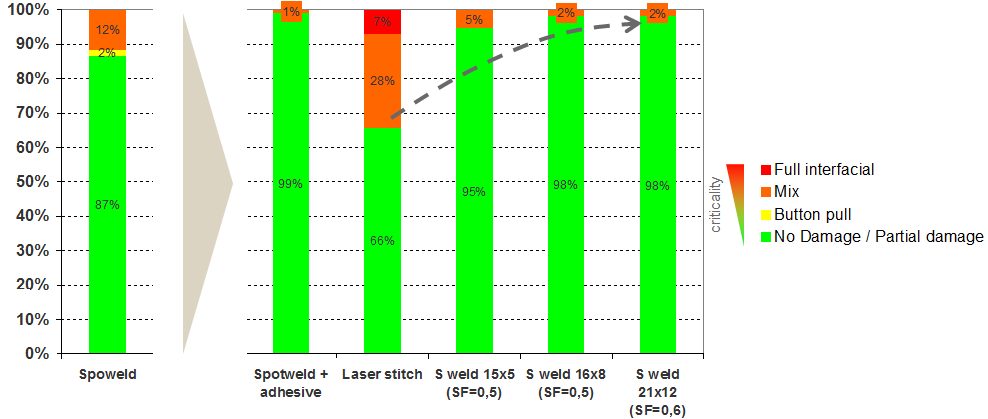
Figure 9: Validation test case 1.2-mmTRIP 800/1.2-mm hat-shaped TRIP 800.
Top-hat crash boxes were tested across a range of AHSS materials including DP 1000. The spot weld’s energy absorbed increased linearly with increasing material strength. The adhesives were not suitable for crash applications as the adhesive peels open along the entire length of the joint. The welded bond samples perform much better than conventional spot welds. Across the entire range of materials there was a 20-30% increase in mean force when WB was used. The implications of such a large increase in crash performance are very significant. The results show that when a 600 MPa steel is weld bonded it can achieve the same crash performance as a 1000 MPa steel in spot-welded condition. It is also possible that some down gauging of materials could be achieved, but as the strength of the crash structure is highly dependent upon sheet thickness only small gage reductions would be possible.
Figure 10 shows the crash results for spot-welded and weld-bonded AHSS.
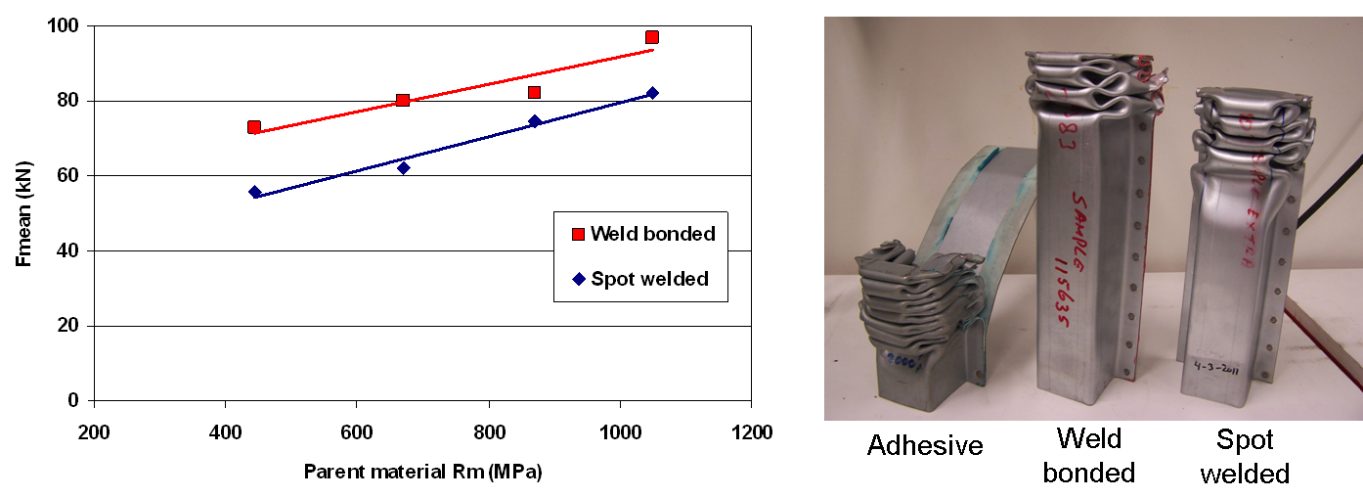
Figure 10: Crash results for spot-welded and weld-bonded AHSS.
There are numerous welding processes available for the welding of AHSS in automotive applications. Each of these processes has advantages and disadvantages that make them more or less applicable for particular applications. These qualities include joint efficiency, joint fit-up and design, joint strength, and stiffness, fracture mode, and cost effectiveness (equipment cost, production rates, etc.). The following data can allow for comparisons to be made for automotive application welding and joining processes, as well as possible repair substitutions.
Many tests were performed using lap and coach joints, reduced specimen overlap distance, and adjusted weld sizes to more closely represent typical joints consistent with automotive industry acceptance criteria. The tests were aimed at providing a baseline reference for a wide variety of welding and joining processes and material combinations. In general, there was no correlation between joint efficiency, normalized energy, and normalized stiffness. Joint efficiency was calculated by dividing the peak load of the joint by the peak load of the parent metal. Some processes, joint configurations and material combinations have high joint efficiency and energy, while others result in high joint efficiency but low energy. Few processes showed high values for all metrics across all materials and joint configurations (Figure 11). It was observed that peak loads tended to increase, on average, as material strength increased for lap joints (Figure 12). However, joint efficiency generally decreased as material strength increased. Therefore, joint strength did not increase in proportion to parent material strength increase for most of the processes and materials studied. Coach joints generally showed lower joint efficiency and stiffness than lap joints (Figure 13). Process and material combinations should be selected based on the required performance, joint design, and cost.A-12
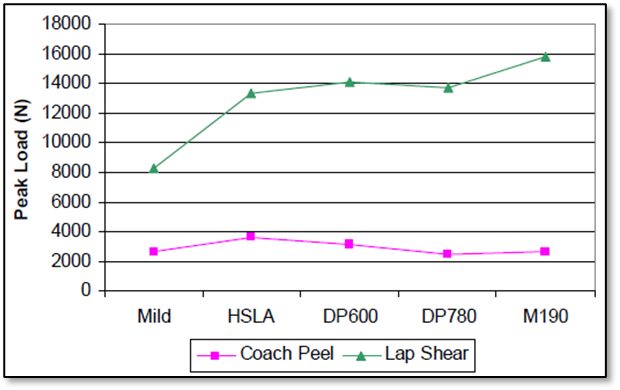
Figure 11: Average peak loads (all processes combined).A-12
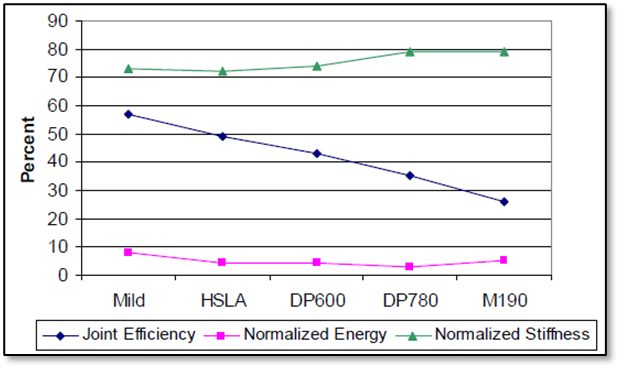
Figure 12: Lap shear average joint efficiency, normalized energy and stiffness (all processes combined).A-12
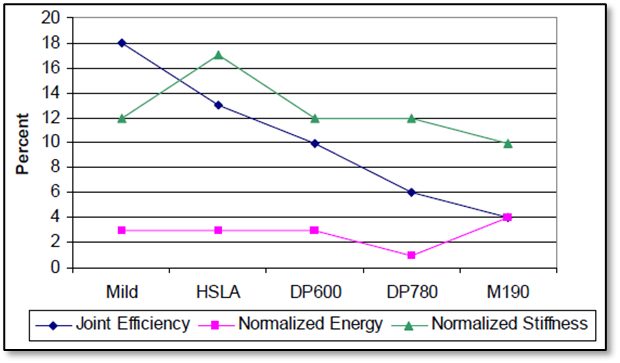
Figure 13: Coach peel average joint efficiency, normalized energy and stiffness (all processes combined).A-12
All Processes General Comparison
Numerous tests were performed using the most popular automotive joining processes including RSW, GMAW/brazing, laser welding/brazing, mechanical fasteners, and adhesive bonding. Joint efficiency and normalized energy of all the processes were compared for HSLA steels, DP 600 samples, DP 780 samples, and M190 samples. Joint efficiency was calculated as the peak load of the joint divided by the peak load of the parent metal. Energy was calculated as the area under the load/displacement curve up to peak load.
The materials used consisted of 1.2-mm EG HSLA, 1.2-mm galvanized DP 600, 1.0-mm GA DP 780, and 1.0-mm EG M190. The testing configuration matrix (Table 2) lists the materials and process combinations studied. The tolerance of weld lengths is ±10%. Lap-shear joints were centered in the overlap for all processes except lap fillet welds and brazes. Coach-peel joints were centered in the overlap for all processes (Figure 14). A-12
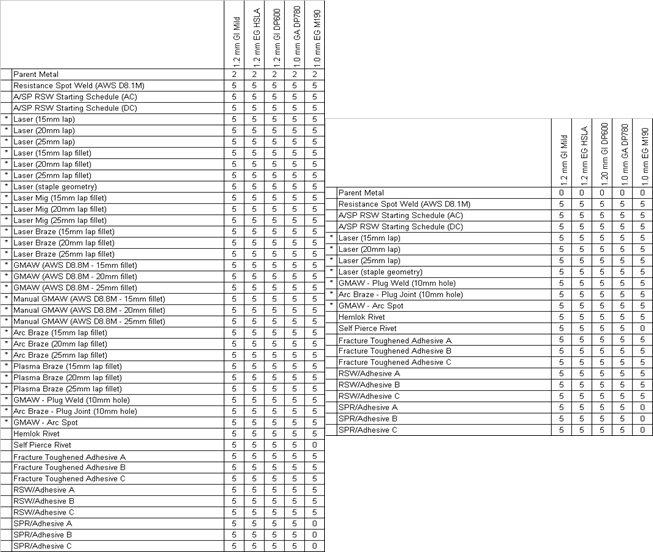
Table 2: Lap-shear (left) and coach-peel (right) test configuration matrix.A-12
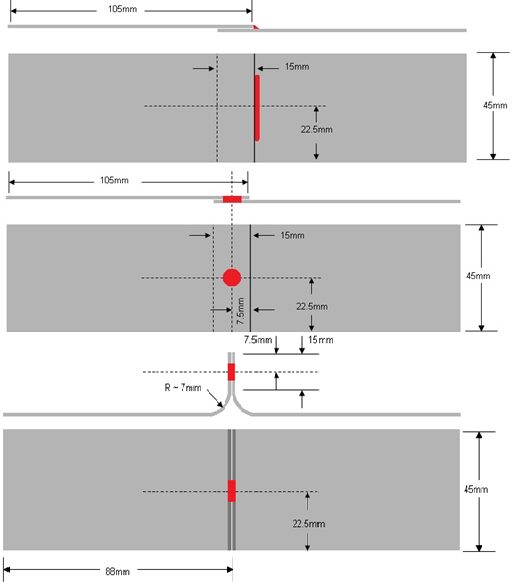
Figure 14: Lap-shear and coach-peel set-up.A-12
DP 600 samples, DP 780 samples, and M190 samples. Joint efficiency was calculated as the peak load of the joint divided by the peak load of the parent metal. Energy was calculated as the area under the load/displacement curve up to peak load.
Self-piercing riveting with adhesive gave the greatest overall joint efficiency for the HSLA lap shear tests, while laser obtained the largest normalized energy (Figure 15a and 15b).
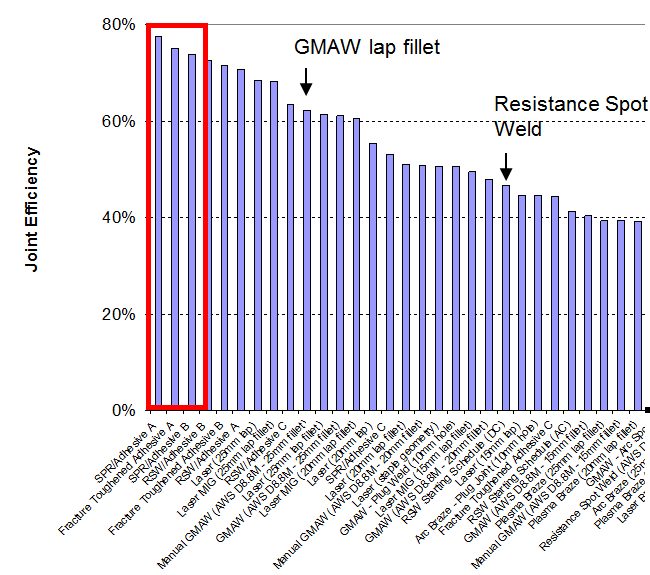
Figure 15a: Joint efficiency of HSLA lap-shear tests for all processes.A-12
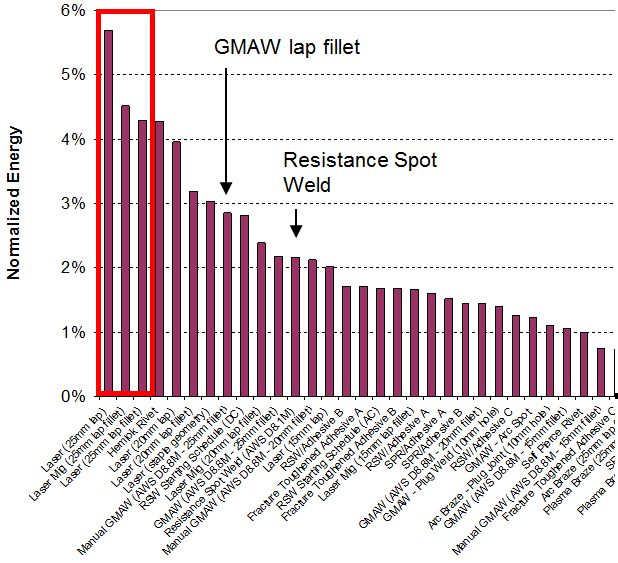
Figure 15b: Normalized energy of HSLA lap-shear tests for all processes.A-12
Self-penetrating riveting with adhesive gave the greatest overall values for both joint efficiency and normalized energy for lap shear testing of DP 600 samples (Figure 16a and 16b). However, coach peel testing of DP 600 obtained the best results with laser welding (Figure 17).
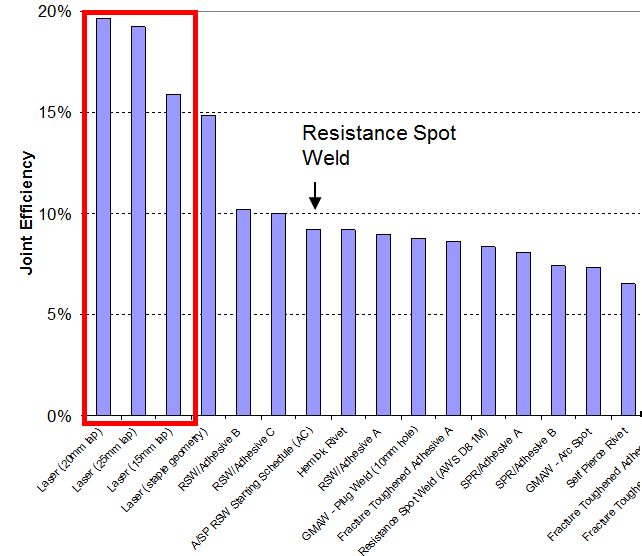
Figure 17a: Joint efficiency of DP 600 lap shear for all processes.A-12
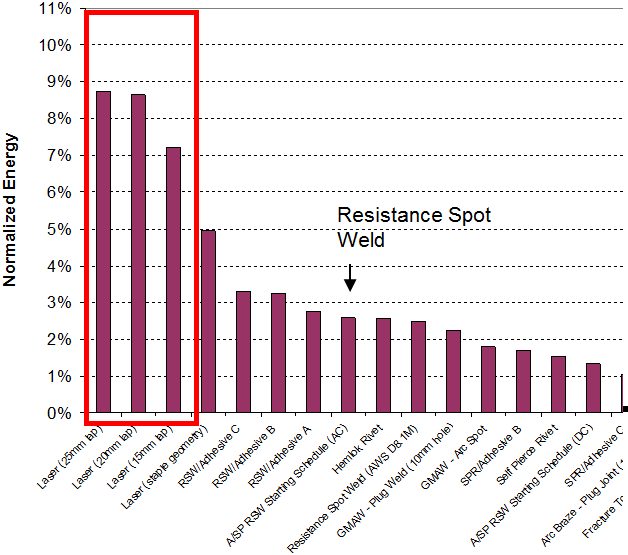
Figure 16b: Normalized energy of DP 600 lap shear for all processes.A-12
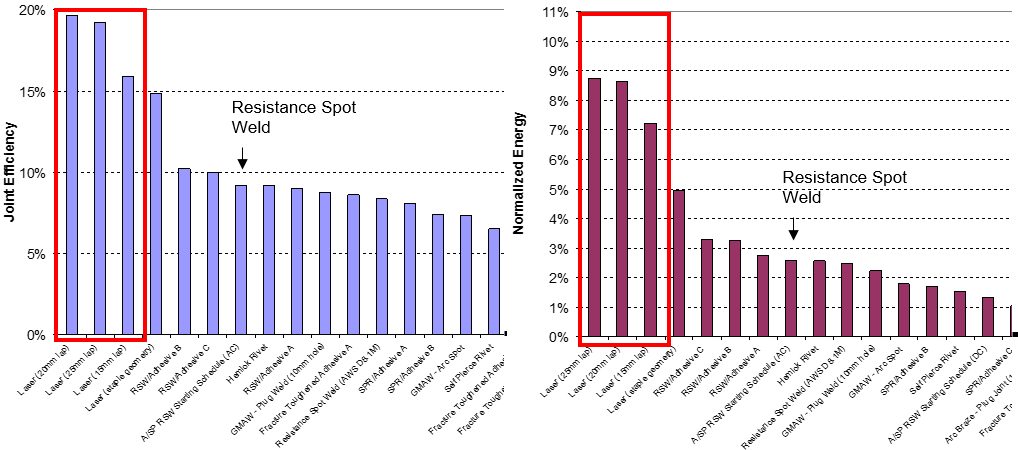
Figure 17: Joint efficiency and normalized energy of DP 600 coach peel for all processes.A-12
For the DP 780 lap-shear test, the best results out of all the tested processes were from laser/MIG welding, leading in both joint efficiency and normalized energy (Figure 18). Full laser welding produced the best results for coach-peel tests of the DP 780 samples (Figure 19).
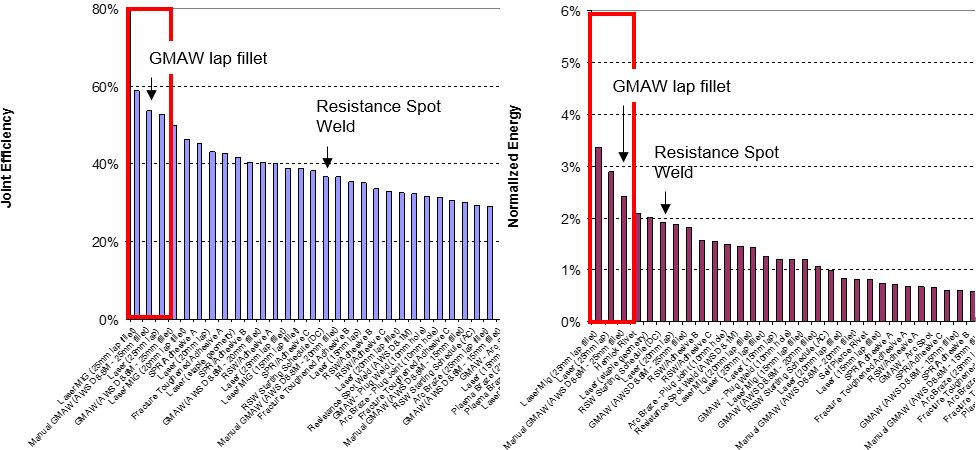
Figure 18: Joint efficiency and normalized energy of DP 780 lap shear for all processes.A-12
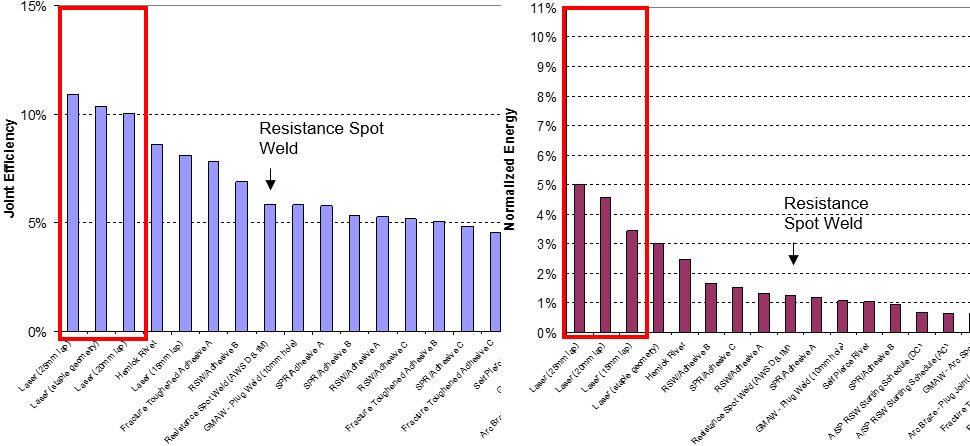
Figure 19: Joint efficiency and normalized energy of DP 780 coach peel for all processes.A-12
The M190 lap-shear samples had the best joint efficiency using RSW with adhesive, but full laser welding gave better normalized energy (Figure 20). The coach peel tests also had the best normalized energy with full laser welding. The best joint efficiency of the coach peel tests was produced from laser welding with staples (Figure 21).
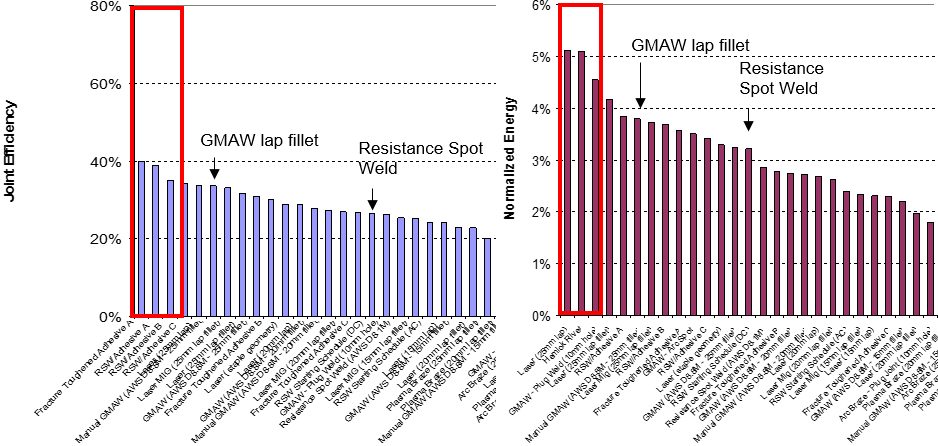
Figure 20: Joint efficiency and normalized energy of M190 lap shear for all processes.A-12
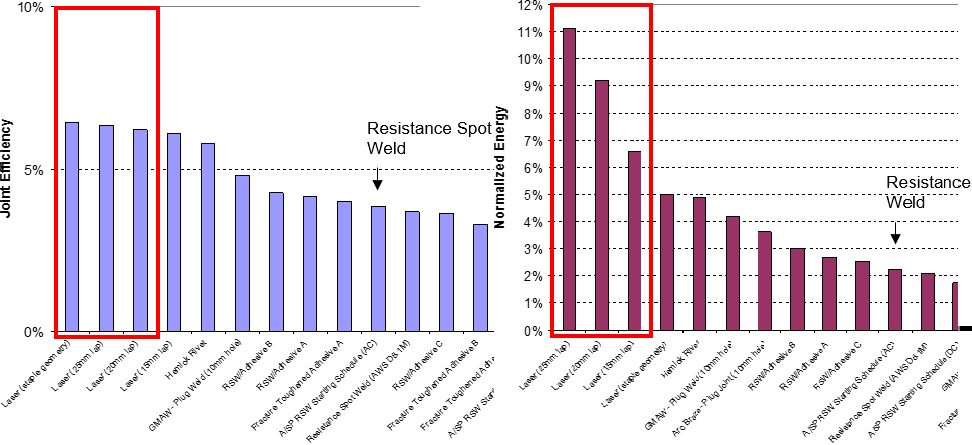
Figure 21: Joint efficiency and normalized energy of M190 coach peel for all processes.A-12
Cost Effectiveness Comparison: Spot Welding to Spot/Laser Welding Mixture
When automotive manufacturers are weighing the advantages and disadvantages of RSW to those of a spot/laser welding mixture process, cost effectiveness is a major concern. Spot/laser mixture welding has 38% lower operation cost compared to full spot welding because the laser installation performs more welds than a spot welding robot. Also, there are fewer robots to maintain and less consumables. The global cost is similar, but the spot/laser solution is about 4% less expensive overall. Figure 22 shows a cost comparison of spot welding and spot/laser welding.
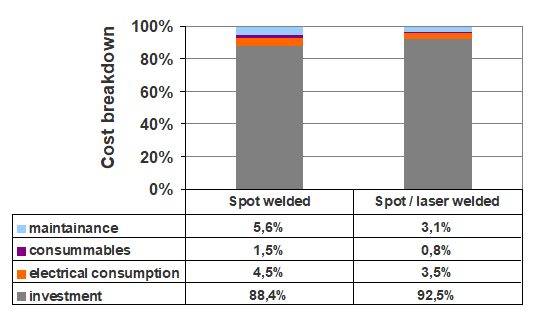
Figure 22: Cost comparison of spot welding and spot/laser welding.A-16
GMAW Compared to Laser Welding
When comparing the advantages and disadvantages of GMAW to those of laser welding in automotive applications, joint efficiency is a key subject. Numerous welds were made using both processes on 15- and 25-mm-thick pieces of materials varying in strength. All results showed that laser welding continuously had greater joint efficiency than GMAW (Figure 23).
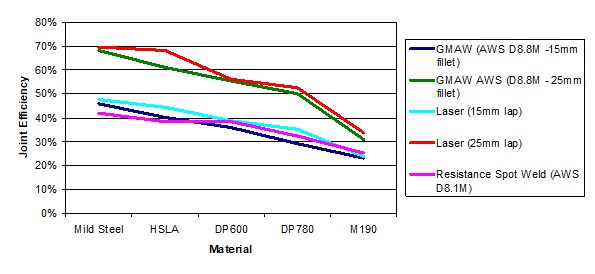
Figure 23: Joint efficiency of GMAW and laser welding for various steel strengths.
Back To Top
RSW Modelling and Performance
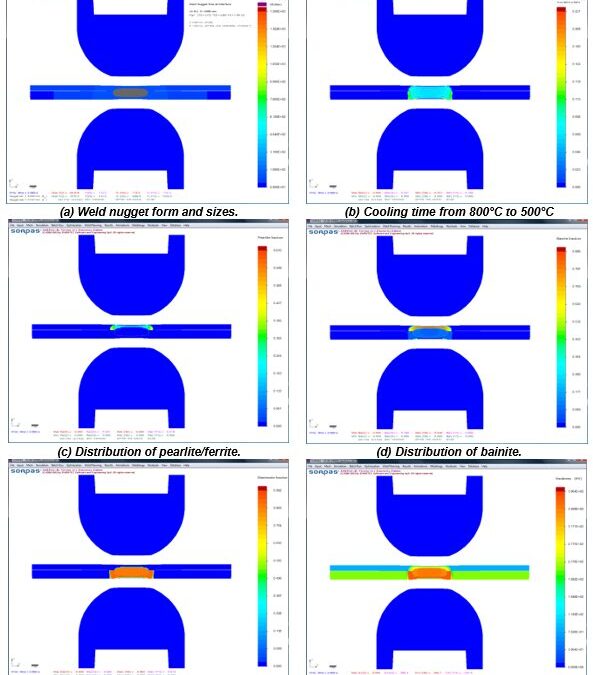
The advantages of numerical simulations for resistance welding are obvious for saving time and reducing costs in product developments and process optimizations. Today’s modeling techniques can predict temperature, microstructure, stress, and hardness distribution in the weld and Heat Affected Zone (HAZ) after welding. Commercial modeling software is available which considers material type, various current modes, machine characteristics, electrode geometry, etc. An example of process simulation results for spot welding of 0.8-mm DC 06 low-carbon steel to 1.2-mm DP 600 steel is shown in Figure 1. Obviously, this technique can apply to dissimilar thicknesses, material types, and geometries. Application of adhesives is also being used with these simulations. This simulation techniques are found to be very beneficial to predict vehicle crashworthiness as it can dramatically reduce the cost of crash evaluations.
You will find several articles in this section describing RSW modelling studies and procedures.
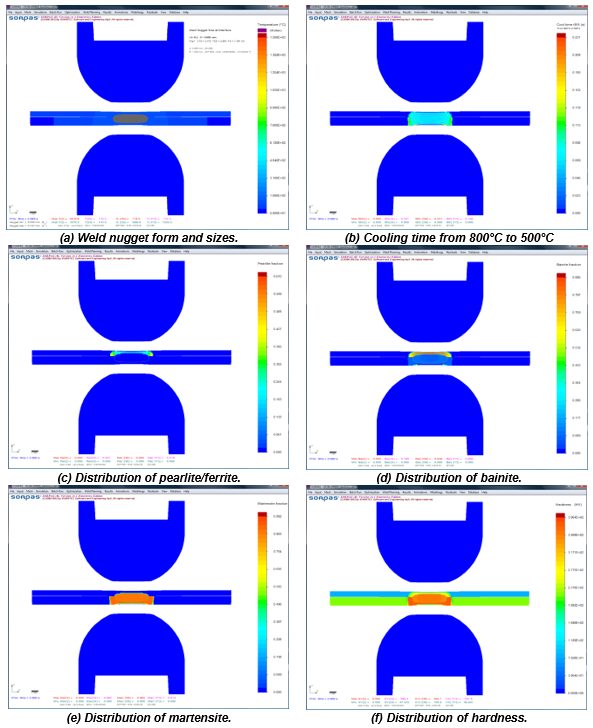
Figure 1: Simulation results with microstructures and hardness distribution for spot welding of 0.8-mm DC06 low-carbon steel to 1.2-mm DP 600 steel.Z-1
Blog, RSW Joint Performance Testing
top-of-page
Results of a Three-Year LME Study
WorldAutoSteel releases today the results of a three-year study on Liquid Metal Embrittlement (LME), a type of cracking that is reported to occur in the welding of Advanced High-Strength Steels (AHSS).The study results add important knowledge and data to understanding the mechanisms behind LME and thereby finding methods to control and establish parameters for preventing its occurrence. As well, the study investigated possible consequences of residual LME on part performance, as well as non-destructive methods for detecting and characterizing LME cracking, both in the laboratory and on the manufacturing line (Figure 1).
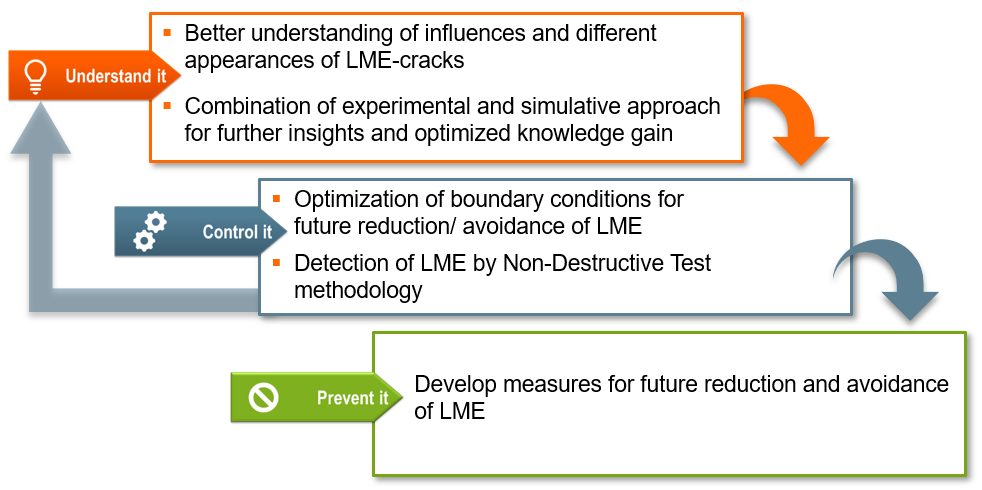
Figure 1: LME Study Scope
The study encompassed three different research fields, with an expert institute engaged for each:
- Laboratory of Materials and Joining Technology (LWF) Paderborn University, Paderborn, Germany, for experimental research,
- The Institute de Soudure, Yutz, France, for investigations regarding non-destructive testing, and
- Fraunhofer Institute for Production Systems and Design Technology (IPK), Berlin, Germany, for the development of a simulation model to accurately replicate welding conditions resulting in LME.
A portfolio containing 13 anonymized AHSS grades, including dual phase (DP), martensitic (MS) and retained austenite (RA) with an ultimate tensile strength (UTS) of 800 MPa and higher, was used to set up a testing matrix, which enabled the replication of the most relevant and critical material thickness combinations (MTC). All considered MTCs show a sufficient weldability under use of standard parameters according to SEP1220-2. Additional MTCs included the joining of various strengths and thicknesses of mild steels to select AHSS in the portfolio. Figure 2 provides the welding parameters used throughout the study.
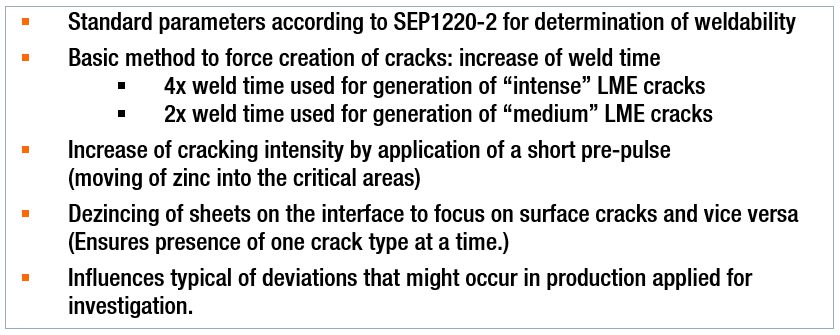
Figure 2: Study Welding Parameters
In parallel, a 3D electro-thermomechanical simulation model was set up to study LME. The model is based on temperature-dependent material data for dual phase AHSS as well as electrical and thermal contact resistance measurements and calculates local heating due to current flow as well as mechanical stresses and strains. It proved particularly useful in providing additional means to mathematically study the dynamics observed in the experimental tests. This model development was documented in two previous AHSS Insights blogs (see AHSS Insights Related Articles below).
Understanding LME
The study began by analyzing different influence factors (Figure 3) which resembled typical process deviations that might occur during car body production. The impact of the influences was analyzed by the degree of cracking observed for each factor. A select number of welding set-ups from these investigations were rebuilt digitally in the simulation model to replicate the process and study its dynamics mathematically. This further enabled the clarification of important cause-effect relationships.
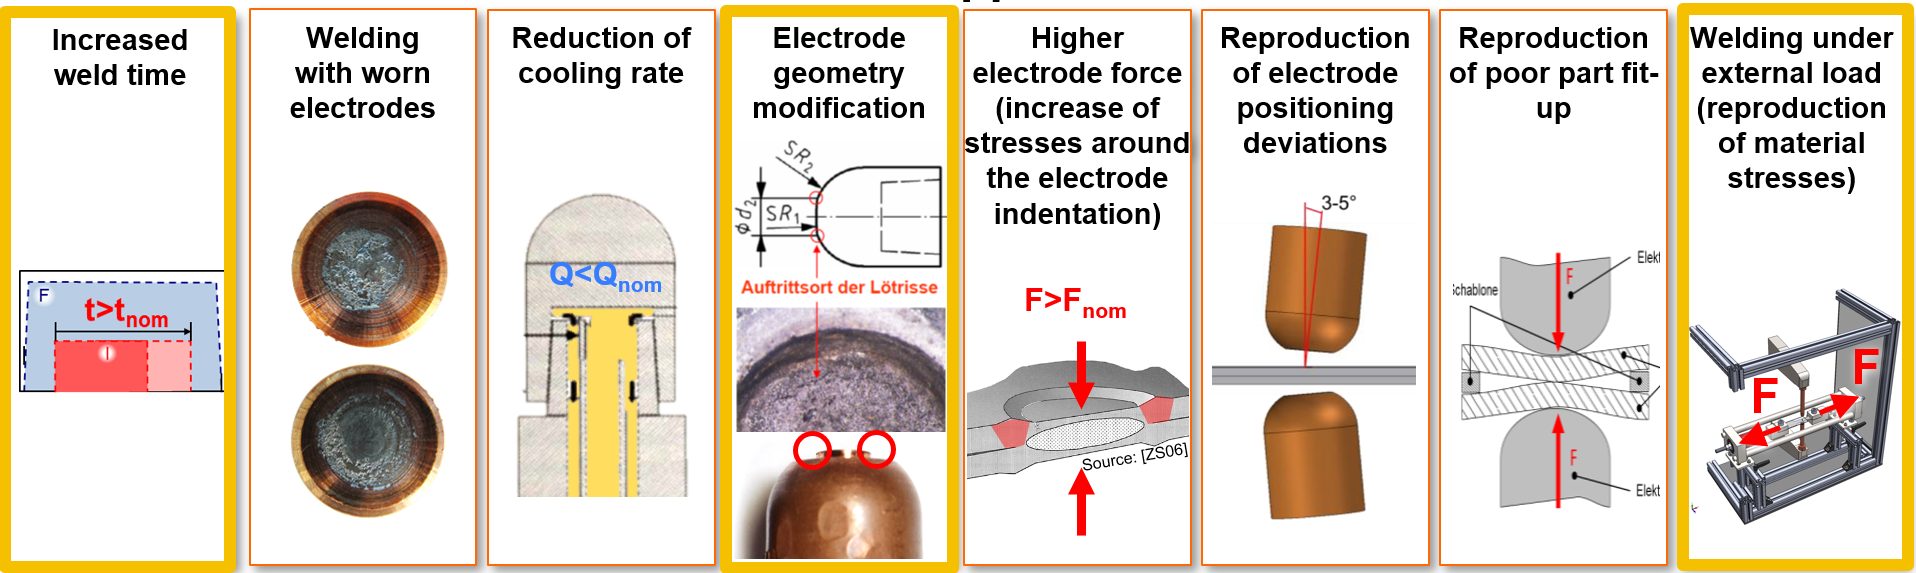
Figure 3: Overview of All Applied Influence Factors (those outlined in yellow resulted in most frequent cracking.)
Generally, the most frequent cracking was observed for sharp electrode geometries, increased weld times and application of external loads during welding. All three factors were closely analyzed by combining the experimental approach with the numerical approach using the simulation model.
Destructive Testing – LME Effects on Mechanical Joint Strength
A destructive testing program also was conducted for an evaluation of LME impact on mechanical joint strength and load bearing capacity in multiple conditions, including quasi-static loading, cyclic loading, crash tests and corrosion. In summary of all load cases, it can be concluded that LME cracks, which might be caused by typical process deviations (e.g. bad part fit up, worn electrodes) have a low intensity impact and do not affect the mechanical strength of the spot weld. And as previously mentioned, the study analyses showed that a complete avoidance of LME during resistance spot welding is possible by the application of measures for reducing the critical conditions from local strains and exposure to liquid zinc.
Controlling LME
In welding under external load experiments, the locations of the experimental crack occurrence showed close correlation with the strains and remaining plastic deformations computed by the simulation model. It was observed that the cracks form at the location of the highest plastic strains, and material-specific threshold values for critical strains were derived. The threshold values then were used to judge the crack formation at elongated weld times.
At the same time, the simulation model pointed out a significant difference in liquid zinc diffusion during elongated weld times. Therefore, it is concluded that liquid zinc exposure time is a second highly relevant factor for LME formation.
The results for the remaining influence factors depended on the investigated MTCs and were generally less significant. In more susceptible MTCs (AHSS welded with thick Mild steel), no significant cracking occurred when welded using standard process parameters. Light cracking was observed for most of the investigated influences, such as low electrode cooling rate, worn electrode caps, electrode positioning deviations or for gap afflicted spot welds. More intense cracking (higher penetration depth cracking) was only observed when welding under extremely high external loads (0.8 Re) or, even more, as a consequence of highly increased weld times.
For the non-susceptible MTCs, even extreme situations and weld set-ups (such as the described elongated weld times) did not result in significant LME cracks within the investigated AHSS grades.
Methods for avoidance of LME also were investigated. Changing the electrode tip geometry to larger working plane diameters and elongating the hold time proved to eliminate LME cracks. In the experiments, a change of electrode tip geometry from a 5.5 mm to an 8.0 mm (Figure 4) enabled LME-free welds even when doubling the weld times above 600 ms. Using a flat-headed cap (with small edge radii or beveled), even the most extreme welding schedules (weld times greater than 1000 ms) did not produce cracks. The in-depth analysis revealed that larger electrode tip geometries clearly reduce the local plastic deformation around the indentation. This plastic strain reduction is particularly important, as longer weld times contribute to a higher liquid zinc exposure interval, leading to a higher potential for LME cracks.
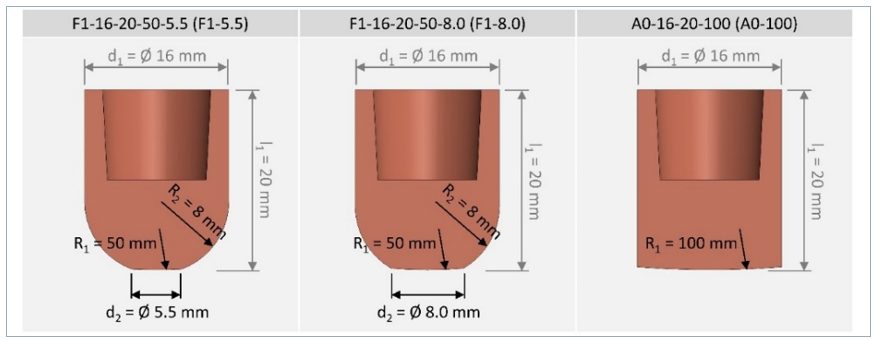
Figure 4: Electrode Geometries Used in Study Experiments
It was also seen that as more energy flows into a spot weld, it becomes more critical to parameterize an appropriate hold time. Depending on the scenario, the selection of the correct hold time alone can make the difference between cracked and crack-free welds. Insufficient hold times allow liquid zinc to remain on the steel surface and increased thermal stresses that form after the lift-off of the electrode caps. Elongated hold times reduce surface temperatures, minimizing surface stresses and thus LME potential.
Non-Destructive Testing: Laboratory and Production Capabilities
A third element of the study, and an aid in the control of LME, is the detection and characterization of LME cracks in resistance spot welds, either in laboratory or in production conditions. This work was done by the Institute of Soudure in close cooperation with LWF, IPK and WorldAutoSteel members’ and other manufacturing facilities. Ten different non-destructive techniques and systems were investigated. These techniques can be complementary, with various levels of costs, with some solutions more technically mature than others. Several techniques proved to be successful in crack detection. In order to aid the production source, techniques must not only detect but also characterize cracks to determine intensity and the effect on joint strength. Further work is required to achieve production-level characterization.
The study report provides detailed technical information concerning the experimental findings and performances of each technique/system and the possible application cost of each. Table 1 shows a summary of results:
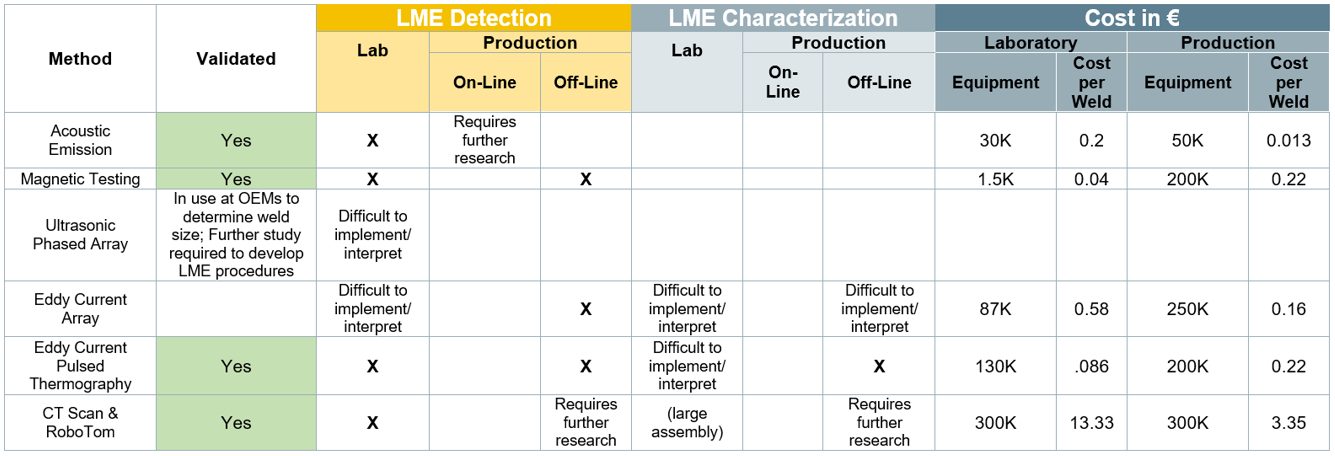
Table 1: Summary of NDT: LME Detection and Characterization Methods
Preventing LME
Suitable measures should always be adapted to the specific use case. Generally, the most effective measures for LME prevention or mitigation are:
- Avoidance of excessive heat input (e.g. excess welding time, current).
- Avoidance of sharp edges on spot welding electrodes; instead use electrodes with larger working plane diameter, while not increasing nugget-size.
- Employing extended hold times to allow for sufficient heat dissipation and lower surface temperatures.
- Avoidance of improper welding equipment (e.g. misalignments of the welding gun, highly worn electrodes, insufficient electrode cooling)
In conclusion, a key finding of this study is that LME cracks only occurred in the study experiments when there were deviations from proper welding parameters and set-up. Ensuring these preventive measures are diligently adhered to will greatly reduce or eliminate LME from the manufacturing line. For an in-depth review of the study and its findings, you can download a copy of the full report at worldautosteel.org.

LME Study Authors
The LME study authors were supported by a committed team of WorldAutoSteel member companies’ Joining experts, who provided valuable guidance and feedback.
Related Articles: More on this study in previous AHSS Insights blogs:
Journal Publications:
- Julian Frei, Max Biegler, Michael Rethmeier, Christoph Böhne & Gerson Meschut (2019) Investigation of liquid metal embrittlement of dual phase steel joints by electro-thermomechanical spot-welding simulation, Science and Technology of Welding and Joining, 24:7, 624-633, DOI: 10.1080/13621718.2019.1582203
- Christoph Böhne, Gerson Meschut, Max Biegler, Julian Frei & Michael Rethmeier (2020) Prevention of liquid metal embrittlement cracks in resistance spot welds by adaption of electrode geometry, Science and Technology of Welding and Joining, 25:4, 303-310, DOI: 10.1080/13621718.2019.1693731
-
Auto/Steel Partnership LME Testing and Procedures
Back To Top