![Considerations When Deciding Whether to Cold Form or Hot Form]()
Automakers contemplating whether a part is cold stamped or hot formed must consider numerous ramifications impacting multiple departments. The considerations below relative to cold stamping are applicable to any forming operation occurring at room temperature such as roll forming, hydroforming, or conventional stamping. Similarly, hot stamping refers to any set of operations using Press Hardening Steels (or Press Quenched Steels), including those that are roll formed or fluid-formed.
Equipment
There is a well-established infrastructure for cold stamping. New grades benefit from servo presses, especially for those grades where press force and press energy must be considered. Larger press beds may be necessary to accommodate larger parts. As long as these factors are considered, the existing infrastructure is likely sufficient.
Progressive-die presses have tonnage ratings commonly in the range of 630 to 1250 tons at relatively high stroke rates. Transfer presses, typically ranging from 800 to 2500 tons, operate at relatively lower stroke rates. Power requirements can vary between 75 kW (630 tons) to 350 kW (2500 tons). Recent transfer press installations of approximately 3000 tons capacity allow for processing of an expanded range of higher strength steels.
Hot stamping requires a high-tonnage servo-driven press (approximately 1000 ton force capacity) with a 3 meter by 2 meter bolster, fed by either a roller-hearth furnace more than 30 m long or a multi-chamber furnace. Press hardened steels need to be heated to 900 °C for full austenitization in order to achieve a uniform consistent phase, and this contributes to energy requirements often exceeding 2 MW.
Integrating multiple functions into fewer parts leads to part consolidation. Accommodating large laser-welded parts such as combined front and rear door rings expands the need for even wider furnaces, higher-tonnage presses, and larger bolster dimensions.
Blanking of coils used in the PHS process occurs before the hardening step, so forces are low. Post-hardening trimming usually requires laser cutting, or possibly mechanical cutting if some processing was done to soften the areas of interest.
That contrasts with the blanking and trimming of high strength cold-forming grades. Except for the highest strength cold forming grades, both blanking and trimming tonnage requirements are sufficiently low that conventional mechanical cutting is used on the vast majority of parts. Cut edge quality and uniformity greatly impact the edge stretchability that may lead to unexpected fracture.
Responsibilities
Most cold stamped parts going into a given body-in-white are formed by a tier supplier. In contrast, some automakers create the vast majority of their hot stamped parts in-house, while others rely on their tier suppliers to provide hot stamped components. The number of qualified suppliers capable of producing hot stamped parts is markedly smaller than the number of cold stamping part suppliers.
Hot stamping is more complex than just adding heat to a cold stamping process. Suppliers of cold stamped parts are responsible for forming a dimensionally accurate part, assuming the steel supplier provides sheet metal with the required tensile properties achieved with a targeted microstructure.
Suppliers of hot stamped parts are also responsible for producing a dimensionally accurate part, but have additional responsibility for developing the microstructure and tensile properties of that part from a general steel chemistry typically described as 22MnB5.
Property Development
Independent of which company creates the hot formed part, appropriate quality assurance practices must be in place. With cold stamped parts, steel is produced to meet the minimum requirements for that grade, so routine property testing of the formed part is usually not performed. This is in contrast to hot stamped parts, where the local quench rate has a direct effect on tensile properties after forming. If any portion of the part is not quenched faster than the critical cooling rate, the targeted mechanical properties will not be met and part performance can be compromised. Many companies have a standard practice of testing multiple areas on samples pulled every run. It’s critical that these tested areas are representative of the entire part. For example, on the top of a hat-section profile where there is good contact between the punch and cavity, heat extraction is likely uniform and consistent. However, on the vertical sidewalls, getting sufficient contact between the sheet metal and the tooling is more challenging. As a result, the reduced heat extraction may limit the strengthening effect due to an insufficient quench rate.
Grade Options for Cold Stamped or Hot Formed Steel
There are two types of parts needed for vehicle safety cage applications: those with the highest strength that prevent intrusion, and those with some additional ductility that can help with energy absorption. Each of these types can be achieved via cold stamping or hot stamping.
When it comes to cold stamped parts, many grade options exist at 1000 MPa that also have decent ductility. The advent of the 3rd Generation Advanced High Strength Steels adds to the tally – the stress-strain curve of a 3ʳᵈ Gen QP980 steel is presented in Figure 1. Most of these top out at 1200 MPa, with some companies offering cold-formable Advanced High Strength Steels with 1400 or 1500 MPa tensile strength. The chemistry of AHSS grades is a function of the specific characteristics of each production mill, meaning that OEMs must exercise diligence when changing suppliers.

Figure 1: Stress-strain curve of industrially produced QP980.W-35
Martensitic grades from the steel mill have been in commercial production for many years, with minimum strength levels typically ranging from 900 MPa to 1470 MPa, depending on the grade. These products are typically destined for roll forming, except for possibly those at the lower strengths, due to limited ductility. Until recently, MS1470, a martensitic steel with 1470 MPa minimum tensile strength, was the highest strength cold formable option available. New offerings from global steelmakers now include MS1700, with a 1700 MPa minimum tensile strength, as well as MS 1470 with sufficient ductility to allow for cold stamping. Automakers have deployed these grades in cold stamped applications such as crossmembers and roof reinforcements, with some applications shown in Figure 2.

Figure 2: Cold-Stamped Martensitic Steel with 1500 MPa Tensile Strength used in the Nissan B-Segment Hatchback.K-57
Until these recent developments, hot stamping was the primary option to reach the highest strength levels in part shapes having even mild complexity. Under proper conditions, a chemistry of 22MnB5 could routinely reach a nominal or aim strength of 1500 MPa, which led to this grade being described as PHS1500, CR1500T-MB, or with similar nomenclature. Note that in this terminology, 1500 MPa nominal strength typically corresponds to a minimum strength of 1300 MPa.
The 22MnB5 chemistry is globally available, but the coating approaches discussed below may be company-specific.
Newer PHS options with a modified chemistry and subsequent processing differences can reach nominal strength levels of 2000 MPa. Other options are available with additional ductility at strength levels of 1000 MPa or 1200 MPa. A special class called Press Quenched Steels have even higher ductility with strength as low as 450 MPa.
The spectrum of grades available for cold-stamped and hot formed steel parts allows automakers to fine-tune the crash energy management features within a body structure, contributing to steel’s “infinite tune-ability” capability which gives automotive engineers design flexibility and freedoms not available from other structural materials.
Corrosion Protection
Uncoated versions of a grade must take a different chemistry approach than the hot dip galvanized (GI) or hot dipped galvannealed (HDGA) versions since the hot dip galvanizing process (Figure 3) acts as a heat treatment cycle that changes the properties of the base steel. Steelmakers adjust the base steel chemistry to account for this heat treatment to ensure the resultant properties fall within the grade requirements.

Figure 3: Schematic of a typical hot-dipped galvanizing line with galvanneal capability.
This strategy has limitations as it relates to grades with increasing amounts of martensite in the microstructure. Complex thermal cycles are needed to produce the highly engineered microstructures seen in advanced steels. Above a certain strength level, it is not possible to create a GI or HDGA version of that grade.
For example, when discussing fully martensitic grades from the steel mill, hot dip galvanizing is not an option. If a martensitic grade needs corrosion protection, then electrogalvanizing (Figure 4) is the common approach since an EG coating is applied at ambient temperature, which is low enough to avoid negatively impacting the properties. Automakers might choose to forgo a galvanized coating if the intended application is in a dry area that is not exposed to road salt.

Figure 4: Schematic of an electrogalvanizing line.
For press hardening steels, coatings serve multiple purposes. Without a coating, uncoated steels will oxidize in the austenitizing furnace and develop scale on the surface. During hot stamping, this scale layer limits efficient thermal transfer and may prevent the critical cooling rate from being reached. Furthermore, scale may flake off in the tooling, leading to tool surface damage. Finally, scale remaining after hot stamping is typically removed by shot blasting, an off-line operation that may induce additional issues.
Using a hot dip galvanized steel in a conventional direct press hardening process (blank -> heat -> form/quench) may contribute to liquid metal embrittlement (LME). Getting around this requires either changing the steel chemistry from the conventional 22MnB5 or using an indirect press hardening process that sees the bulk of the part shape formed at ambient temperatures followed by heating and quenching.
Those companies wishing to use the direct press hardening process can use a base steel having an aluminum-silicon (Al-Si) coating, providing that the heating cycle in the austenitizing furnace is such that there is sufficient time for alloying between the coating and the base steel. Welding practices using these coated steels need to account for the aluminum in the coating, but robust practices have been developed and are in widespread use.
Setting Correct Welding Parameters for Resistance Spot Welding
Specific welding parameters need to be developed for each combination of material type and thickness. In general, Press Hardening Steels require more demanding process conditions. One important factor is electrode force, which is typically higher than needed to weld cold formed steels of the same thickness. The actual recommended force depends on the strength level and the thickness of the steel. Of course, strength and thickness affects the welding machine/welding gun force capability requirement.
The welding current level, and more importantly, the current range are both important. The current range is one of the best indicators of welding process robustness, so it is sometimes described as the welding process window. Figure 5 indicates the relative range of current required for spot welding different steel types. A smaller process window may require more frequent weld quality evaluations, such as for adequate weld size, necessitating more frequent corrective actions to address the discovered quality concern.

Figure 5: Relative Current Range (process windows) for Different Steel Types
Effect of Coating Type on Weldability
When resistance spot welding coated steels, the coating must be removed from the weld area during and in the beginning of the weld cycle to allow a steel-to-steel weld to occur. The combination of welding current, weld time, and electrode force are responsible for this coating displacement.
For all coated steels, the ability of the coating to flow is a function of the coating type and properties such as electrical resistivity and melting point, as well as the coating thickness.
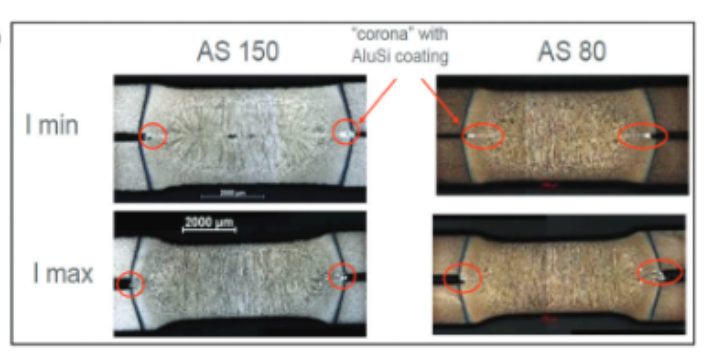
Cross sectioned spot welds made on press hardened steel with different coating weights of an Aluminum -Silicon coating is presented in Figure 6. Note the displaced coating at the periphery of weld. Figure 7 shows the difference in current range required to produce acceptable welds associated with these different coating weights. The thicker coating shows a smaller current range. In addition, the press-hardened Al-Si coating has a much higher melting point than the zinc coatings typically found on cold stamped steels, making it more difficult to displace from the weld area.

Figure 6: Aluminum -Silicon coated press hardened steels.O-16
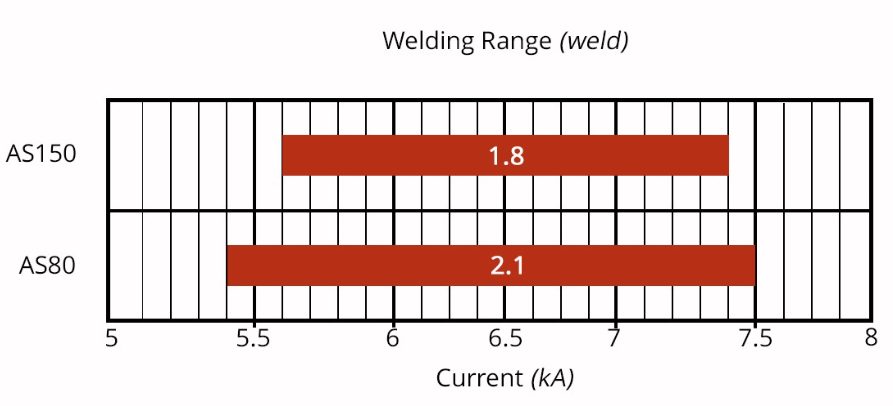
Figure 7: Influence of Aluminum-Silicon coating weight on welding range.O-16
Liquid Metal Embrittlement and Resistance Spot Welding
Cold-formable, coated, Advanced High Strength Steels are widely used in automotive applications. One welding issue these materials encounter is increased hardness in the weld area, that may result in brittle fracture of the weld. Another issue is their sensitivity to Liquid Metal Embrittlement (LME) cracking.
Both issues are discussed in detail in the Joining section of the WorldAutoSteel AHSS Guidelines website and the WorldAutoSteel Phase 2 Report on LME.
Resistance Spot Welding Using Current Pulsation
The most effective solution for these issues is using current pulsation during the welding cycle, schematically described in Figure 8.

Figure 8: Nugget growth differences in Single Pulse vs. Multi-Pulse Welding
Pulsation of the current allows much better control of the heat generation and weld nugget development. Pulsation variables include the number of pulses (typically 2 to 4), current, time for each pulse, and the cool time between the pulses.
Pulsation during Resistance Spot Welding is beneficial for press hardening steels, coated cold stamped steels of all grades, and multi-material stack-ups. Information about multi-sheet, multi-material stack-ups can be – as described in our articles on 3T/4T and 5T Stack-Ups
For more information about PHS grades and processing, see our Press Hardened Steel Primer.
Thanks are given to Eren Billur, Ph.D., Billur MetalForm for his contributions to the Equipment section, as well as many of the webpages relating to Press Hardening Steels at www.AHSSinsights.org.
Blog, homepage-featured-top, main-blog
Equipment, Responsibilities, and Property Development Considerations When Deciding How A Part Gets Formed
Automakers contemplating whether a part is cold stamped or hot formed must consider numerous ramifications impacting multiple departments. Over a series of blogs, we’ll cover some of the considerations that must enter the discussion.
The discussions relative to cold stamping are applicable to any forming operation occurring at room temperature such as roll forming, hydroforming, or conventional stamping. Similarly, hot stamping refers to any set of operations using Press Hardening Steels (or Press Quenched Steels), including those that are roll formed or fluid-formed.
Equipment
There is a well-established infrastructure for cold stamping. New grades benefit from servo presses, especially for those grades where press force and press energy must be considered. Larger press beds may be necessary to accommodate larger parts. As long as these factors are considered, the existing infrastructure is likely sufficient.
Progressive-die presses have tonnage ratings commonly in the range of 630 to 1250 tons at relatively high stroke rates. Transfer presses, typically ranging from 800 to 2500 tons, operate at relatively lower stroke rates. Power requirements can vary between 75 kW (630 tons) to 350 kW (2500 tons). Recent transfer press installations of approximately 3000 tons capacity allow for processing of an expanded range of higher strength steels.
Hot stamping requires a high-tonnage servo-driven press (approximately 1000 ton force capacity) with a 3 meter by 2 meter bolster, fed by either a roller-hearth furnace more than 30 m long or a multi-chamber furnace. Press hardened steels need to be heated to 900 °C for full austenitization in order to achieve a uniform consistent phase, and this contributes to energy requirements often exceeding 2 MW.
Integrating multiple functions into fewer parts leads to part consolidation. Accommodating large laser-welded parts such as combined front and rear door rings expands the need for even wider furnaces, higher-tonnage presses, and larger bolster dimensions.
Blanking of coils used in the PHS process occurs before the hardening step, so forces are low. Post-hardening trimming usually requires laser cutting, or possibly mechanical cutting if some processing was done to soften the areas of interest.
That contrasts with the blanking and trimming of high strength cold-forming grades. Except for the highest strength cold forming grades, both blanking and trimming tonnage requirements are sufficiently low that conventional mechanical cutting is used on the vast majority of parts. Cut edge quality and uniformity greatly impact the edge stretchability that may lead to unexpected fracture.
Responsibilities
Most cold stamped parts going into a given body-in-white are formed by a tier supplier. In contrast, some automakers create the vast majority of their hot stamped parts in-house, while others rely on their tier suppliers to provide hot stamped components. The number of qualified suppliers capable of producing hot stamped parts is markedly smaller than the number of cold stamping part suppliers.
Hot stamping is more complex than just adding heat to a cold stamping process. Suppliers of cold stamped parts are responsible for forming a dimensionally accurate part, assuming the steel supplier provides sheet metal with the required tensile properties achieved with a targeted microstructure.
Suppliers of hot stamped parts are also responsible for producing a dimensionally accurate part, but have additional responsibility for developing the microstructure and tensile properties of that part from a general steel chemistry typically described as 22MnB5.
Property Development
Independent of which company creates the hot formed part, appropriate quality assurance practices must be in place. With cold stamped parts, steel is produced to meet the minimum requirements for that grade, so routine property testing of the formed part is usually not performed. This is in contrast to hot stamped parts, where the local quench rate has a direct effect on tensile properties after forming. If any portion of the part is not quenched faster than the critical cooling rate, the targeted mechanical properties will not be met and part performance can be compromised. Many companies have a standard practice of testing multiple areas on samples pulled every run. It’s critical that these tested areas are representative of the entire part. For example, on the top of a hat-section profile where there is good contact between the punch and cavity, heat extraction is likely uniform and consistent. However, on the vertical sidewalls, getting sufficient contact between the sheet metal and the tooling is more challenging. As a result, the reduced heat extraction may limit the strengthening effect due to an insufficient quench rate.
For more information, see our Press Hardened Steel Primer to learn more about PHS grades and processing!
Thanks are given to Eren Billur, Ph.D., Billur MetalForm for his contributions to the Equipment section, as well as many of the webpages relating to Press Hardening Steels at www.AHSSinsights.org.

Danny Schaeffler is the Metallurgy and Forming Technical Editor of the AHSS Applications Guidelines available from WorldAutoSteel. He is founder and President of Engineering Quality Solutions (EQS). Danny wrote the monthly “Science of Forming” and “Metal Matters” column for Metalforming Magazine, and provides seminars on sheet metal formability for Auto/Steel Partnership and the Precision Metalforming Association. He has written for Stamping Journal and The Fabricator, and has lectured at FabTech. Danny is passionate about training new and experienced employees at manufacturing companies about how sheet metal properties impact their forming success.
Blog, homepage-featured-top, main-blog
Advanced High-Strength Steel (AHSS) products have significantly different forming characteristics and these challenge conventional mechanical and hydraulic presses. Some examples include the dramatically higher strength of these new steels resulting in higher forming loads and increased springback. Also, higher contact pressures cause higher temperatures at the die-steel interface, requiring high performance lubricants and tool steel inserts with advanced coatings.
These and other challenges lead to issues with the precision of part formation and stamping line productivity. Using a servo-driven press is one approach to address the challenges of forming and cutting AHSS grades. Recent growth in the use of servo presses in the automotive manufacturing industry parallels the increased use of AHSS in the body structure of new automobiles. Click to read more about the Characteristics of Servo Presses and their Advantages.
Figure 1 shows the difference between the available motions of flywheel-driven mechanical presses verses servo driven mechanical presses. The slide motion of the servo press can be programmed for more parts per minute, decreased drawing speed to reduce quality errors, or dwelling or re-striking at bottom dead center to reduce springback.

Figure 1: Comparison of Press Signatures in Fixed Motion Mechanical Presses and Free-Motion Servo-Driven Presses.M-3
Press Force and Press Energy
Categorizing both mechanical and hydraulic presses requires three different capacities or ratings – force, energy, and power. Historically, when making parts out of mild steel or even some HSLA steels, using the old rules-of-thumb to estimate forming loads was sufficient. Once the tonnage requirements and some processing requirements were known, stamping could occur in whichever press met those minimum tonnage and bed size requirements.
In these cases, press capacity (for example, 1000 kN) is a suitable number for the mechanical characteristics of a stamping press. Capacity, or tonnage rating, indicates the maximum force that the press can apply without damaging its components, like the machine frame, slide-adjusting mechanisms, pitman (connection rods) or main gear bushings.
A servo press transmits force (not energy) the same way as the equivalent conventional press (mechanical or hydraulic). However, the amount of force available throughout the stroke depends on whether the press is hydraulic or mechanically driven. Hydraulic presses can exert maximum force during the entire stroke as tonnage generation occurs via hydraulic fluid, pumps, and cylinders. Mechanical presses exert their maximum force at a specific distance above bottom dead center (BDC), usually defined at 0.5 inch. At increased distances above bottom dead center, the loss of mechanical advantage reduces the tonnage available for the press to apply. This phenomenon is known as de-rated tonnage, and it applies to conventional mechanical presses as well as servo-mechanical presses. Figure 2 shows a typical press-force curve for a 600-ton mechanical press. In this example, when the press is approximately 3 inches off BDC, the maximum tonnage available is only 250 tons – significantly less than the 600-ton rating.

Figure 2: The Press-Force curve shows the maximum tonnage a mechanical press can apply based on the position of the slide relative to the bottom dead center reference distance. This de-rated tonnage applies to both conventional mechanical presses as well as servo-mechanical presses.E-2
Press energy reflects the ability to provide that force over a specified distance (draw depth) at a given cycle rate. Figure 3 shows a typical press-energy curve for the same 600-ton mechanical press. The energy available depends on the size and speed of the flywheel, as well as the size of the main drive motor. As the flywheel rotates faster, the amount of stored energy increases, reflected in the first portion of the curve. The cutting or forming process consumes energy, which the drive motor must replenish during the nonworking part of the stroke. At faster speeds, the motor has less time to restore the energy. If the energy cannot be restored in time, the press stalls. The graph illustrates how the available energy of the press diminishes to 25% of the rated capacity when accompanied by a speed reduction from 24 strokes per minute to 12 strokes per minute.

Figure 3: A representative press-energy curve for a 600 ton mechanical press. Reducing the stroke rate from 24 to 12 reduces available energy by 75%.E-2
Case Study: Press Force and Press EnergyH-3
Predicting the press forces needed initially to form a part is known from a basic understanding of sheet metal forming. Different methods are available to calculate drawing force, ram force, slide force, or blankholder force. The press load signature is an output from most forming-process development simulation programs, as well as special press load monitors. The topic of press force predictions will be covered in this Blog in the months ahead.
Most structural components include design features to improve local stiffness. Typically, forming of the features requiring embossing processes occurs near the end of the stroke near Bottom Dead Center. Predicting forces needed for such a process is usually based on press shop experiences applicable to conventional steel grades. To generate comparable numbers for AHSS grades, forming process simulation is recommended.
In Citation H-3, stamping simulations evaluated the forming of a cross member having a hat-profile with an embossment formed at the end of the stroke (Figure 4). The study simulated press forces and press energy involved for drawing and embossing a channel section from four steel grades approximately 1.5 mm thick: mild steel, HSLA 250/350, HSLA 350/450, and DP 350/600. Figures 5A and 5B clearly show that the embossing phase rather than the drawing phase dominates the total force and energy requirements, even though the punch travel for embossing is only a fraction of the drawing depth.

Figure 4: Cross section of a component having a longitudinal embossment to improve local stiffness.H-3
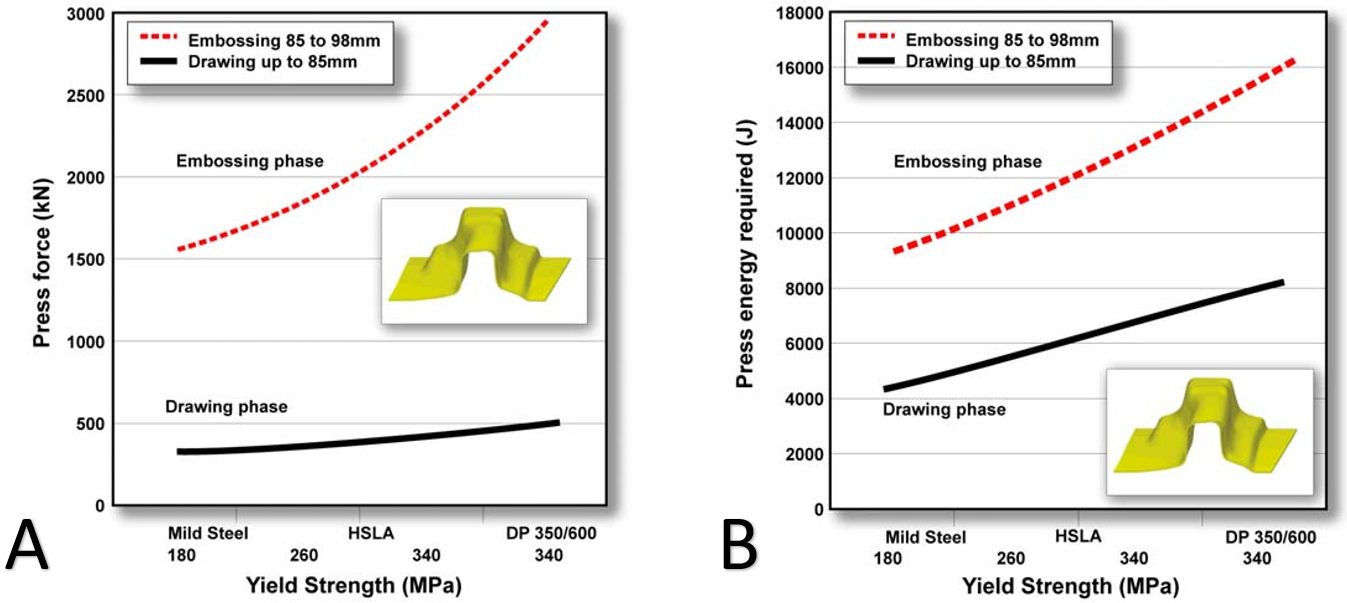
Figure 5: Embossing requires significantly more (A) force and (B) energy than drawing, even though the punch travel in the embossing stage is much smaller.H-3
Figures 6 and 7 highlight the press energy requirements, showing the greater energy required for higher strength steels. The embossment starts to form at a punch displacement of 85 mm, indicated by the three dots in Figure 6. The last increment of punch travel to 98 mm requires significantly higher energy, as shown in Figure 7. Note that compared with mild steel, the dual phase steel grade requires significantly more energy to form the part to home with the 98 mm travel.

Figure 6: Energy needed to form the component increases for higher strength steel grades. Forming the embossment begins at 85 mm of punch travel, indicated by the 3 dots.H-3

Figure 7: Additional energy required to form the embossment increases for higher strength steel grades.H-3
It is not only embossments that require substantially more force and energy at the end of the stroke. Stake beads for springback control engage late in the stroke to provide sidewall stretch. Depending on the design of the forming process, the steel into which the stake beads engage may have passed through conventional draw beads for metal flow control, and therefore are work-hardened to an even higher strength. This leads to greater requirements for die closing force and energy. Certain draw-bead geometries which demand different closing conditions around the periphery of the stamping also may influence closing force and energy requirements.
A more detailed Press Requirements article contains additional information and case studies. Read it here >>>
Press Requirements
AHSS products have significantly different forming characteristics and these challenge conventional mechanical and hydraulic presses. The dramatically higher strength of these new steels result in higher forming loads and increased springback. Higher contact pressures cause higher temperatures at the die-steel interface, requiring high performance lubricants and tool steel inserts with advanced coatings. Although the decrease in ductility is not as severe as seen with HSLA grades of a similar strength level, there is a reduction in formability. Further complicating matters is that in addition to traditional stamping failures due to necking when the part strains exceed the forming limit curve, AHSS grades have additional failure modes such as reduced bendability and cut edge ductility (collectively called local formability failure modes) which are not predicted using current analytical techniques.
These challenges lead to issues with the precision of part formation and stamping line productivity. The stamping industry is developing more advanced die designs as well as advanced manufacturing techniques to help reduce fractures and scrap associated with AHSS stamped on traditional presses. Using a servo-driven press is one approach to address the challenges of forming and cutting AHSS grades. Recent growth in the use of servo presses in the automotive manufacturing industry parallels the increased use of AHSS in the body structure of new automobiles.
Characteristics of Servo Presses
A servo press uses a servomotor as the drive source. Servo press systems are more flexible than flywheel-driven presses and are both faster and more accurate than hydraulic presses. A servomotor allows for control of the position, direction, and speed of the output shaft in contrast to a constant cycle speed of flywheel driven presses, for example. New forming techniques take advantage of this flexibility, achieving more complex part geometries while maintaining dimensional precision.
Mechanical presses are powered by an electric motor that drives a large flywheel. The flywheel stores kinetic energy, which is released through various drive types like cranks, knuckle joints, and linkages. Powering hydraulic presses are electric motors which drive hydraulic cylinders to move the ram up or down.
Servo-driven presses can be either mechanical or hydraulic. In servo-mechanical presses, the high-powered servo motor allows for direct driving of the mechanical press without using a flywheel and clutch. Up to the rated speed, maximum torque is available. Beyond this rated speed, the available torque decreases until reaching the maximum speed. If forming speeds remain below this rated speed, servo presses may have an advantage over flywheel driven presses since full tonnage is available even at lower strokes per minute. This is a useful feature if heat build-up limits how fast the part is capable of running.
Traditional hydraulic presses use variable volume pumps powered by constant velocity electric motors. Servo-hydraulic presses either combine conventional electric motors with servo (proportional) valves or pair servo motors with simple pumps and valves. Typically, servo-hydraulic presses reach higher slide speeds than conventional hydraulic presses, but usually are not faster than servo-mechanical presses over a complete cycle. Due to this advantage, most automotive stampers use servo-mechanical presses.
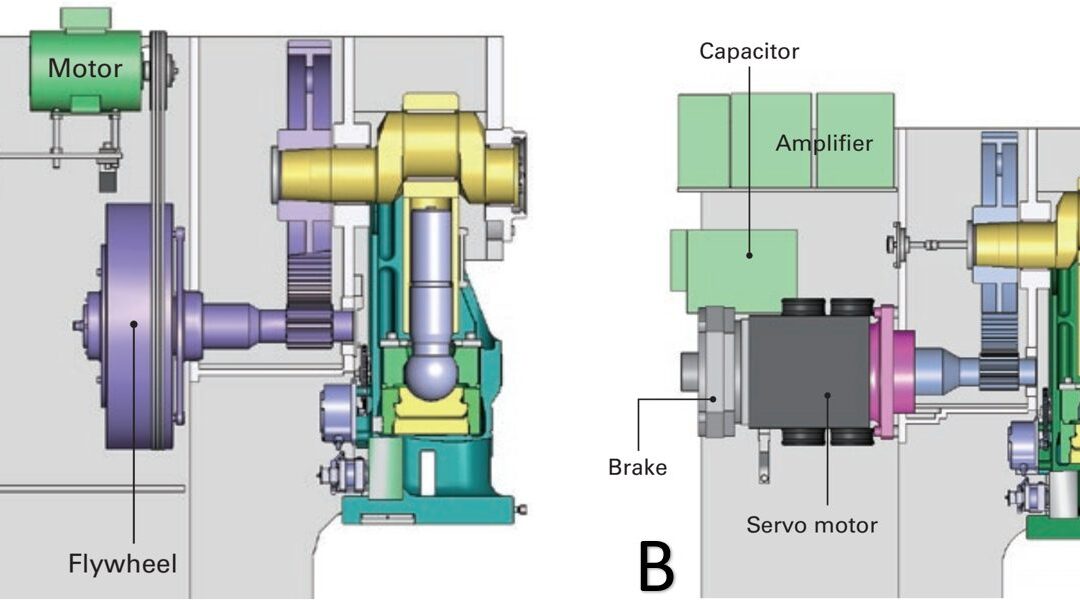
For both servo-mechanical and servo-hydraulic presses, the other press components remain the same as conventional presses. Figure 1 compares pertinent elements of a flywheel-driven mechanical press with one driven by a servo motor.
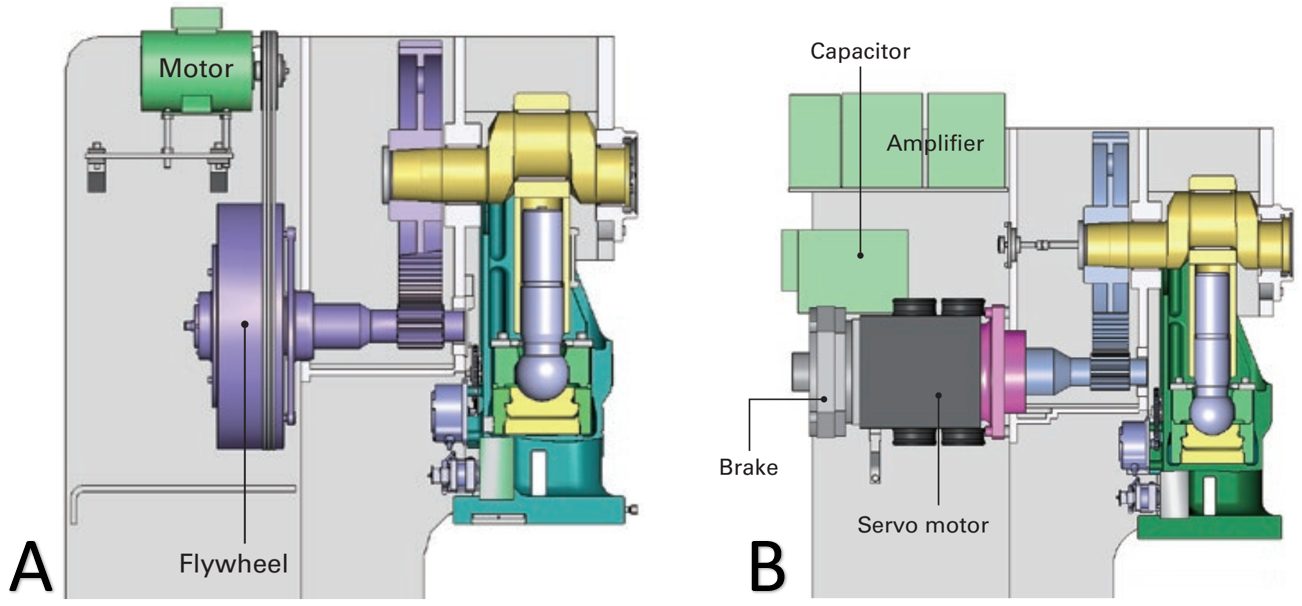
Figure 1: Drive components in a mechanical press. A) Flywheel driven; B) Servo motor driven.A-9
Advantages of Servo Presses
Servo press technology has many advantages compared to flywheel-driven mechanical presses when working with AHSS materials. Press manufacturers and users claim advantages in stroke, speed, energy usage, quality, tool life and uptime; these of course are dependent upon part shape and forming complexity. Figure 2 shows the difference between the available motions of flywheel-driven mechanical presses verses servo driven mechanical presses. The slide motion of the servo press can be programmed for more parts per minute, decreased drawing speed to reduce quality errors, or dwelling or re-striking at bottom dead center to reduce springback.
Figure 2: Comparison of Press Signatures in Fixed Motion Mechanical Presses and Free-Motion Servo-Driven Presses.M-3
Some examples highlighting the flexibility of servo press motions include:
- Adjustable Stroke Length: The servo press has an adjustable stroke; the programmable slide motion allows for customizing the stroke profile to suit the characteristics of the part. By changing the programmed profile, the same press can produce deep draw stampings, shallow part stampings, or even blanking. This flexibility allows metal formers to use servo presses for multiple job types.
- Adjustable Stroke Direction – Pendulum Motion: Unlike in flywheel-driven presses, servo-driven presses do not need to return to Top Dead Center. A servomotor can change the rotation direction at predefined angles (like restricting the rotation per stroke between 90 degrees and 270 degrees) to increase production rates. This is known as pendulum mode.
- Adjustable Stroke Direction – Attach-Detach (forward/reverse) Motion: The slide moves downward at a pre-set speed, reaches a predetermined depth, and rises slightly. The slide then moves downward again, and the system repeats this motion. When the slide motion changes from downward to upward, the forming forces become negligible and the elastic deformation of dies and machine recover. This has the potential to mitigate springback that is associated with the forming of higher strength materials in traditional mechanical presses. By holding pressure at the bottom of the stroke, releasing the pressure, and then reapplying it, multiple stamping hits can be made in just one cycle, setting the form of the product, and eliminating the need for secondary operations.
- Improved Cycle Time: Servo-driven presses achieve improved cycle times compared with standard mechanical presses, improving stamping plant productivity. This comes from the ability of servo presses to run faster on the approach and retract portions of the cycle when no work is performed on the sheet metal. Figure 3 shows cycle rates for comparable stroke heights for both a servo-mechanical press and a traditional flywheel-driven mechanical press in which the stroke-time signature takes the form of a sine wave. This example shows a 60% improvement in parts per minute. Quality likely improved also, for reasons discussed below.

Figure 3: Cycle rates for servo-driven and flywheel-driven mechanical presses.B-9
- Variable Speed Slide and Acceleration/Deceleration: At any part of the press stroke, the slide speed in the forming stage can be programmed to accelerate, decelerate, or remain constant, as necessary. Decreasing the touch speed of upper and lower dies minimizes impact shocks, improving quality while increasing the life of tools and presses. After forming, returning to the top slide position (not necessarily Top Dead Center) can occur quickly. These slide movements may alter the frictional characteristics between dies and sheet materials.
- Dwell Function of the Slide: Programming the slide to dwell at bottom dead center (BDC) is critical when stamping press hardenable steels, as this time allows for the necessary cooling under full press load that is key to achieving the dimensional and strength properties. In other applications, coining pressure at BDC ensures shape and dimensional accuracy of the product formed.
- Quality Improvements: High cycle rates in flywheel driven presses risk heating the sheet metal and tooling, leading to breakdown of lubricants and accelerated tool wear. During blanking or hole piercing, high cycle rates increase the reverse-tonnage snap through loads, damaging cut edge quality and sending shock waves through your tooling and press. Servo-driven presses can slow down just before contact with the sheet metal to dramatically reduce impact forces and shock loads, yet maintain high productivity by having the ram move much faster while no work is occurring. Improved product consistency should translate to fewer rejections.
- Longer Tool Life: Decreasing the tool impact speed reduces impact loading, thus maximizing tool life. With servo-driven presses, there is not a productivity penalty. Slower speeds and less aggressive forming conditions may allow for use of a lower grade lubricant. Pulsating or oscillating slide motion can extend the working limit.
- Uptime: Fewer moving parts and reduced shock loads translate into reduced die fatigue and greater uptime.
- Independent Motion of the Die Cushion: Programmable die cushions available with some servo presses function like hydraulic cushions found on some mechanical presses. A pressure sensor within the servo die cushion controls its position. This allows for the optimization of metal flow in the flange between the die and the blank holder. Varying the blank holder force during the stroke reduces springback in AHSS.S-44 Additionally, servo-driven die cushions can regenerate energy when the upper die and slide push the cushion downward.
- Formability Improvements: Using a servo press with a modified press cycle has allowed some stampers to use a less expensive, less formable grade without increasing rejects or compromising dimensional tolerance.
- Reduced Noise: Fewer moving parts combined with slower tool impact speeds and reduced snap-through loads lead to a quieter work environment.
- Synchronization with Transfer and Feed Systems: Servo presses provide for adjustments in slide position and speed, allowing for optimized timing to coordinate with part transfer systems.
- Multiple Operations in One Cycle: Control of the slide position combine with the ability to dwell make In-die operations possible.
- Energy Savings: During operations like blanking or drawing, servomotor power is used only while the press is moving, unlike in mechanical presses with a continuously rotating flywheel and clutch/brake mechanism. These mechanical press components each have energy losses due to friction. The lower energy consumption and associated costs seen in servo-driven presses are even more substantial in larger capacity presses. Also contributing to the energy savings is the dynamic braking operation of the servo driven motor, where the energy from braking transfers back into the power system. Similarly, compressed die cushions can feed energy to the storage device. When economically justified, installation of an external energy storage unit can make up for energy peaks while reducing the nominal power drawn from the local power supply system.
Figure 4 illustrates power storage and output in a servo-mechanical press system over the course of a cycle. In this example, the press operates with two main motors, each having a maximum output of 175 kW. An external energy device stores energy from the slide deceleration, and is tapped when the press motion requires more than 175 kW from each motor. The stored energy (maximum of 350 kW combined in the two 175 kW motors) is available during peak power requirements, enabling the facility power load to remain nearly constant at around 50 kW.B-9

Figure 4: Power storage and output in a servo mechanical press system.B-9
Press Force and Press Energy
Categorizing both mechanical and hydraulic presses requires three different capacities or ratings – force, energy, and power. Historically, when making parts out of mild steel or even some HSLA steels, using the old rules-of-thumb to estimate forming loads was sufficient. Once the tonnage requirements and some processing requirements were known, stamping could occur in whichever press met those minimum tonnage and bed size requirements.
In these cases, press capacity (for example, 1000 kN) is a suitable number for the mechanical characteristics of a stamping press. Capacity, or tonnage rating, indicates the maximum force that the press can apply without damaging its components, like the machine frame, slide-adjusting mechanisms, pitman (connection rods) or main gear bushings.
A servo press transmits force (not energy) the same way as the equivalent conventional press (mechanical or hydraulic). However, the amount of force available throughout the stroke depends on whether the press is hydraulic or mechanically driven. Hydraulic presses can exert maximum force during the entire stroke as tonnage generation occurs via hydraulic fluid, pumps, and cylinders. Mechanical presses exert their maximum force at a specific distance above bottom dead center (BDC), usually defined at 0.5 inch. At increased distances above bottom dead center, the loss of mechanical advantage reduces the tonnage available for the press to apply. This phenomenon is known as de-rated tonnage, and it applies to conventional mechanical presses as well as servo-mechanical presses. Figure 5 shows a typical press-force curve for a 600-ton mechanical press. In this example, when the press is approximately 3 inches off BDC, the maximum tonnage available is only 250 tons – significantly less than the 600-ton rating.
Figure 5: The Press-Force curve shows the maximum tonnage a mechanical press can apply based on the position of the slide relative to the bottom dead center reference distance. This de-rated tonnage applies to both conventional mechanical presses as well as servo-mechanical presses.E-2
Press energy reflects the ability to provide that force over a specified distance (draw depth) at a given cycle rate. Figure 6 shows a typical press-energy curve for the same 600-ton mechanical press. The energy available depends on the size and speed of the flywheel, as well as the size of the main drive motor. As the flywheel rotates faster, the amount of stored energy increases, reflected in the first portion of the curve. The cutting or forming process consumes energy, which the drive motor must replenish during the nonworking part of the stroke. At faster speeds, the motor has less time to restore the energy. If the energy cannot be restored in time, the press stalls. The graph illustrates how the available energy of the press diminishes to 25% of the rated capacity when accompanied by a speed reduction from 24 strokes per minute to 12 strokes per minute.
Figure 6: A representative press-energy curve for a 600 ton mechanical press. Reducing the stroke rate from 24 to 12 reduces available energy by 75%.E-2
Rules of thumb are useful to estimate press loads. However, a better evaluation of draw force, embossment force, and blank holding force comes from simulation tools. Many programs enable the user to specify all of the system inputs. This is especially important when forming AHSS because the rapid work hardening seen in these grades has a major effect on the press loads. In addition, instead of using a simple restraining force on blank movement, incorporating the geometry and effects of the actual draw beads leads to improved simulation accuracy.
A common shortcut taken in simulation is the assumption that the tools are rigid during forming. In practice, however, tools will deform elastically. Further increasing this deflection of the dies (sometimes called breathing) is the higher work hardening of AHSS grades. This discrepancy leads to a significant increase in the determined press loads, especially when the punch is at home position. Hence, for a given part, the draw depth used for the determination of the calculated press load is an important parameter. Applying the nominal draw depth may result in an over-estimation of press loads. Similarly, assuming that the structure, platens, bolsters, and other components of the press are completely rigid may lead to variation in press loads, especially after moving the physical tooling from one press to another.
In all cases, validation of all simulation predictions is good practice. Every simulation contains assumptions, with some being more critical than others. Use practical stamping tests to determine the optimum parameter settings for the simulation. Quick items to confirm simulation matches with reality include draw-in amounts (lay draw panel on top of blank) and press tonnages (check load monitors). When physical panels match simulation results, confidence in the simulation accuracy rises.
In processes like restrike operations, simulation may not accurately estimate press loads. In these cases, run “what-if” simulations to observe forming trends for a given part, which helps to develop a more favorable forming-process design.
Setting Draw Beads with Air Cushions and
Nitrogen Cylinders
Air cushions and nitrogen cylinders are common on single action mechanical presses to give them a double action. There is a tonnage spike on initial contact with the blankholder and setting of the draw beads, occurring while the press is still several inches off Bottom Dead Center. This spike increases the likelihood of a mechanical press being damaged. Figure 7 shows the potential negative consequences when a mechanical press exceeds the rated capacity of the press and the associated components.

Figure 7: Broken connecting rod on a mechanical press.M-5
A nitrogen die cushion in a single-acting press needs to apply considerable force to set draw beads in AHSS sheets before drawing begins, as well as to apply stake beads at the end of the stroke for springback control. In some cases, binder separation may occur because of insufficient cushion tonnage, resulting in a loss of control for the stamping process and excessive wrinkling of the part or addendum. The high impact load on the cushion may occur several inches up from the bottom of the press stroke, where de-rated tonnage means a reduced maximum load to avoid press damage. Flywheel-driven mechanical presses are susceptible to damage due to these shock loads, since the impact point in the stroke occurs when the press is travelling at a higher velocity. The high shock loads dissipate additional flywheel energy well above bottom dead center of the stroke. Therefore, a nitrogen-die cushion may be inadequate for optimum pressure and process control when working with AHSS.
Staggering the heights of the nitrogen cylinders so they do not all engage at the same time is one way to reduce the shock load (Figure 8). A double-action press will set the draw beads when the outer slide approaches bottom dead center where the full tonnage rating is available and where the slide velocity is substantially lower. This minimizes any shock loads on the die and press with resultant load spikes less likely to exceed the rated press capacity.

Figure 8: Staggered nitrogen cylinders reduce the initial shock load when setting draw beads by engaging at different depths in the press stroke.M-5
Press Considerations When Working With Higher Strength Steels (U-13)
The increased forces needed to form, cut and trim higher-strength steels create significant challenges for pressroom equipment and tooling. These include excessive tooling deflections, damaging tipping-moments, and amplified vibrations and snapthrough forces that can shock and break dies—and sometimes presses. Stamping AHSS materials can affect the size, strength, power and overall configuration of every major piece of the press line, including material-handling equipment, coil straighteners, feed systems and presses.
Here is what every stamper should know about higher-strength materials:
- Because higher-strength steels require more stress to deform, additional servo motor power and torque capability may be needed to pull the coil material through the straightener. Additional back tension between the coil feed and straightening equipment also may be required due to the higher yield strength of the material in the loop as the material tries to push back against the straightener and feed system.
- Because higher-strength materials require greater stress to blank and punch as compared to HSLA or mild steel, they generate proportionally increased snapthrough and reverse-unloading forces. High-tensile snapthrough forces introduce large downward accelerations to the upper die half. These forces work to separate the upper die from the bottom of the ram on every stroke. Insufficient die-clamping force could cause the upper-die half to separate from the bottom of the ram on each stroke, causing fatigue to the upper-die mounting fasteners.
- Because energy is expended with each stroke of the press—and this energy must be replaced—critical attention must focus on the size (horsepower) of the main drive motor and the rotational speed of the flywheel in higher-strength-steel applications. The main motor, with its electrical connection, provides the only source of energy for the press and it must generate sufficient power to meet the demands of the stamping operation. The motor must be properly sized to replace the increased energy expended during each press stroke. For these reasons, some stampers consider the benefits of servo-driven presses for these applications.
As steels becomes stronger, a corresponding increase in process knowledge is required in terms of die design, construction and maintenance, and equipment selection.
Case Study: The Importance of Press Energy
in Flywheel Driven Presses
In a flywheel-driven mechanical press, the size of the main motor, flywheel mass, and rotation speed of the flywheel become critical. The main motor, along with its electrical connections, is the only source of energy for the press and it must have sufficient power to supply the demands of the stamping operation. As the flywheel is an energy storage device, it must be able to store and deliver the required energy when needed. The stored energy varies by the square of the speed; thus, flywheels can store a large amount of energy when the press is running at full speed. If heat generation and forming problems occur when stamping AHSS grades, operators may be inclined to slow down press speeds. However, this slowdown may lead to not meeting the energy requirements to form the part, ultimately resulting in the press stalling.
Take the example of a part with a draw depth of 2 inches. If stamped from HSLA 350/450, it may need 150 tons of forming force, for a total of 300 inch-tons of forming energy (2 inches times 150 tons). On this press, 14 strokes per minute is sufficient to generate enough forming energy, as indicated by the green dot in Figure 9.
Studies have shown that the forming tonnage of DP steels may be twice that of HSLA steels, which means that the 2 inch draw depth could need 300 tons of forming force, for a total of 600 inch-tons of forming energy. The red dot in Figure 9 shows that our press must run at 20 strokes per minute to ensure that there is sufficient forming energy. The speed is well within the capability of the press, but our strategy of running faster may not be appropriate for forming AHSS grades where heat generation could result in lubricant breakdown leading to die wear, galling, and scoring. Running the press slower to avoid these concerns increases the risk of stalling.

Figure 9: Higher strength materials requiring increased forming energy also require faster cycle times. If the greater cycle time cannot be maintained due to reasons like heat buildup or lubricant breakdown, a flywheel-driven press may stall.E-2
Case Study: Press Force and Press EnergyH-3
Predicting the press forces needed initially to form a part is known from a basic understanding of sheet metal forming. Different methods are available to calculate drawing force, ram force, slide force, or blankholder force. The press load signature is an output from most forming-process development simulation programs, as well as special press load monitors.
Most structural components include design features to improve local stiffness. Typically, forming of the features requiring embossing processes occurs near the end of the stroke near Bottom Dead Center. Predicting forces needed for such a process is usually based on press shop experiences applicable to conventional steel grades. To generate comparable numbers for AHSS grades, forming process simulation is recommended.
In Citation H-3, stamping simulations evaluated the forming of a cross member having a hat-profile with an embossment formed at the end of the stroke (Figure 10). The study simulated press forces and press energy involved for drawing and embossing a channel section from four steel grades approximately 1.5 mm thick: mild steel, HSLA 250/350, HSLA 350/450, and DP 350/600. Figures 11A and 11B clearly show that the embossing phase rather than the drawing phase dominates the total force and energy requirements, even though the punch travel for embossing is only a fraction of the drawing depth.
Figure 10: Cross section of a component having a longitudinal embossment to improve local stiffness.H-3
Figure 11: Embossing requires significantly more (A) force and (B) energy than drawing, even though the punch travel in the embossing stage is much smaller.H-3
Figures 12 and 13 highlight the press energy requirements, showing the greater energy required for higher strength steels. The embossment starts to form at a punch displacement of 85 mm, indicated by the three dots in Figure 12. The last increment of punch travel to 98 mm requires significantly higher energy, as shown in Figure 13. Note that compared with mild steel, the dual phase steel grade requires significantly more energy to form the part to home with the 98 mm travel.
Figure 12: Energy needed to form the component increases for higher strength steel grades. Forming the embossment begins at 85 mm of punch travel, indicated by the 3 dots.H-3
Figure 13: Additional energy required to form the embossment increases for higher strength steel grades.H-3
It is not only embossments that require substantially more force and energy at the end of the stroke. Stake beads for springback control engage late in the stroke to provide sidewall stretch. Depending on the design of the forming process, the steel into which the stake beads engage may have passed through conventional draw beads for metal flow control, and therefore are work-hardened to an even higher strength. This leads to greater requirements for die closing force and energy. Certain draw-bead geometries which demand different closing conditions around the periphery of the stamping also may influence closing force and energy requirements.
Energy Requirements
Using existing production data can estimate press loads for simple geometries, knowing just the thickness and tensile strength. There is a proportional increase in forming load (F) resulting from the product of thickness (t) and tensile strength (Rm). For example, in your current production (1), you know your drawing force F1, and the thickness t1 and tensile strength Rm1 of the steel you are forming. You are switching production (2) to a new tensile strength Rm2 and thickness t2, and you want to know the drawing force F2. Set up the following equation:
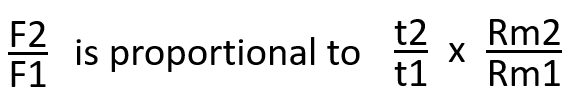
which is the same as

The work in Citation T-11 studied the press loads required to form a cross member with a simple hat profile from two steels of the same 0.7 mm thickness: HSLA 350/450 and DP 300/500 steels. Here, it was known that an HSLA coil with 433 MPa tensile strength required 791 kN of drawing force. Of interest was the drawing force required to stamp a dual phase steel with a tensile strength of 522 MPa. Using the equations above, the estimated force F2 was calculated as 954MPa:

This estimated 954 MPa compares favorably with the force measured during their trial stamping of 934 MPa. Using this technique typically is sufficient to estimate the press requirements, but may lead to an over-estimation of the actual loads.
The energy required for plastically deforming a material (force times distance) has the same units as the area under the true stress-true strain curve. For this reason, assessing the forming energy requirements of two grades requires comparing the respective areas under their true stress – true strain curves. The shape and magnitude of these curves are a function of the yield strength and work hardening behavior as characterized by the n-value. At the same yield strength, a grade with higher n-value will require greater press energy capability, as highlighted in Figure 14 which compares HSLA 350/450 and DP 350/600. For these specific tensile test results, there is approximately 30% greater area under the DP curve compared with the HSLA curve, suggesting that forming the DP grade requires 30% more energy than required to form a part from the HSLA grade.

Figure 14: True stress-strain curves for two materials with equal yield strength.T-11
Greater work hardening of DP steels results in higher forming tonnage requirements when compared to HSLA grades at the same incoming yield strength and sheet thickness. However, AHSS applications justify a thickness reduction, and along with this is a reduction in the required press load. The required power is a function of applied forces, the displacement of the moving parts, and the speed. The energy rating of a press is also a function of applied press load and the distance over which the load is applied. For example, pushing 200 tons through 3 inches of deep drawing requires 600 inch–tons of energy. Changing the part to AHSS could require 500 tons of force working through the same 3 inch distance, requiring 1500 inch-tons of energy. Each stroke of the press expends a given amount of energy, all of which must be replaced before the next stroke begins.
Key Points
- Forming AHSS steels require increased press loads primarily because of their increased work hardening and increased strength levels.
- Press energy availability is as important as press force capacity when selecting a press to form AHSS grades.
- Slowing a press to counteract heat build-up may lead to stalling of flywheel-driven presses due to insufficient press energy availability.
- Comparing the areas under the respective true stress-true strain curves is one way to assess the additional increase in required press energy between two grades.
- Embossments and other features engaging off bottom dead center require sufficient de-rated tonnage and press energy at appropriate distances off bottom.
- DP 350/600 requires about twice the energy to form a hat-profile cross member than the same cross member formed from mild steel.
- Forming and process simulations are the most efficient and accurate approach to estimating the punch force and energy requirements to process AHSS grades.
- Servo-driven presses have characteristics which make them suitable for forming complex geometries using advanced high strength steels. Adding to their business case, servo-driven presses are more energy efficient and the flexibility in press cycle profiles can lead to enhanced productivity.
Back To Top
![Considerations When Deciding Whether to Cold Form or Hot Form]()
Press Requirements
For a stamping operation, knowing the press tonnage required to produce a part is essential. Running a part in a press without enough capacity can cause press fatigue, damage and significant downtime. Also, an operation that must run a part in a much larger press than anticipated in order to get enough tonnage will see decreases in throughput and efficiency, resulting in increased cost. Therefore, it is critical to be able to predict a part’s stamping tonnage requirements early in the design phase of the component and the stamping process. This is even more important with the continual developments in Advanced High-Strength Steels (AHSS) that the steel industry has made. These steels offer similar formability of traditional high-strength steels with twice the strength or more, as shown in Figure 1. In this article, I will explain why typical rules of thumb that appeared to work in the past are no longer applicable and touch on how the automotive and steel industries are addressing the changes.

Figure 1: AHSS add to the spectrum of options available for automotive body construction.A-69
Tonnage Requirements and Press Capacity
When discussing the press capacity requirements, it is typical to mainly refer to ‘tonnage’ as the measurable needed. Tonnage is the peak load required during a stamping operation. The tonnage rating for a press refers to the peak load that the press can safely deliver without causing damage to the press frame, ram, bushings, etc. For a mechanical press, the peak tonnage is only available at the bottom of the stroke.
Besides peak load requirements, it is also important to understand the total energy required to form a part. It is typical for the force available from a mechanical press just a few inches off bottom to be 50% of the press tonnage rating. For drawing operations that may start several inches off bottom, it is important to predict the part tonnage requirements through the entire stroke and to compare that with the force curve from the press manufacturer. Integrating this press force curve over the entire stroke is a measure of the total energy capacity of the press. Many times, when a press stalls at bottom dead center, the issue may not be that the peak load of the press was exceeded, rather the full amount of energy that was stored in the flywheel had been expended. More information about press force and press energy are found on our page highlighting Press Requirements.
A few years ago, I saw an example of energy vs. tonnage requirements. The part was a relatively thick gage AHSS frame bracket. The design was a simple flanged hat section. In plan view, the part was only about 6-inch x 6-inch with the depth of the hat being about 4-inch. Based on the tonnage require to flange, trim and pierce a hole, the part should have easily been able to fit in a small 600-ton press. However, in order to have enough energy to produce the part, this small die was placed in the center of the 180-inch bed of a 1200-ton press. Not only was it ergonomically difficult for the operator, but the large press burden rate was much higher, and the speed was much slower than that of the smaller press, causing a significant cost increase.
Furthermore, it is good to know how off-center the load required to form a part is. Obviously, the die setter will center the die under the ram. However, most parts are not symmetric, causing the load going into the ram, bushings and press frame to be biased to one side or the other. This becomes more exaggerated in a large transfer press that may have a major draw operation at the entry end and a minor trim operation at the exit end.
Putting this all together, having the ability to predict not only the peak load required to form a part, but also the total energy through the stroke and the off-center bias gives us the ability to design a stamping process that is safe and efficient. Also, in lean manufacturing terms, a predicted through-stoke force curve provides a good baseline defining the basic condition of the die. Comparing this to actual force curves and evaluating any changes over time will help to develop preventive maintenance schedules and will offer many new capabilities with servo presses as they become more prevalent.
Conventional Rule-of-Thumb Calculations Lead to Inaccurate Press Tonnage Predictions, Especially in AHSS
In 1989, I worked for an automotive stamping supplier as a college intern. One of my tasks was to do basic calculations of part size and tonnage requirements that were used by the process engineers to design the die process and quote the manufacturing and die costs to produce the part. The rule of thumb estimates used at that time were simple calculations for the peak load. Tonnage for trim and pierce operations were dependent on the length of line of trim, material thickness and the shear strength of the material. Tonnage for forming operations were dependent on the size of the form, material thickness and material tensile strength. These calculations typically over-predicted the tonnage requirement, but because of the relative low strength steels used, as compared to today’s AHSS, most times, the limiting factor was the overall part size that dictated the size of the press to be used rather than the tonnage requirement.
So why do we hear today that these same rules of thumb do not work, or worse, that they now under predict the tonnage requirements? To understand this, let us look at a few guidelines I used over 30 years ago.
For piercing a hole: Tonnage = d * t * 80 Equation 1
In this equation d is the punch diameter in inches, t is the material thickness in inches, and it gives the tonnage in tons. This was a very simple and effective way to estimate the tonnage of all the holes pierced. Let us look at how this rule of thumb was derived. The equation is a simplification of the fact that the actual calculation is the length of line doing the work, in this case the circumference of a circle, multiplied by the material thickness and the material’s shear strength (ꚍ). The generic equation for any type of piercing or trimming is Tonnage = P * t * ꚍ where P is the perimeter or length of line of the trim, t is the material thickness and ꚍ is the shear strength of the material. A typical estimate for the shear strength (ꚍ) is 60% of the tensile strength (T) for the material. Therefore, the equation development for a simple hole piercing looks like:
| Generic trim equation: |
Tonnage = P * t * ꚍ |
Equation 2 |
| Specific for a round hole: |
Tonnage = πd * t * 0.6T |
|
| Simplifying: |
Tonnage = d * t * 0.6Tπ |
|
| Mild steel T = 300 MPa = 43.5 ksi: |
0.6 * 43.5 * 3.14 = 82 |
|
| Pierce a round hole: |
Tonnage = d * t * 80 |
|
Now that we know how the rule of thumb was derived, we can point out some possible sources of error. First, the equation uses the full thickness of the material. In reality, a typical trim operation for steel consists of 20% to 50% trimming and the remainder is breakage. The press only needs to produce load for the trimming portion. Second, the shear strength of the material is not a fixed percentage of the tensile strength. The actual shear strength should be measured for each specific grade as the microstructure differences of the AHSS will affect the material strength in shear. Lastly any of these errors are multiplied since today’s AHSS material has an overall tensile strength of three, four or even five times that of mild steel – taking any error in this estimate and magnifying it. To see this, we can take a look at a simple example of piercing a 1-inch hole in 1.5 mm thick mild steel. The steel tensile strength has a range of 40 ksi to 55 ksi (280 MPa to 380 MPa). If we look at Equation 1 with the high- and low-end assumptions, we see:
| Equation 1 estimate |
Tonnage = 1 * 0.06 * 80 = 4.8 tons |
| Equation 2 minimum |
Tonnage = 3.14 * 0.06(20%) * 0.6(40) = 0.9 tons |
| Equation 2 maximum |
Tonnage = 3.14 * 0.06(50%) * 0.6(55) = 3.1 tons |
In this very simple example, we see sources of error that could lead to an estimate of 0.9 to 4.8 tons to pierce a single hole. A similar exercise could be taken on a drawing operation. In this situation, most rules of thumb attempt to use the perimeter or surface area of the part, the material thickness and the material tensile strength to predict the tonnage needed. Sources for error in this type of calculation include: 1) Using the perimeter of the draw area, tending to under predict; 2) Using the surface area of the part, tending to overpredict; and 3) Using the tensile strength of the material, also tending to over predict as it assumes the material is stretched right to the level of splitting. Correction factors have been developed overtime, but it is still easy to see there are many possible sources of error in these types of calculations.
AHSS Magnifies Press Tonnage Prediction Challenges
We can see that there are inherent challenges with the old school rules of thumb, but why are they so exaggerated with today’s AHSS? There are a number of reasons.
- Strength: The strength of today’s cold stamped steels is quite incredible. Where a mild steel may have a tensile strength of 280 MPa, it is now common to cold stamp dual phase (DP) steels and 3rd Generation steels with up to 1180 MPa. In addition, new materials having a tensile strength of 1500 MPa with enough elongation to allow for cold stamping are starting to enter the market. This five-fold increase in strength acts as a multiplying factor for any errors in traditional predictions.
- Formability: The formability of AHSS has also increased dramatically. Today a DP 590 steel and even a 980 3rd Generation steel can have nearly the same elongation as a high-strength low alloy (HSLA) steel of 30 years ago. This affords the part designers the ability to incorporate more complex forms into a part including using darts and beads to increase a part’s stiffness, tight radii and deeper draws. All of these add to the tonnage used and are generally not part of the old school rule of thumb calculations.
- Springback Corrections: Springback is linearly related to the yield strength of a material. Therefore, stamping AHSS grades require more features to be added to the die process to control springback. These may include draw beads (used to control material flow early in the press stroke), stake beads (used at the bottom of the stroke to minimize springback) and tighter radii (Figure 2). These features are typically off product, in the addendum, and are easily ignored by typical rule of thumb calculations.

Figure 2: Draw and Stake Bead PlacementA-6
- Hardening Curves: The complex microstructure of AHSS offers many advantages to increase formability. All AHSS grades produce microstructural phase transformations during the stamping process. This allows the lower yield strength in the as-rolled material, which aids in formability, to increase during the stamping operation. This yield strength increase can be as much as 100 MPa. Models that estimate these hardening curves of the material are ignored when doing hand calculations.
- Other Considerations: Lastly the typical rule of thumb calculations, as we have discussed, only consider the part characteristics. They generally do not include the other sources that consume energy during the stamping process including off-product feature (beads, pilot holes, etc.), spring stripper pressure, pad pressure from nitrogen springs or air cushions, driven cams and part lifters. Many of these could be ignored 30 years ago with mild steels, but they become more significant with the strength of today’s AHSS.
Accurate Tonnage Predictions Require Accurate and Complete Inputs
The answer in recent years is to rely more on simulations using finite element analysis (FEA) software. Care must be taken when using these sophisticated software packages. Many times, the software is blamed when inaccurate press tonnage predictions are given. However, we know that if any of the characteristics mentioned above are ignored, the user will develop a very precise but very inaccurate tonnage prediction.
Next Steps
The issue with accurately predicting press requirements is industry-wide and has been around for decades. The recent advances in AHSS have multiplied the sources of errors that exist in the past rules of thumb and from the incorrect usage of advanced software packages. Many people within the steel and automotive industries are working on improving the reliability of these predictions including the Auto/Steel Partnership (A/SP). A/SP, founded in 1987, is a partnership between automotive OEMs, steel mills and affiliate suppliers. A/SP has teamed up with formability software suppliers to collaborate on this subject. A/SP’s project will work to measure sources of error and develop guidelines to address these in the areas of material characterization, modeling techniques and numerical analysis techniques. A/SP’s efforts, including this project, looks to bridge the gap between research laboratories and the shop floor.
What can stamping manufacturers do? First, prepare for the digital manufacturing era (often call the 4th Industrial Revolution) by keeping press tonnage monitors in good working order. Also, consider upgrading to systems that can capture full through-stroke force curves. Secondly, do not go it alone. Engage with organizations like A/SP, OEMs and steel mills. When evaluating new parts using AHSS, get the steel mill involved early, even in the die design phase. All steel mills have teams of application engineers to help OEMs and their suppliers to transition into using the newest grades of steel – they want stampers to succeed and have the tools and data to help.
Back To Top