Stretching
Stretching is the sheet metal forming process where the punch which creates the part shape forces the sheet metal to thin since lock beads prevent metal flow inward from the flange area. In contrast with drawing, significant metal thinning occurs in stretching, especially in the biaxial tension mode. The biaxial increase in surface area reduces the metal thickness, maintaining the constancy of volume. The thinning soon reaches the onset of the local neck and failure as defined by the appropriate forming limit curve. The steel property that improves stretching is the strain hardening exponent, or n-value.
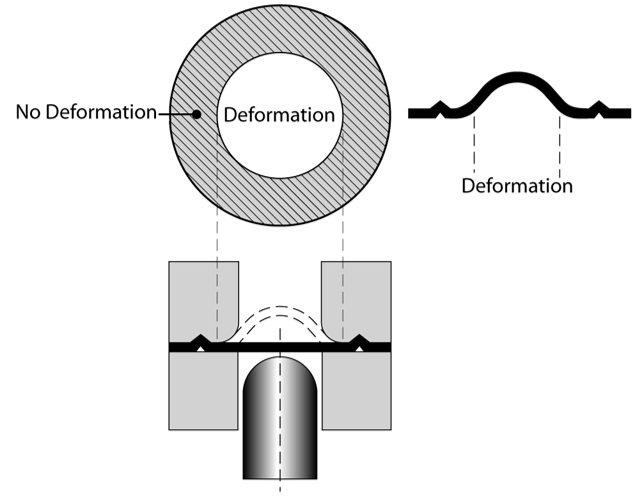
Stretchability, or the ability for a sheet metal to be stretched with no metal flowing from the flange or binder, often is assessed by the hemispherical dome test. Here, a hemispherical punch (usually with a 100 mm diameter) deforms a fully clamped blank. This ensures pure biaxial stretch without metal flowing from the blank into the deformation zone (Figure 1).
Figure 1: Stretch forming generated by a hemispherical punch stretching a locked circular blank.
Comparing the ratio of maximum dome height to punch diameter (H/d) is one way to view the results. Figure 2 illustrates a typical test output. Note the maximum dome height (H/d) at failure decreased as the yield strength increased and the n-value decreased.

Figure 2: Dome stretch tests of 1mm thick steel using a 100 mm hemispherical punch and a clamped blank.C-9
Additional stretch tests are possible with the hemispherical dome tester other than the dome height at failure shown in Figure 2. The limiting dome height (LDH) test stretches a rectangular steel strip which is locked in the longitudinal direction (Figure 3). Typically, a conventional rust preventive oil coats the blanks. Strips of different width are tested, with a circular lock bead preventing metal flow from the binder in the regions where the blank dimensions are large enough. The output of this test is the maximum dome height at failure. Figure 3 shows the achievable hemispherical dome height is substantially higher for the TRIP steel compared to the HSLA steel grade of equivalent tensile strength.
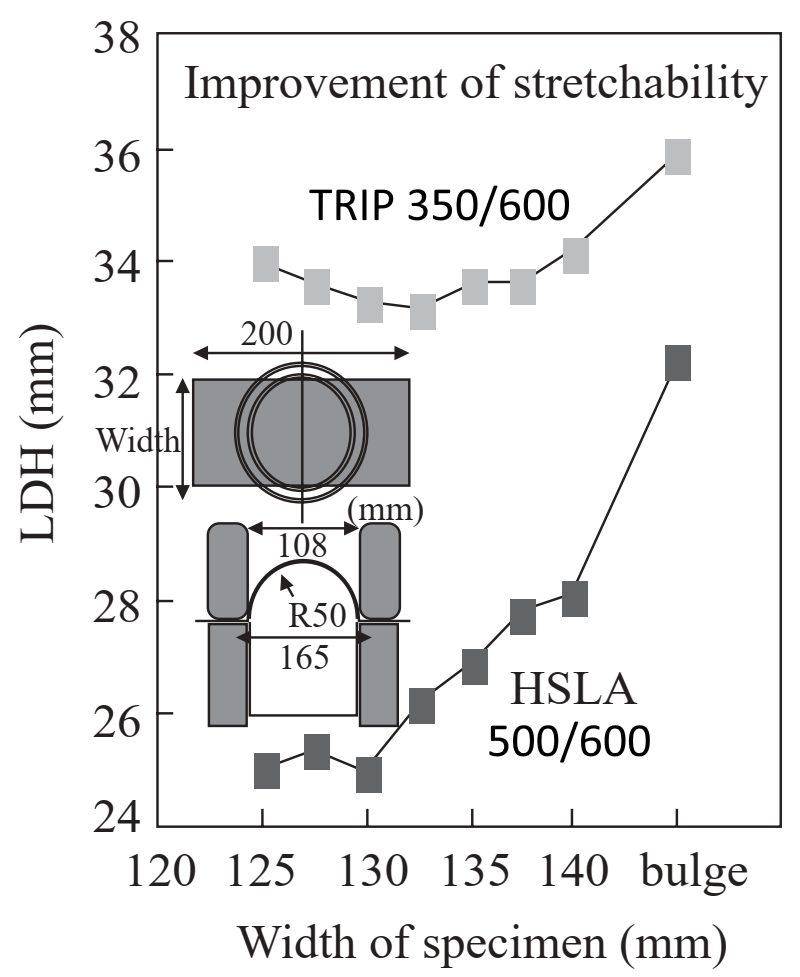
Figure 3: Limiting Dome Height is greater for TRIP than HSLA at the same tensile strength.T-2
The same tooling, steels, and lubricant from Figure 3 generated the thinning strains in Figure 4. Instead of forming to failure, the 50 mm radius hemispherical punch stretched the dome height to only 25 mm for both steels. The high n-value of TRIP steels minimizes strain gradients and reduces localizes thinning, helping to delay necking and form more complex geometries.
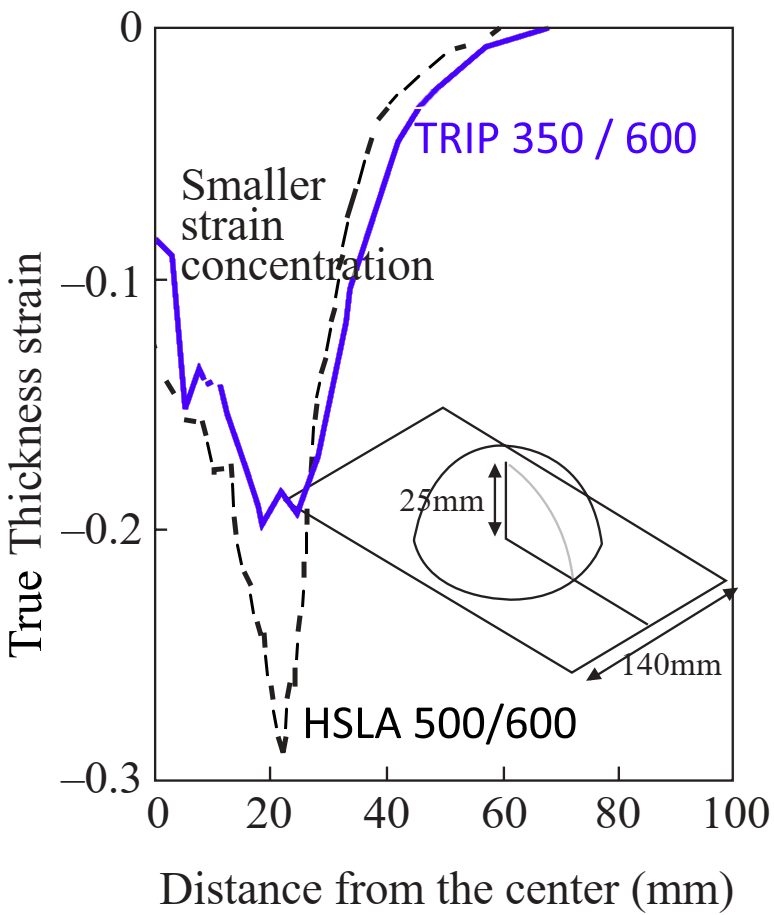
Figure 4: TRIP steel experiences less thinning than HSLA steel of the same tensile strength when formed to a constant dome height.T-2
The Limiting Dome Height test results for EDDS (vacuum-degassed interstitial-free) steel and three Advanced High Strength Steel grades are in Figure 5. Instead of plotting the various dome heights (as in Figure 3) to find the minimum value, Figure 5 simply shows the minimum value for each steel. TWIP (Twinning Induced Plasticity) steel has unique properties for stretchability and total elongation. Stretchability exceeds even that of EDDS IF steel.
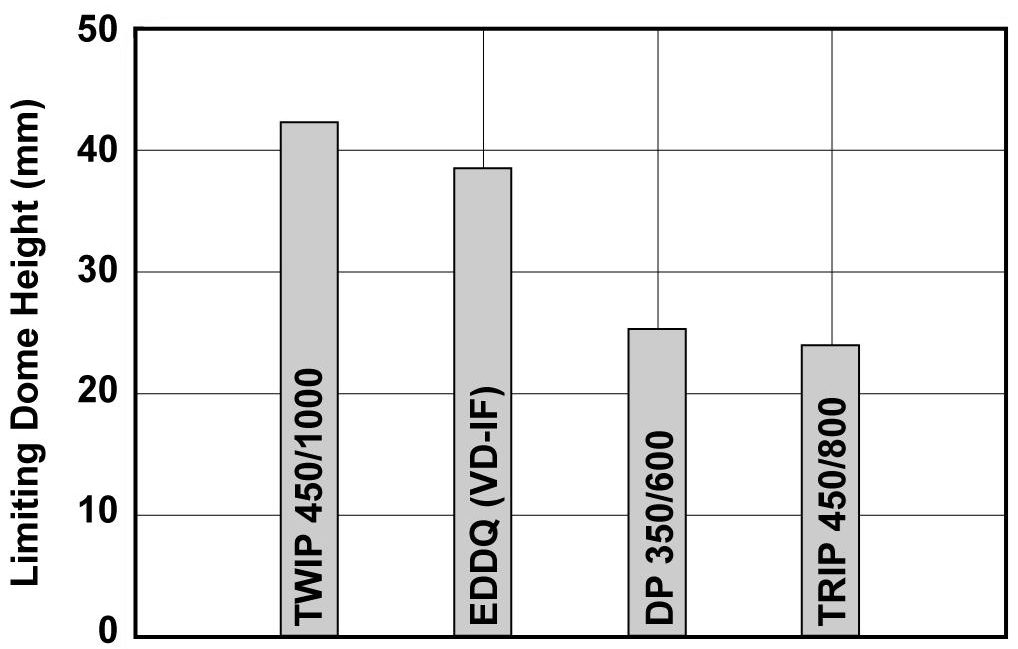
Figure 5: Limiting Dome Height values reflect relative stretchability of three AHSS compared with a low strength IF steel.P-2


