Improving Joint Performance
In static or dynamic conditions, the spot weld strength of Advanced High-Strength Steels (AHSS) may be considered as a limiting factor. One solution to improve resistance spot weld strength is to add a high-strength adhesive to the weld. Figure 1 illustrates the strength improvement obtained in static conditions when crash adhesive (in this case, Betamate 1496 from Dow Automotive) is added. The trials were performed with 45-mm-wide and 16-mm adhesive bead samples.
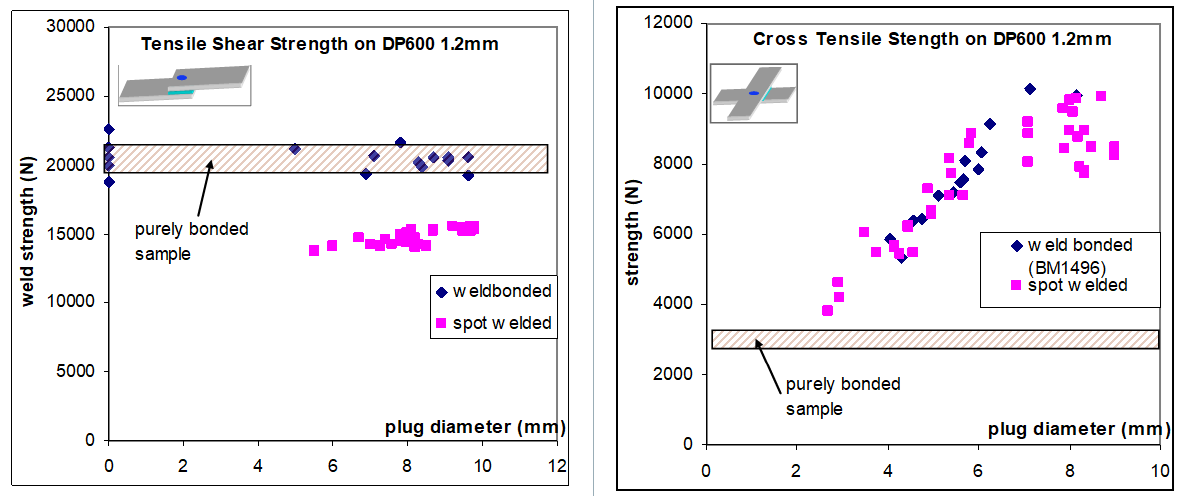
Figure 1: Tensile Shear Strength and Cross Tensile Strength on DP 600.A-16
Another approach to improve the strength of welds is done by using laser welding instead of spot welding. Compared to spot welding, the main advantage of laser welding, with respect to the mechanical properties of the joint, is the possibility to adjust the weld dimension to the requirement. One may assume that, in tensile shear conditions, the weld strength depends linearly on the weld length as indicated in the results of a trial A-16, shown in Figure 2.
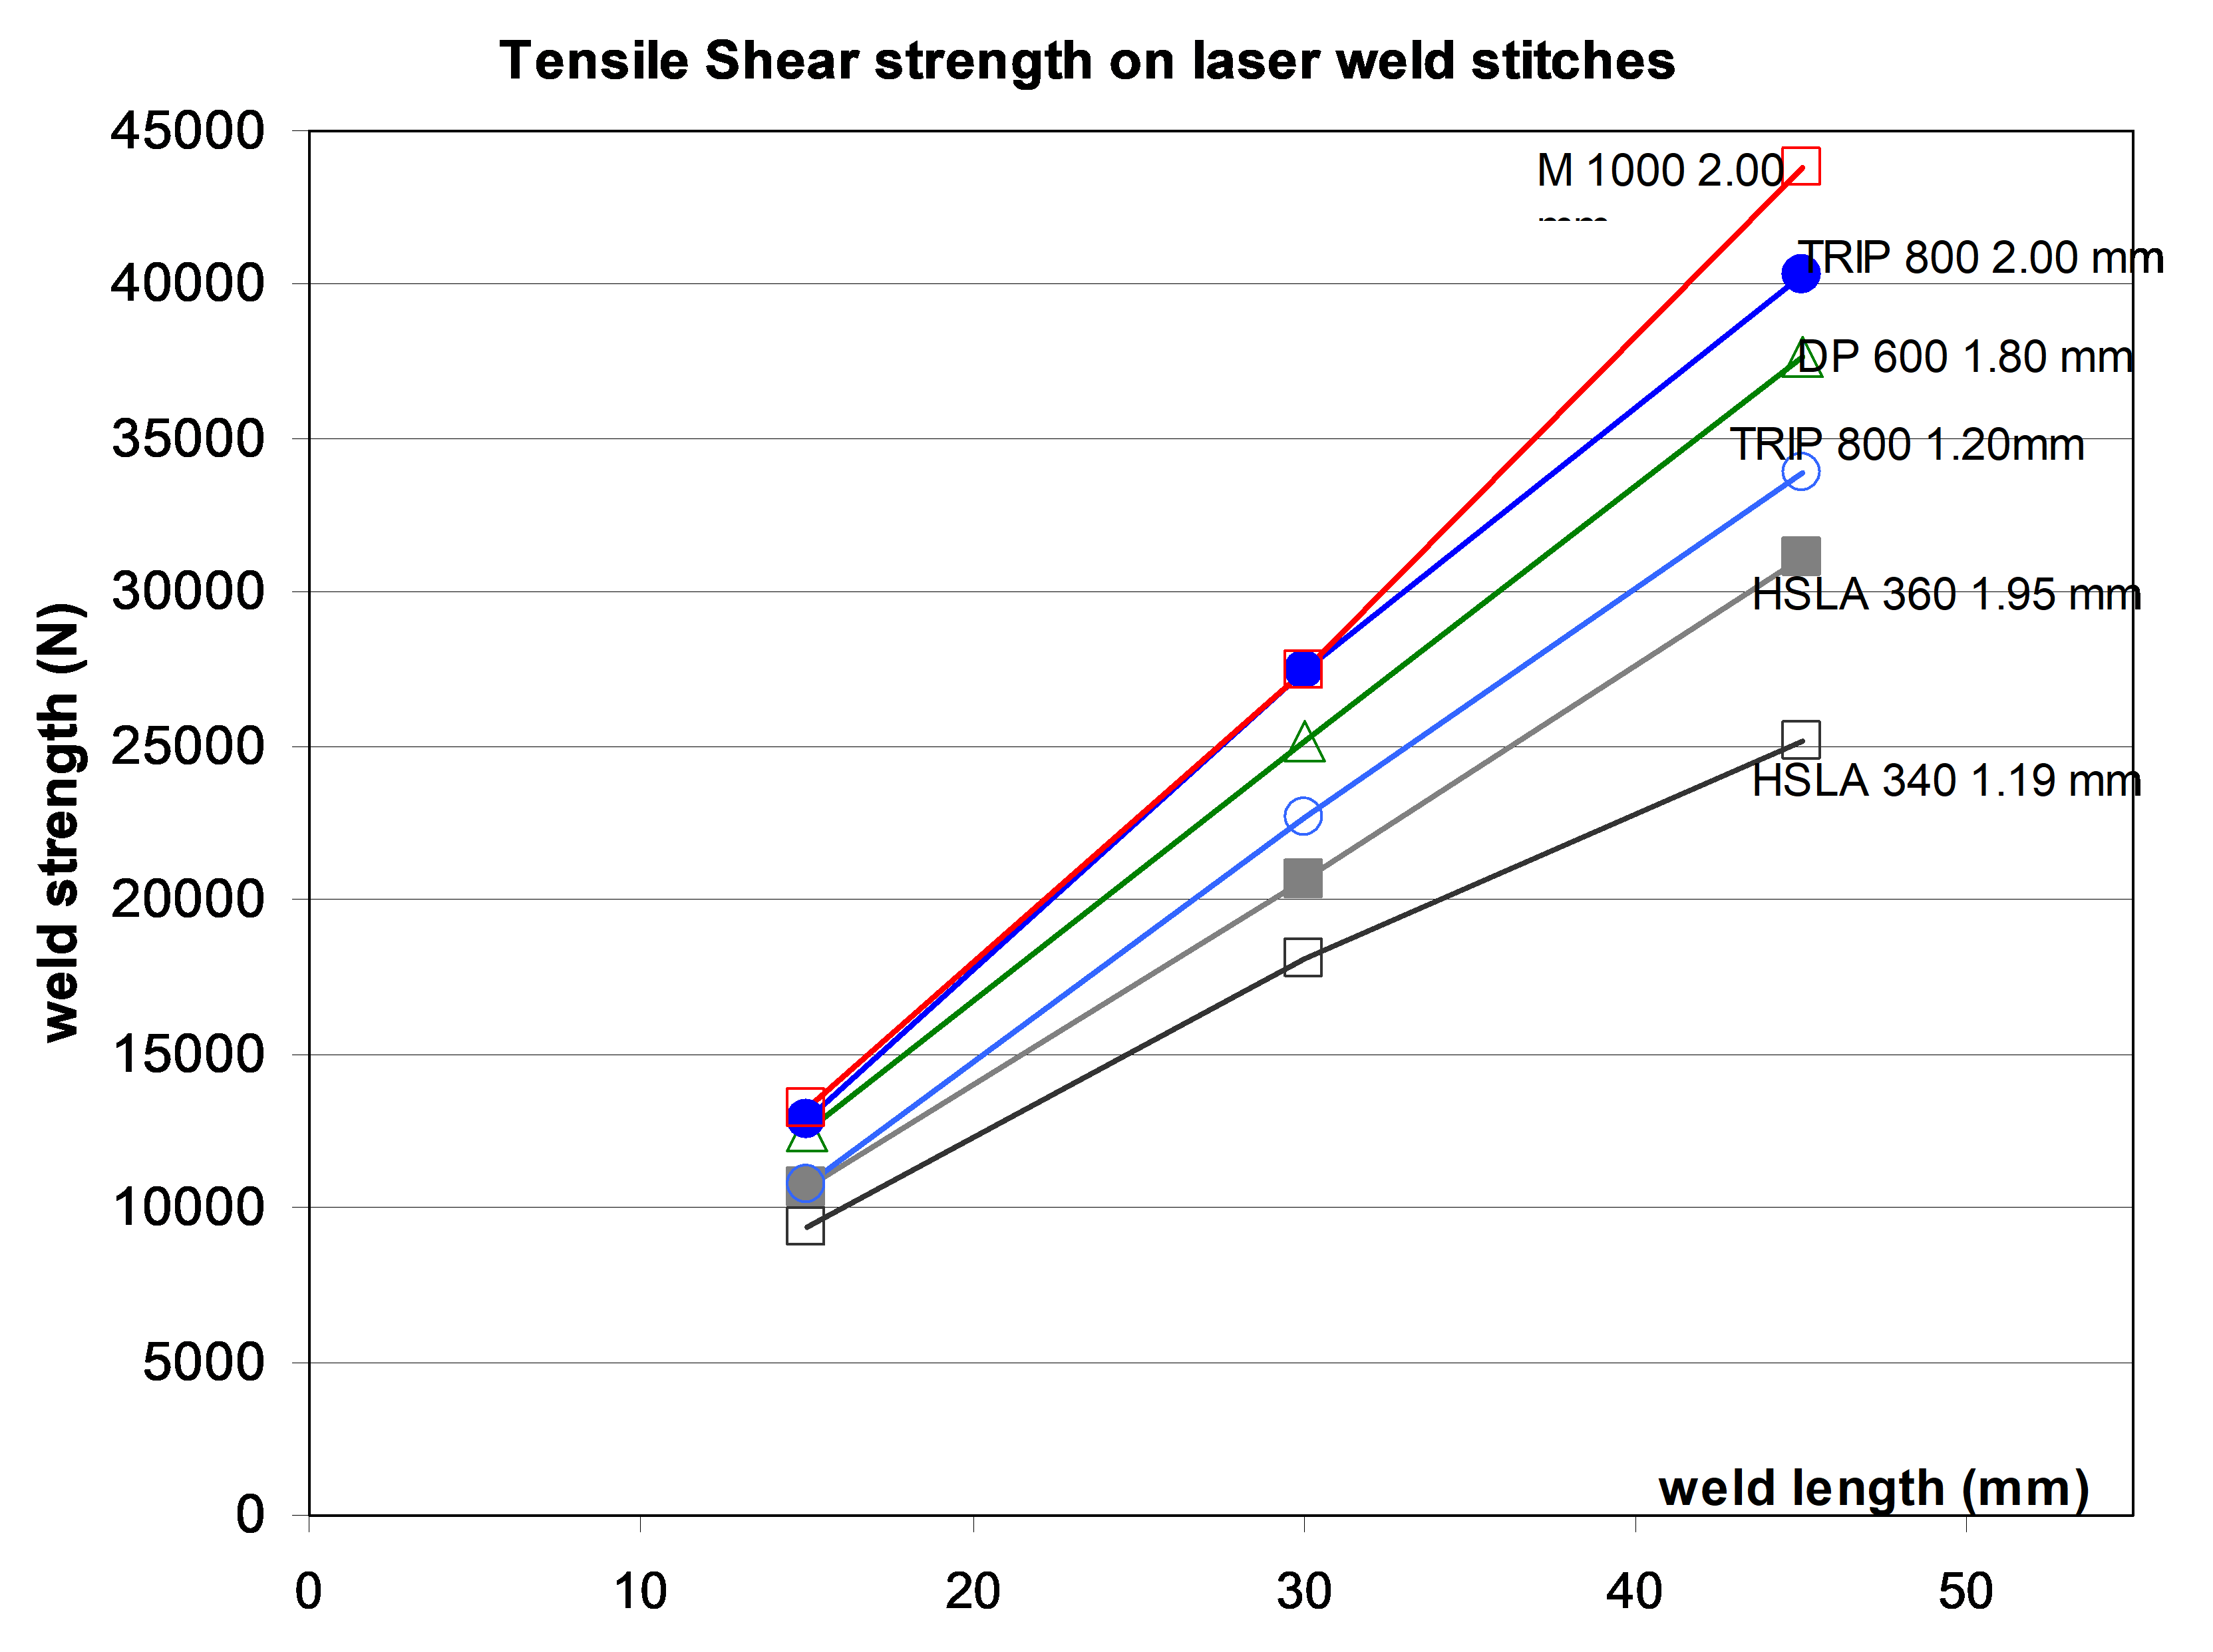
Figure 2: Tensile-shear strength on laser weld stitches of different length.A-16
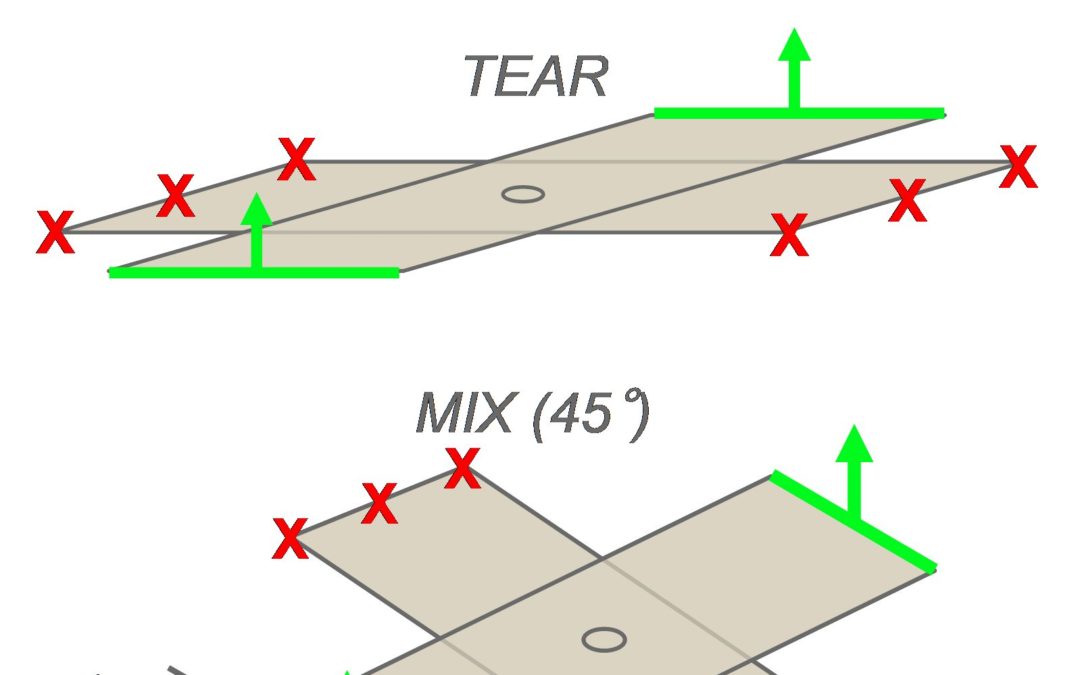
However, a comparison of spot weld to laser weld strength cannot be restricted to the basic tensile shear test. Tests were also conducted to evaluate the weld strength in both quasi-static and dynamic conditions under different solicitations, on various AHSS combinations. The trials were performed on a high-speed testing machine, at 5 mm/min for the quasi-static tests and 0.5 m/s for the dynamic tests (pure shear, pure tear or mixed solicitation, as shown in Figure 3). The strength at failure and the energy absorbed during the trial were measured. Laser stitches were done at 27mm length. C- and S-shape welds were performed with the same overall weld length.
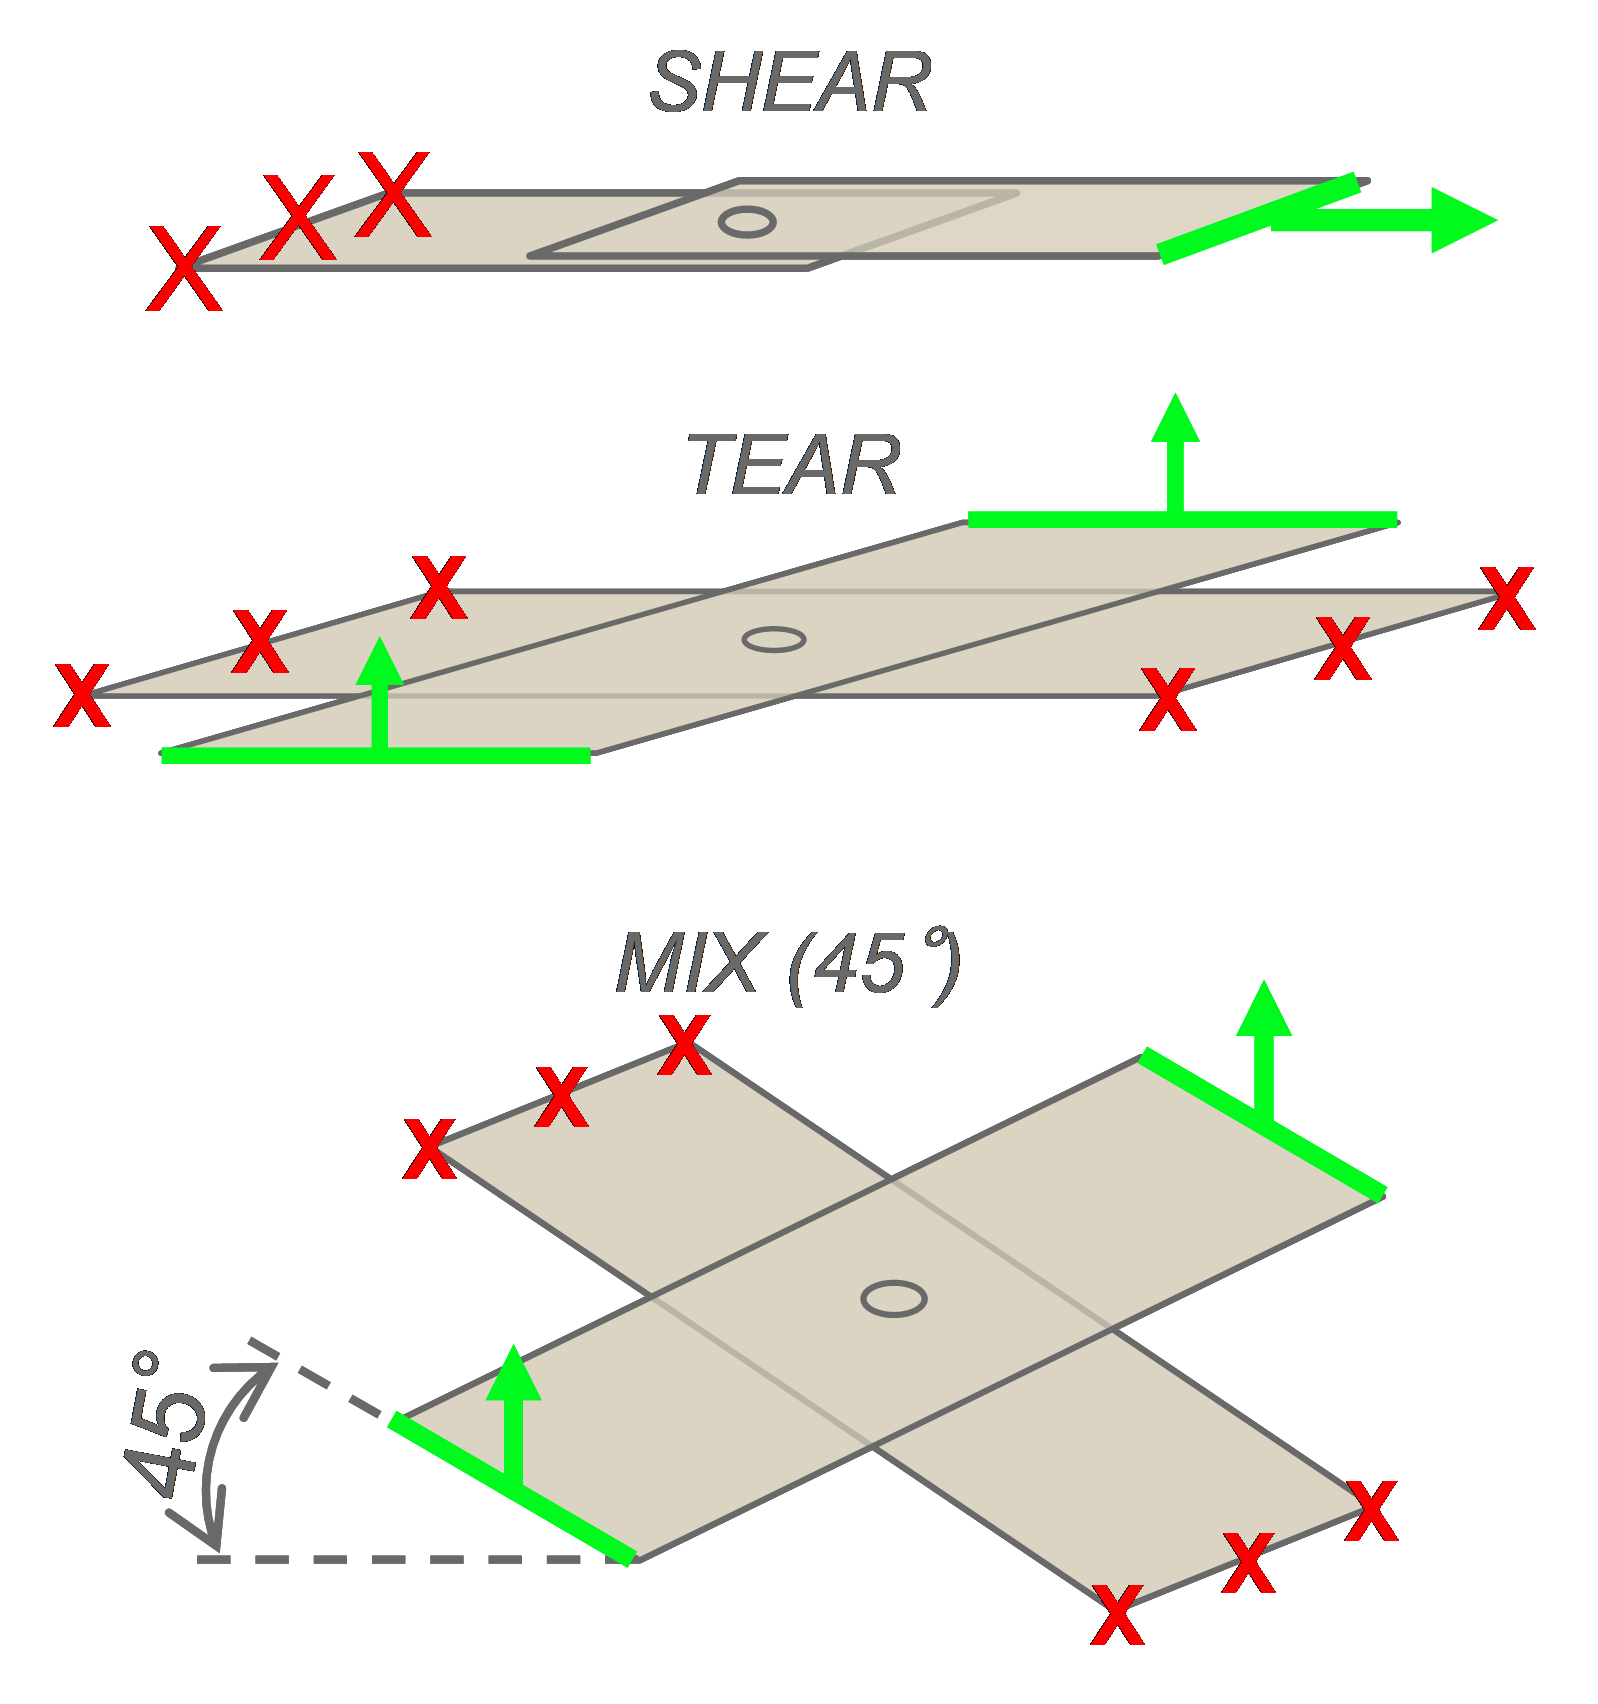
Figure 3: Sample geometry for quasi-static and dynamic tests.A-16
The weld strength at failure is described in Figure 4, where major axes represent pure shear and tear (Figure 4). For a reference spot weld corresponding to the upper limit of the weldability range, globally similar weld properties can be obtained with 27mm laser welds. The spot weld equivalent length of 25-30 mm has been confirmed on other test cases on AHSS in the 1.5- to 2 mm thickness range. It has also been noticed that the spot weld equivalent length is shorter on thin mild steel (approximately 15-20 mm). This must be considered when shifting from spot to laser welding on a given structure. There is no major strain rate influence on the weld strength; the same order of magnitude is obtained in quasi-static and dynamic conditions.
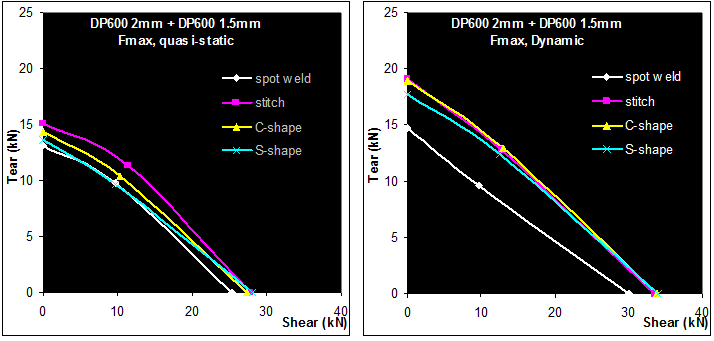
Figure 4: Quasi-static and dynamic strength of welds, DP 600 2 mm+1.5 mm.A-16
The results in terms of energy absorbed by the sample are seen in Figure 5. In tearing conditions, both the strength at fracture and energy are lower for the spot weld than for the various laser welding procedures. In shear conditions, the strength at fracture is equivalent for all the welding processes. However, the energy absorption is more favorable to spot welds. This is due to the different fracture modes of the welds; for example, interfacial fracture is observed on the laser welds under shearing solicitation. Even if the strength at failure is as high as for the spot welds, this severe failure mode leads to lower total energy absorption.
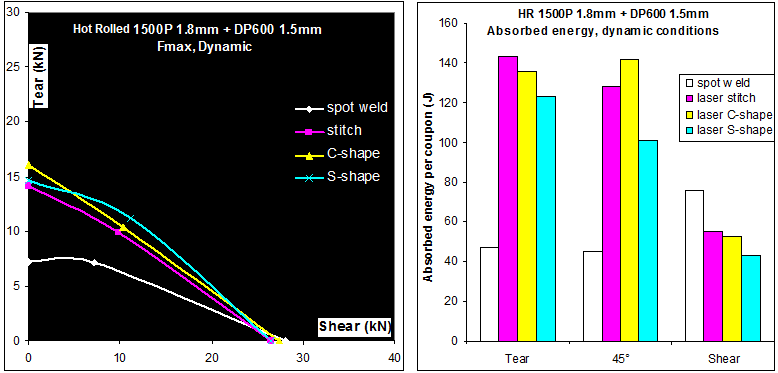
Figure 5: Strength at fracture and energy absorption of Hot Rolled 1500 1.8-mm + DP 600 1.5-mm samples for various welding conditions.A-16
Figure 6 represents the energy absorbed by omega-shaped structures and the corresponding number of welds that fail during the frontal crash test (here on TRIP 800 grade). It appears clearly that laser stitches have the highest rate of fracture during the crash test (33%). In standard spot welding, some weld fractures also occur. It is known that AHSS are more prone to partial interfacial fracture on coupons, and some welds fail as well during crash tests. By using either Weld-Bonding or adapted laser welding shapes, weld fractures are mitigated, even in the case of severe deformation. As a consequence, higher energy absorption is also observed.
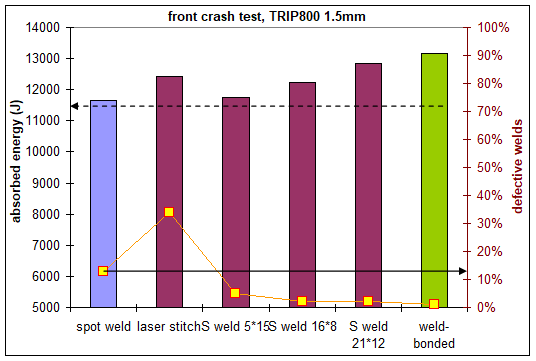
Figure 6: Welding process and weld shape influence on the energy absorption and weld integrity on frontal crash tests.A-16
Up to a 20% improvement can be achieved in torsional stiffness, where the best results reflected the combination of laser welds and adhesives. Adhesive bonding and weld- bonding lead to the same stiffness improvement results due to the adhesive rather than the additional welds. Figure 7 shows the evolution of the torsional stiffness with the joining process. Optimized laser joining design leads to the same performances as a weld bonded sample in fracture modes, shown in Figure 8.
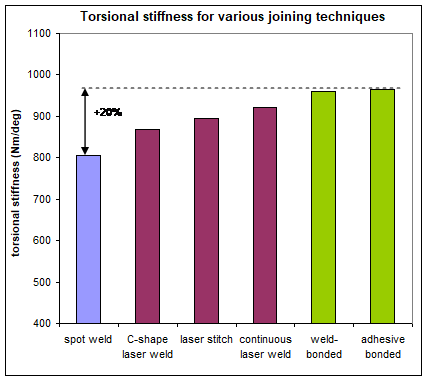
Figure 7: Evolution of the torsional stiffness with the joining process.A-16
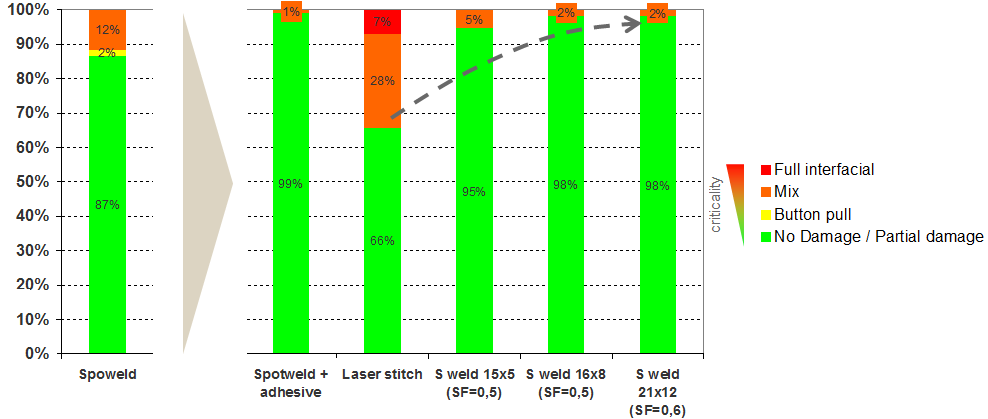
Figure 8: Validation test case 1.2-mmTRIP 800/1.2-mm hat-shaped TRIP 800.
Top-hat crash boxes were tested across a range of AHSS materials including DP 1000. The spot weld’s energy absorption increased linearly with increasing material strength. The adhesives were not suitable for crash applications as the adhesive peels open along the entire length of the joint. The weld bonded samples perform much better than conventional spot welds. Across the entire range of materials there was a 20-30% increase in mean force when weld bonding was used; the implications suggesting a similarly significant improvement in crash performance. Furthermore, results show that a 600 MPa weld bonded steel can achieve the same crash performance as a 1000 MPa spot-welded steel. It is also possible that some down gauging of materials could be achieved, but as the strength of the crash structure is highly dependent upon sheet thickness, only small gauge reductions would be possible. Figure 9 shows the crash results for spot-welded and weld bonded AHSS.
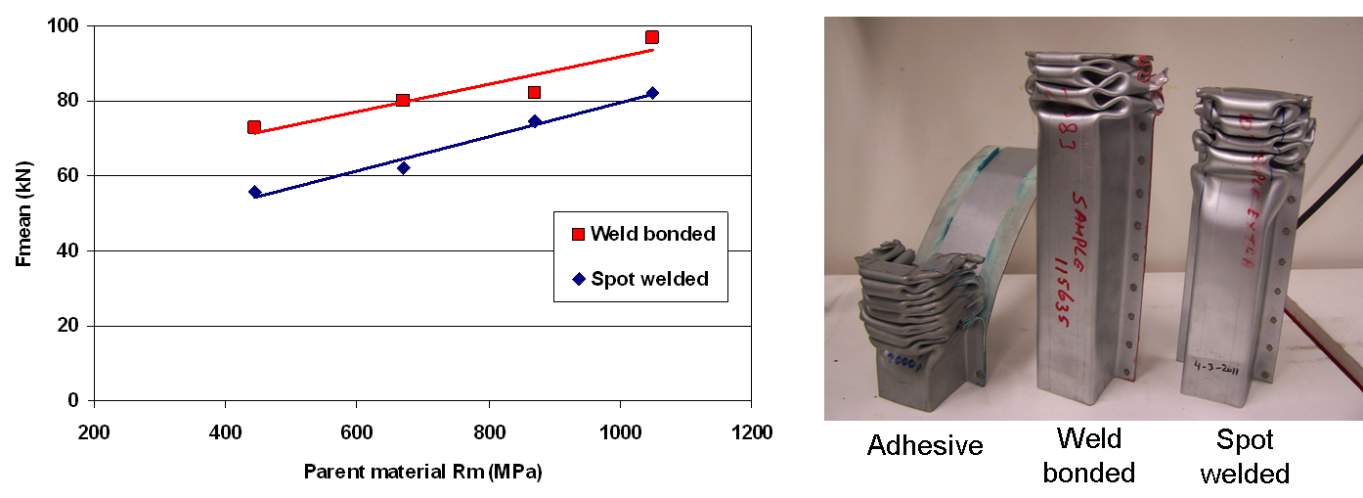
Figure 9: Crash results for spot-welded and weld bonded AHSS.