Resistance Welding Steel to Aluminium
This article summarizes a paper entitled, “Process, Microstructure and Fracture Mode of Thick Stack-Ups of Aluminum Alloy to AHSS Dissimilar Metal Spot Joints”, by Luke Walker, Colleen Hilla, Menachem Kimchi, and Wei Zhang, Department of Materials Science and Engineering, The Ohio State University.W-9
Researchers at The Ohio State University studied the effects of adding a stainless steel (SS) insert to a dissimilar Advanced High-Strength Steel (AHSS) to aluminum (Al) resistance spot weld (RSW). The SS insert was ultrasonically welded to the Al sheet prior to the RSW being performed. The purpose of the SS is to reduce the intermetallic layer that forms when welding steel to aluminum. This process increases the strength and toughness of the weld. In this study, the process is applied to three sheet (3T) stack up that contains one Al sheet and two 1.2 mm thick Press Hardened (PH) 1500 sheets. The joint strength is measured in lap shear testing and the intermetallic thickness/ morphology is studied after cross sectioning the welds.
During the microstructure evaluation it was noted that Al 6022 contained a larger nugget diameter as compared to the Al 5052 welds. A few potential reasons for the hotter welds were proposed including cleanliness of the electrodes, surface oxides, and thickness of the different alloys. The welds on the Al 5052 stack ups were made first on clean electrodes whereas the Al 6022 was made on potentially dirty electrodes that increased the contact resistance. The effects of different surface oxides are not likely given the SS sheet is ultrasonically welded but could still add to the higher heat input in the RSW. The Al 6022 is 0.2 mm thicker, which could increase the bulk resistance and decrease the cooling effect from the electrodes.
The 3T welds likely had much lower strength and toughness due to cracks that formed at the Al-SS insert interface. These can be attributed to an increase in intermetallic compound (IMC) thickness and the residual stress caused by the forge force. The IMC thickness was measured two ways: The first measurement was of the continuous IMC layer and the second was from the Al-Fe interface to the end of the IMC dendrites (Figure 1, 2 and Table 1). The Al 5052 observed the thickest continuous IMC layer but Al 6022 was close to the Al 5052 thickness. This can be attributed to the increased Si content of Al 6022 which has been shown to decrease the growth of Fe-Al intermetallics.
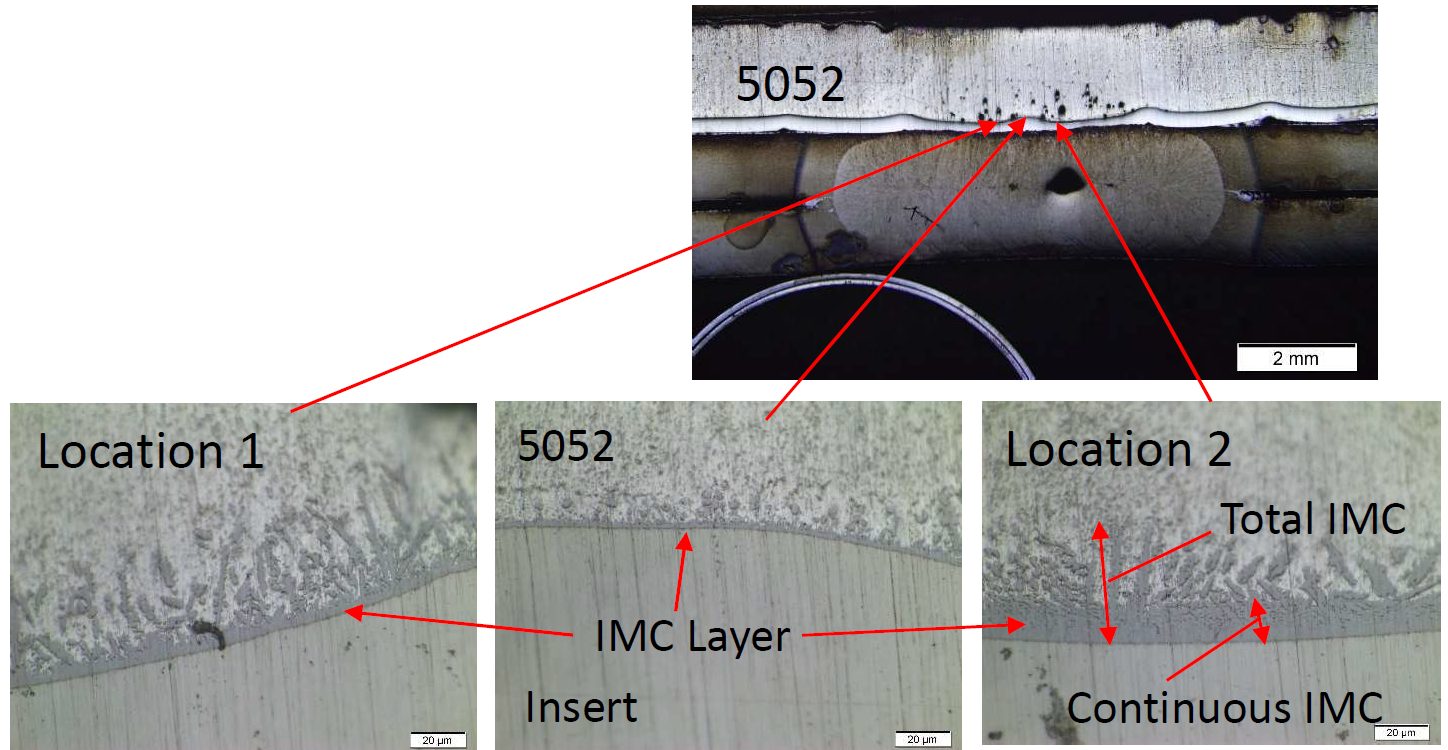
Figure 1: IMC in the Al Alloy 5052 to Stainless-Steel Weld.W-9
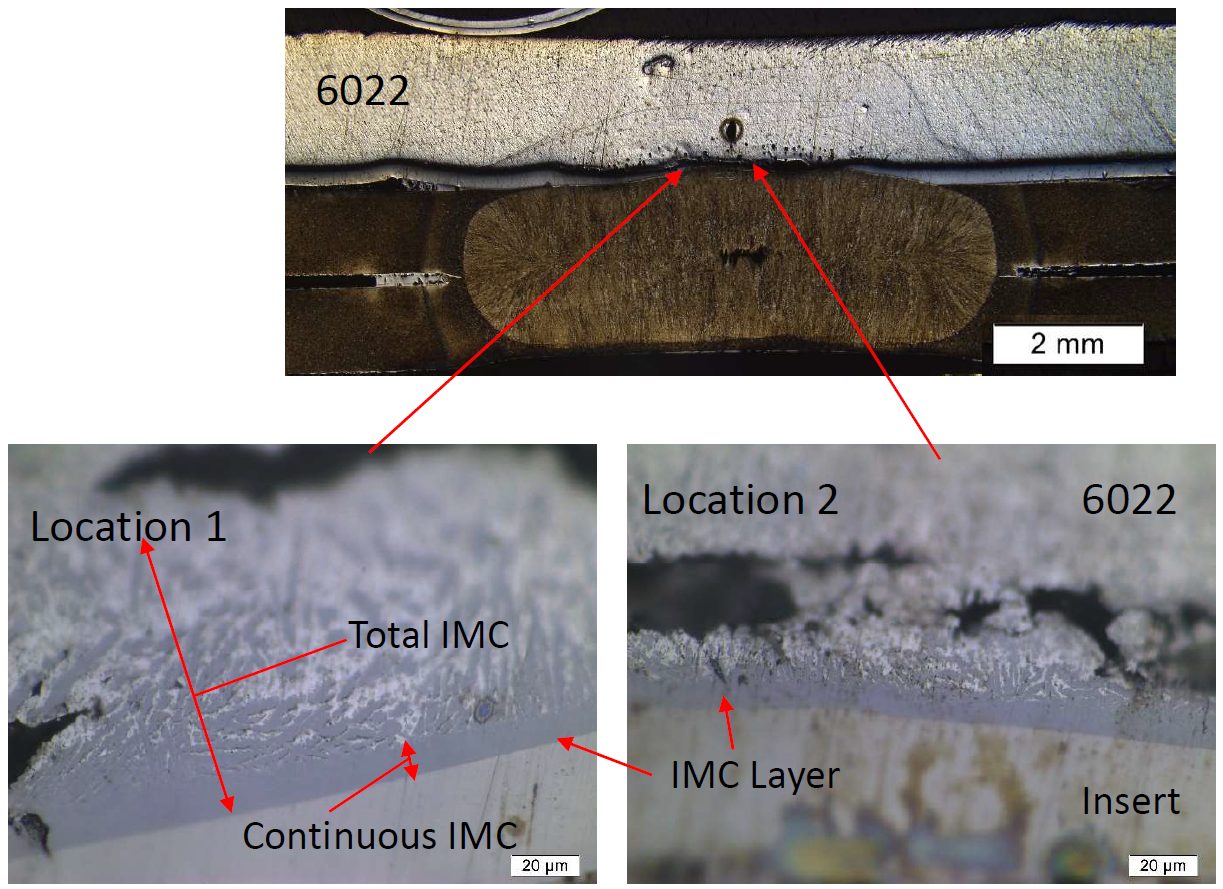
Figure 2: IMC in the Al Alloy 6022 to Stainless-Steel Weld.W-9
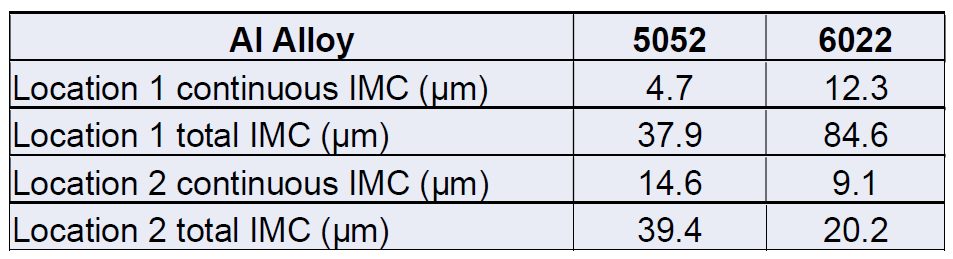
Table 1: IMC Thickness of Both the 5052 Weld and the 6022 Weld.W-9
Referencing Figure 3, the 2T stack-up has a higher tensile strength as well as significantly higher fracture energy absorbed compared to the 3T stack-ups. This is mainly attributed to the failure mode observed in the different stack-ups. The 2T welds had button pullout failure while 3T stack-ups had interfacial Failure.
![Figure 3: Failure Load and Fracture Energy [(A) Al to steel (Al-Us) welds and (B) steel to steel (Us-Us) welds (the 2T 6022 results are from previous work(10))]W-9](https://ahssinsights.org/wp-content/uploads/2021/12/fig4-process.jpg)
Figure 3: Failure Load and Fracture Energy [(A) Al to steel (Al-Us) welds and (B) steel to steel (Us-Us) welds (the 2T 6022 results are from previous work(10))]W-9
The Al 6022 contains higher Si content which likely decreased the growth of the continuous IMC layer but not the overall IMC layer (as seen in Figure 4 and Figure 5) due to higher weld temperatures. The joint strength of the welds in the 3T stack-ups were closer to the expected weld strength unless there was expulsion that caused a 5-kN drop in strength.
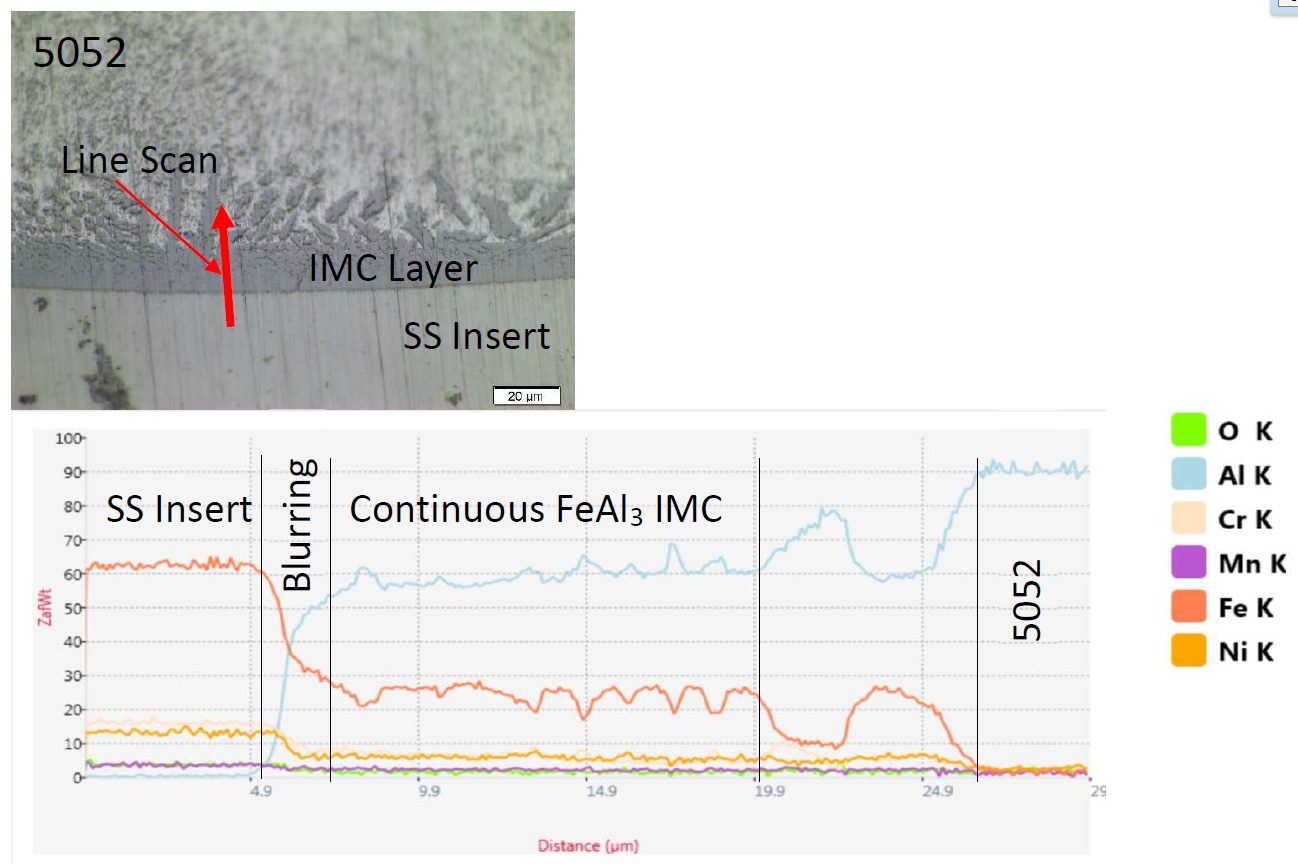
Figure 4: EDS Line Scan of the IMC in Location 2 on the 5052 3T Sample (SS stands for austenitic stainless steel 316).W-9
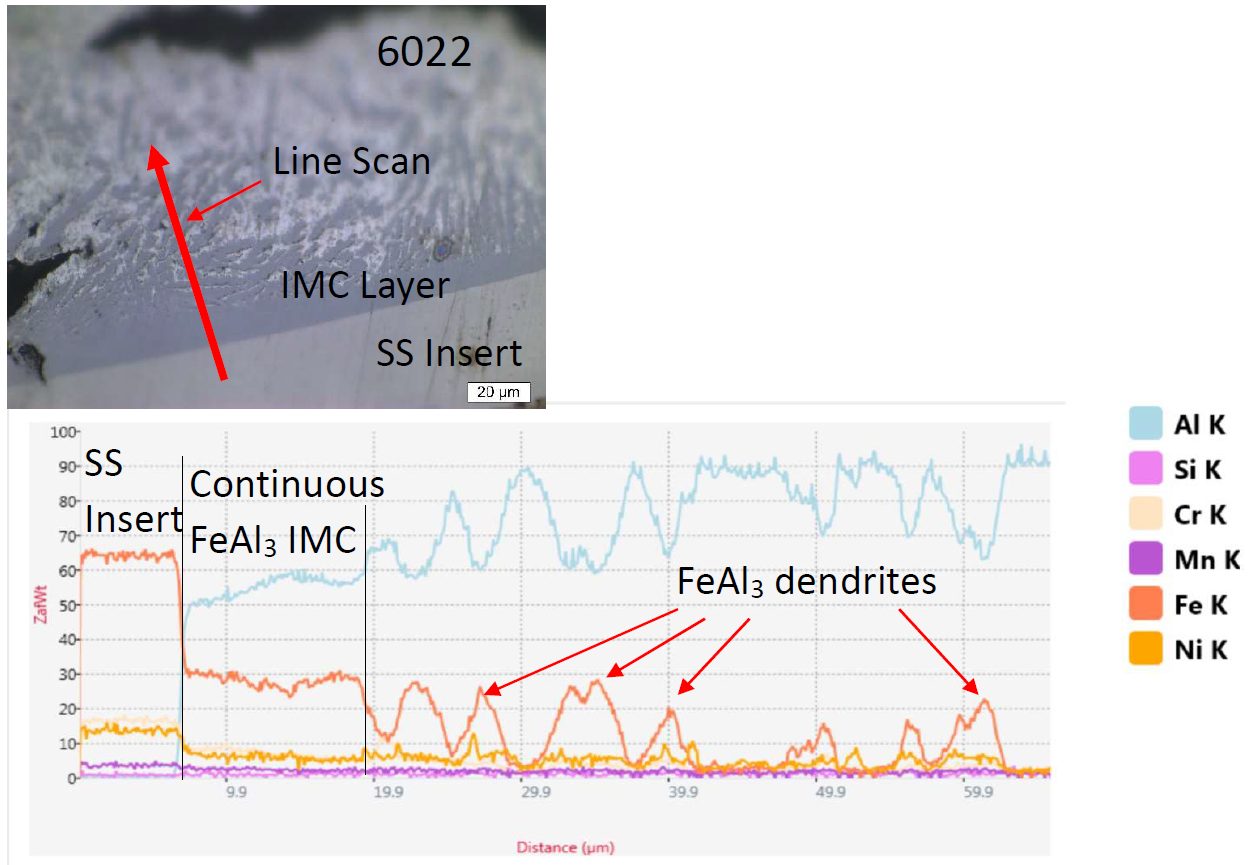
Figure 5: EDS Line Scan of the Intermetallic Layer at Location 1 on the 6022 3T Sample (SS stands for austenitic stainless steel 316).W-9
Laser Welding
This article summarizes the findings of a paper entitled, “Hot cracking investigation during laser welding of high-strength steels with multi-scale modelling approach”, by H. Gao, G. Agarwal, M. Amirthalingam, M. J. M. Hermans.G-4
Researchers at Delft University of Technology (TU Delft) in The Netherlands and Indian Institute of Technology Madras in India attempted to model Hot Cracking susceptibility in TRIP and DP steels. For this experiment, TRIP and DP steels are laser welded and the temperatures experienced are recorded with thermocouples at three positions. Temperatures experienced during welding are measured and used to validate a finite element model which is then used to extract the thermal gradient and cooling rate to be used as boundary conditions in a phase field model. The phase field model is used to simulate microstructural evolution during welding and specifically during solidification. The simulation and experimental data had good agreement with max temperature deviation below 4%.
Summary
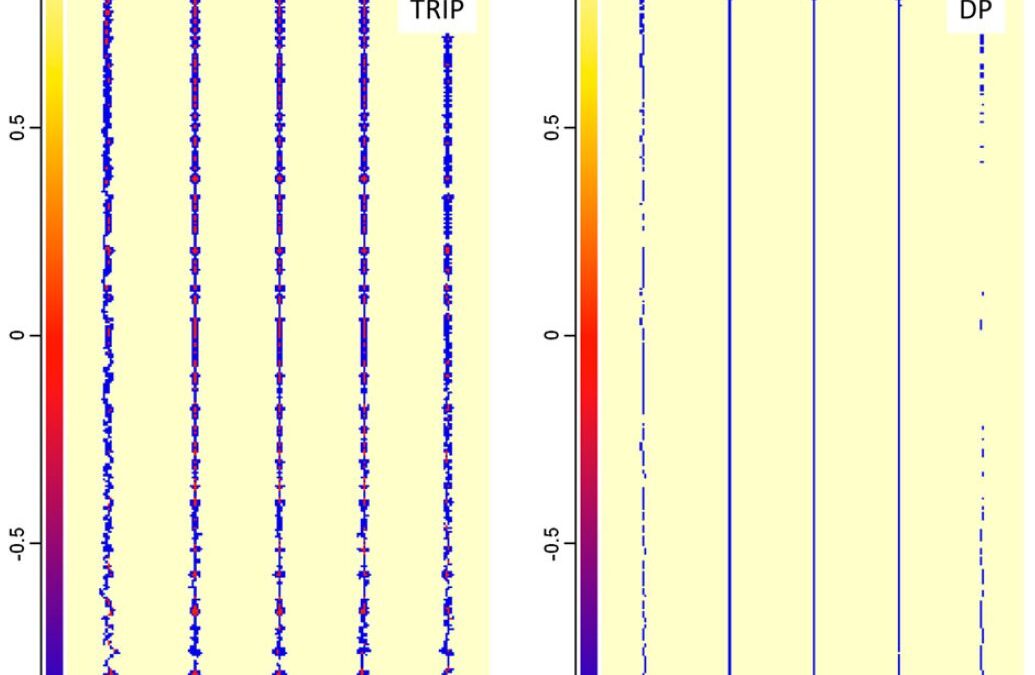
Referencing Figure 1 (Figure 6 in the original paper) which shows the microstructure where the dendritic tips meet the wel, centerline, it is observed that TRIP steels reach a solid fraction of 93.7% and DP steels reach a solid fraction of 96.3% meaning that TRIP steels have a larger solidification range than the DP steels. Figure 8 shows the phosphorus distribution where the dendritic tips reach the weld centerline. TRIP steels show a concentration of up to 0.55 wt-% where segregation occurs compared to the original composition of 0.089 wt-%. DP steels show a max of 0.06 wt-% which is significantly lower than the TRIP steels. In addition to phosphorus, Al is seen in high concentration in TRIP steels which contributes to the broder solidification range. A pressure drop is the last factor contributing to the Hot Cracking observed in TRIP steels(figure 2). The pressure drop is due to a lack of extra liquid feeding in the channels and forms a pressure difference from the dendrite tip to root. The pressure drop in TRIP steels is calculates to 941.2 kPa and 10.2 kPa in DP steels. The combination of element segregation, pressure drop, and thermal tensile stresses induced during laser welding results in a higher Hot Cracking susceptibility in TRIP steels as compared to DP steels.
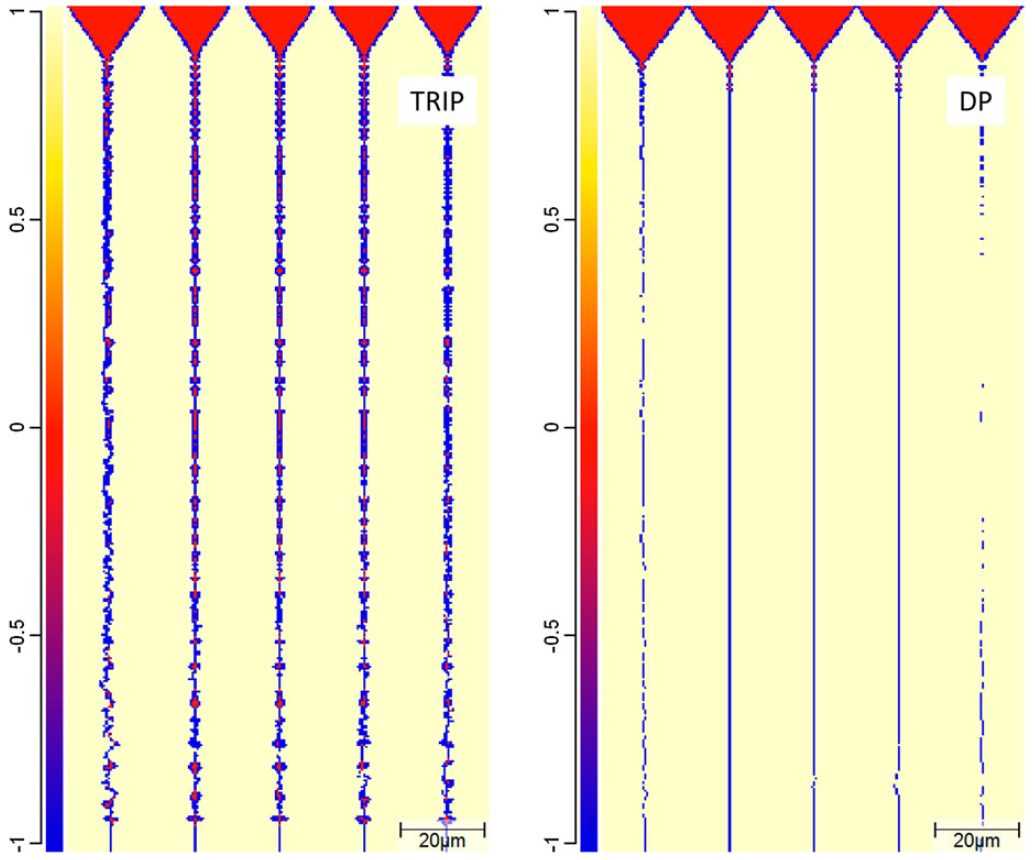
Figure 1: Phase distributions in the TRIP and the DP steel when the dendritic tips reach the weld centreline.G-4
Joining, Laser Welding, Press Hardened Steels
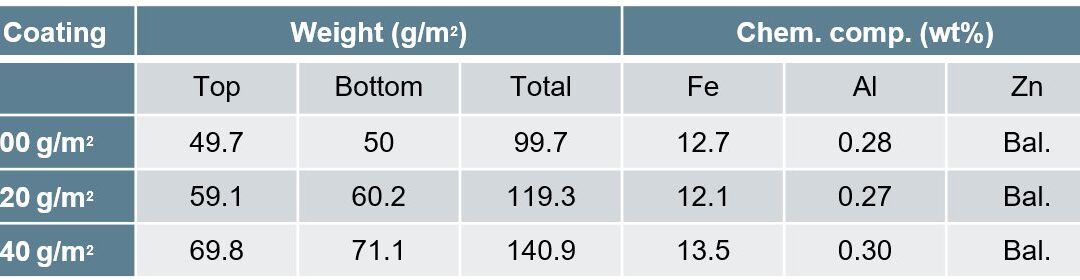
This studyR-25, conducted by the Centre for Advanced Materials Joining, Department of Mechanical & Mechatronics Engineering, University of Waterloo, and ArcelorMittal Global Research, utilized 2mm thick 22MnB5 steel with three different coating thicknesses, given in Table 1. The fiber laser welder used 0.3mm core diameter, 0.6mm spot size, and 200mm beam focal length. The trials were done with a 25° head angle with no shielding gas but high pressure air was applied to protect optics. Welding passes were performed using 3-6kW power increasing by 1 kW and 8-22m/min welding speed increasing by 4m/min. Compared to the base metal composition of mostly ferrite with colonies of pearlite, laser welding created complete martensitic composition in the FZ and fully austenized HAZ while the ICHAZ contained martensite in the intergranular regions where austenization occurred.
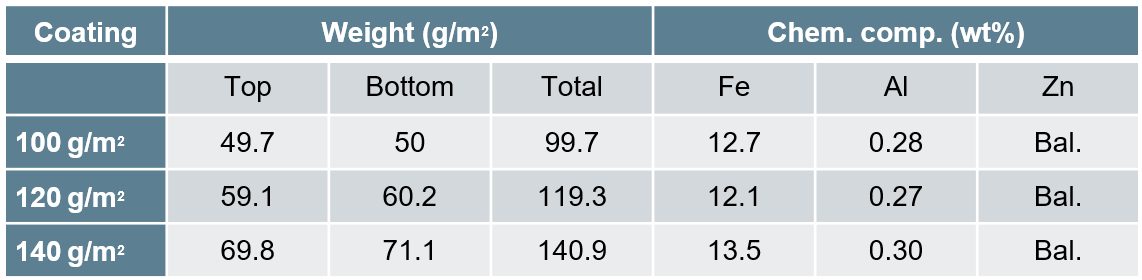
Table 1: Galvanneal Coatings.R-25
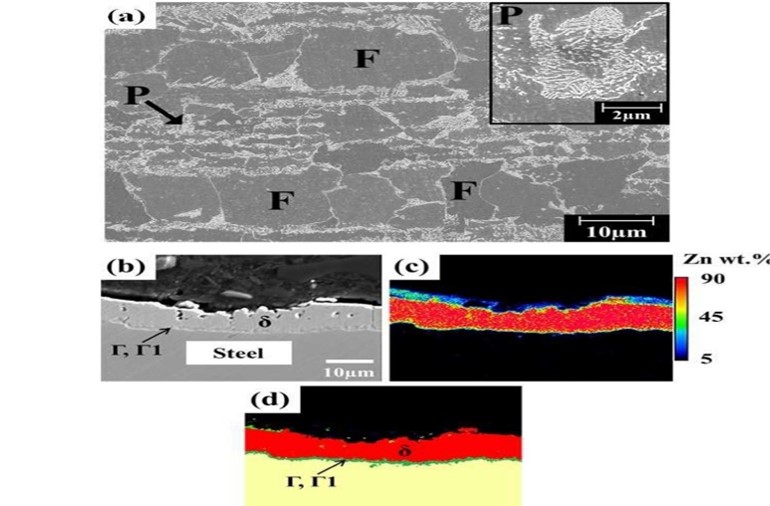
Figure 1: Base metal microstructure(P=pearlite, F=ferrite, Γ=Fe3Zn10, Γ1=Fe5Zn21 and δ=FeZn10).R-25
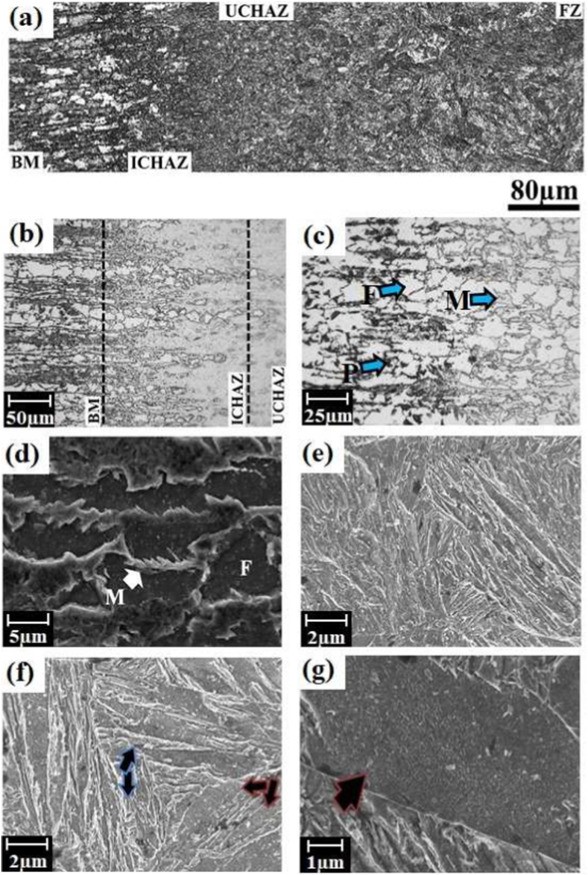
Figure 2: Welded microstructure — (a) overall view, (b) HAZ, (c) ICHAZ at low and (d) high magnifications, (e) UCHAZ (f) FZ, and (g) coarse-lath martensitic structure (where M; martensite, P: pearlite, F: ferrite).R-25
Given the lower boiling temperature of Zn at 900 °C as compared to Fe, the interaction of the laser with the Zn plasma that forms upon welding affects energy deliverance and depth of penetration. Lower coating weight of (100 g/m2) resulted in a larger process window as compared to (140 g/m2). Increased coating weight will reduce process window and need higher power and lower speeds in order to achieved proper penetration as shown in Figure 3 and Figure 4. Depth of penetration due to varying welding parameters was developed:
d=(H-8.6+0.08C)/(0.09C-4.8)
[d= depth of penetration(mm), H= heat input per unit thickness(J/mm2), C= coating weight(g/m2)]
Given the reduction in power deliverance, with an increase in coating weight there will be an expected drop in FZ and HAZ width. Regardless of the coating thickness, the HAZ maintained its hardness between BM and FZ. No direct correlation between coating thickness and YS, UTS, and elongation to fracture levels were observed. This is mainly due to the failure location being in the BM.
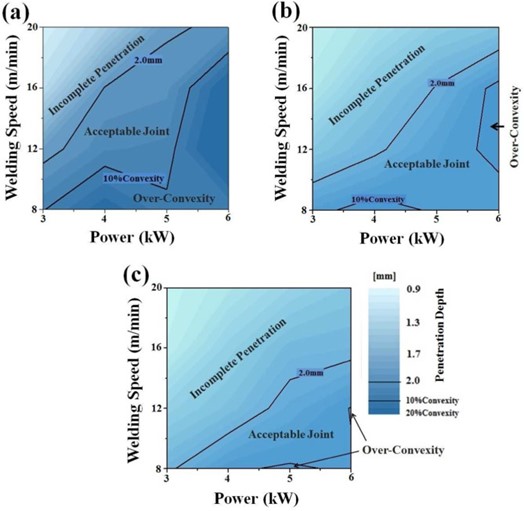
Figure 3: Process map of the welding window at coating weight of (a) 100 g/m2, (b) 120 g/m2, and (c) 140 g/m2.R-25
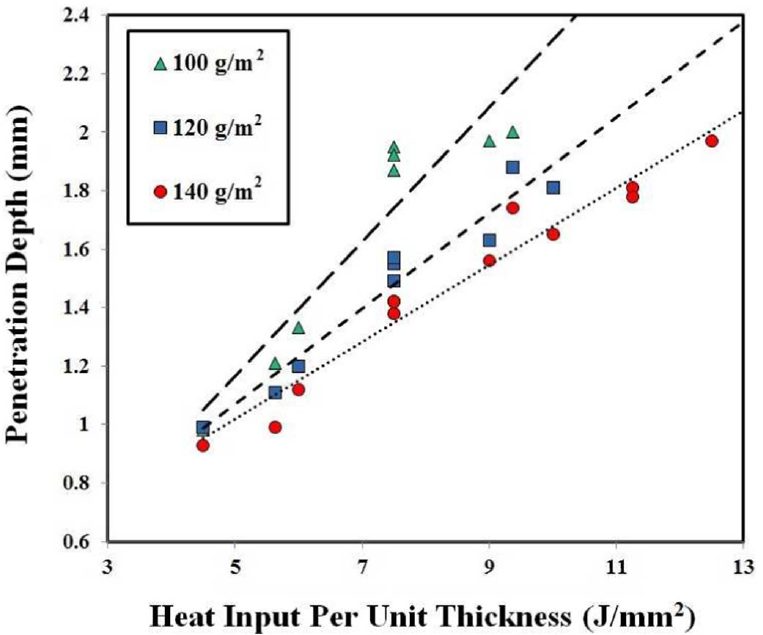
Figure 4: Heat input per unit thickness vs depth of penetration.R-25
Joining Dissimilar Materials, Laser Welding
Given the use of many different metals in the Body in White construction, it is important to understand the effects of dissimilar welding AHSS. Researchers at Indian Institute of Technology Madras in Chennai, India and Centre of Laser Processing of Materials in Hyderabad, India developed tests to study the resulting microstructure from laser welding 2.5 mm thick DP600 steel to 3 mm thick AA6061 aluminium alloy using a laser beam diameter of 1.5 mm.I-1 They discovered a softening in the steel HAZ due to a tempering effect and an increase in hardness in the aluminum HAZ due to the presence of aluminium intermetallic phases present. Maximum shear strength was observed when the thickness of intermetallics was reduced to 8-11 microns. They concluded that best quality welds were made under power densities and interaction times of 1.98kW/mm2, 0.15s and 2.26 kW/mm2, 0.187s.
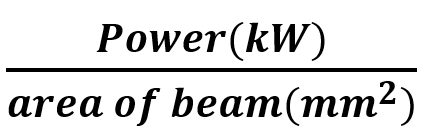
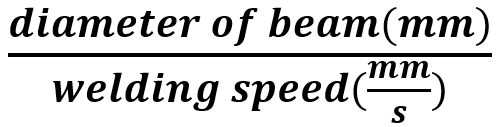
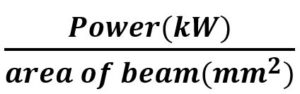
The laser power was varied from 3 kW to 4.5 kW and the scanning speed of 8 mm/s, 10 mm/s, and 12 mm/s. Power density and interaction time were two parameters they used to compare trials where:
| Power density (Pd) = |
 |
and
| interaction time (It) = |
 |
The resulting welding parameters are shown in Table 1 below. Figure 1 shows the microstructure of the fusion boundary and HAZ on the DP600 side of the welded joint. Figure 2 shows the microstructure of the weld interface on the AA 6061 side. Figure 3 displays the hardness data with (a) representing 3.5 kW and 10 mm/s, (b) representing 3.5 kW and 8 mm/s, and (c) representing 4 kW and 8 mm/s. Figure 4 represents the Shear Stress-Strain of the welds given different IMC thickness.
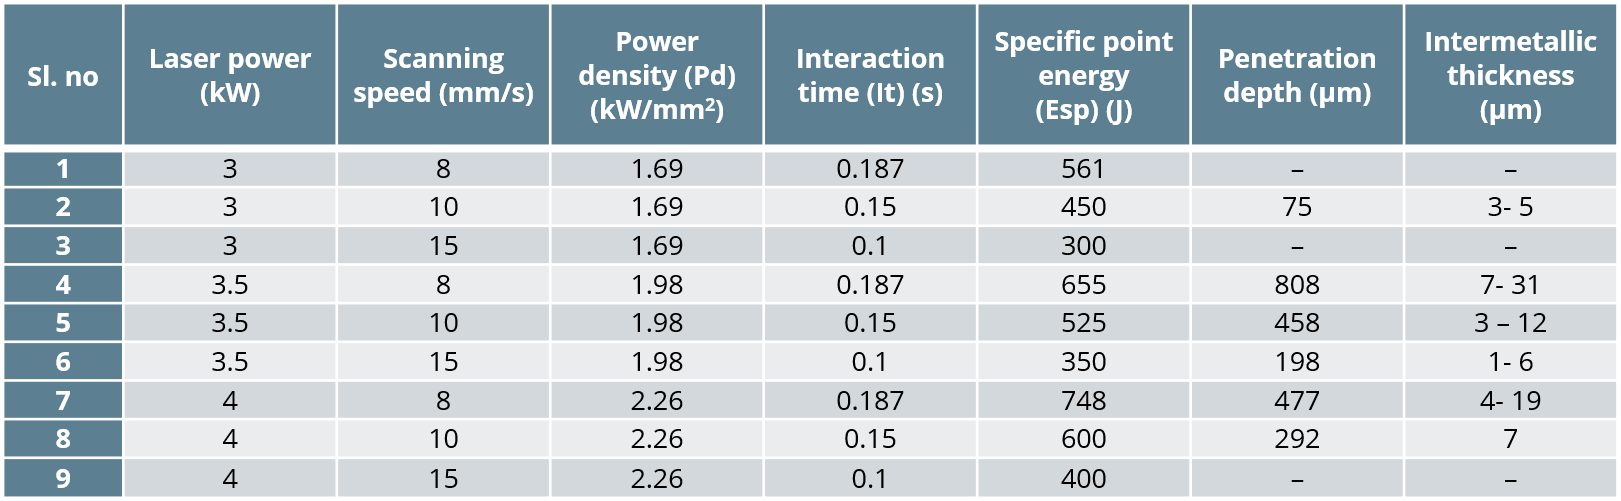
Table 1: Welding Parameters.I-1
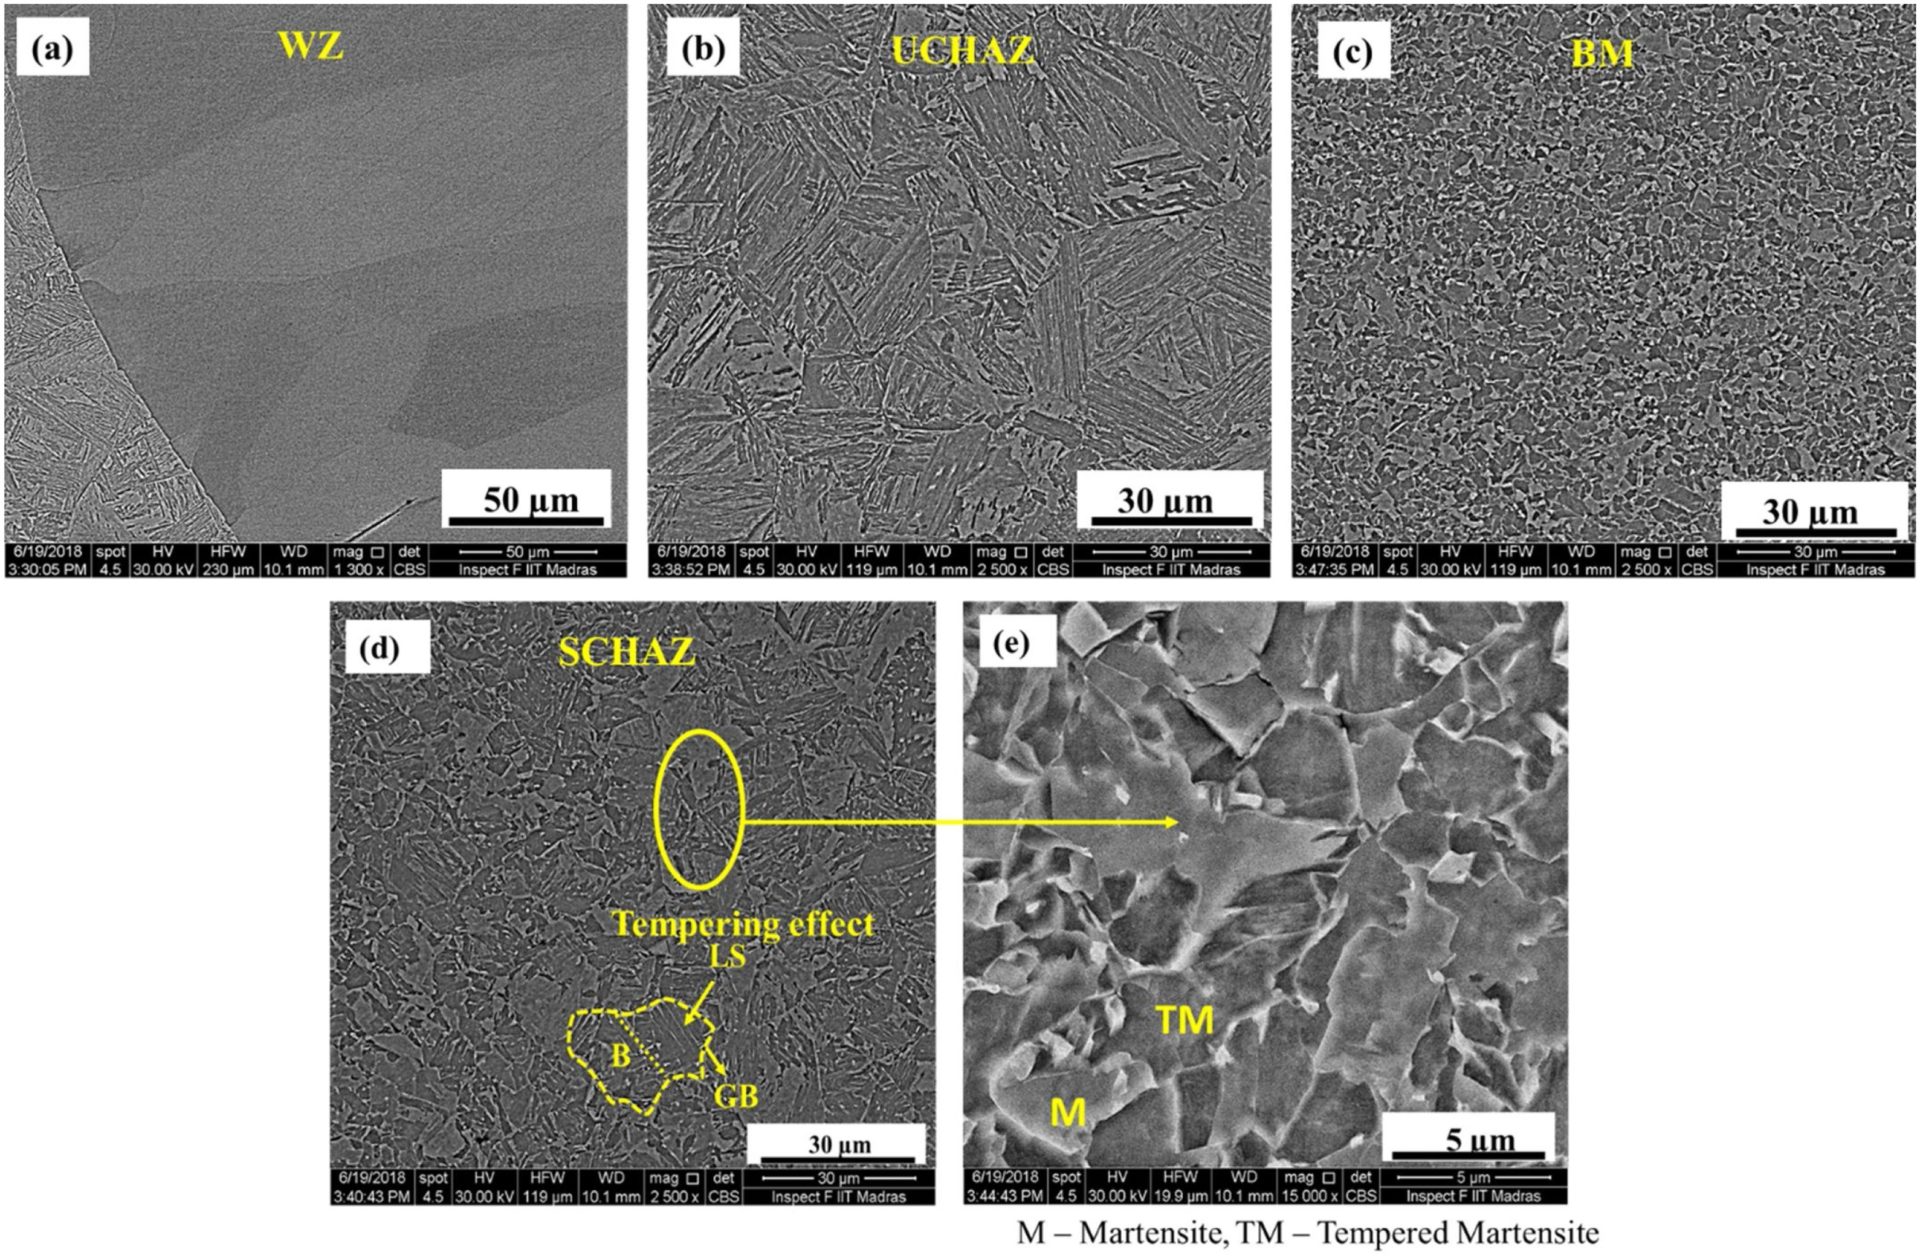
Figure 1: Weld Metal, DP 600 Base Metal and HAZ microstructure.I-1
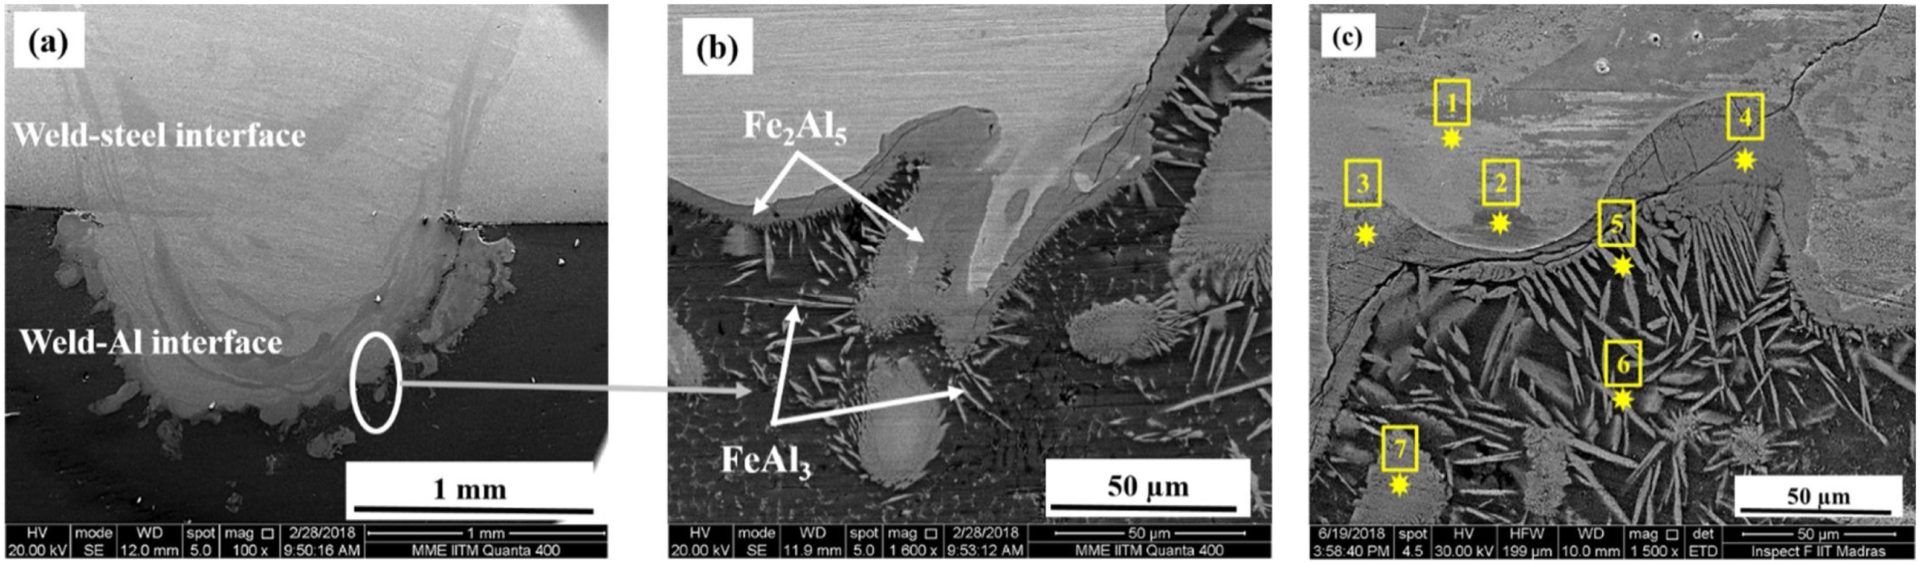
Figure 2: Fe-Al interface microstructure.I-1
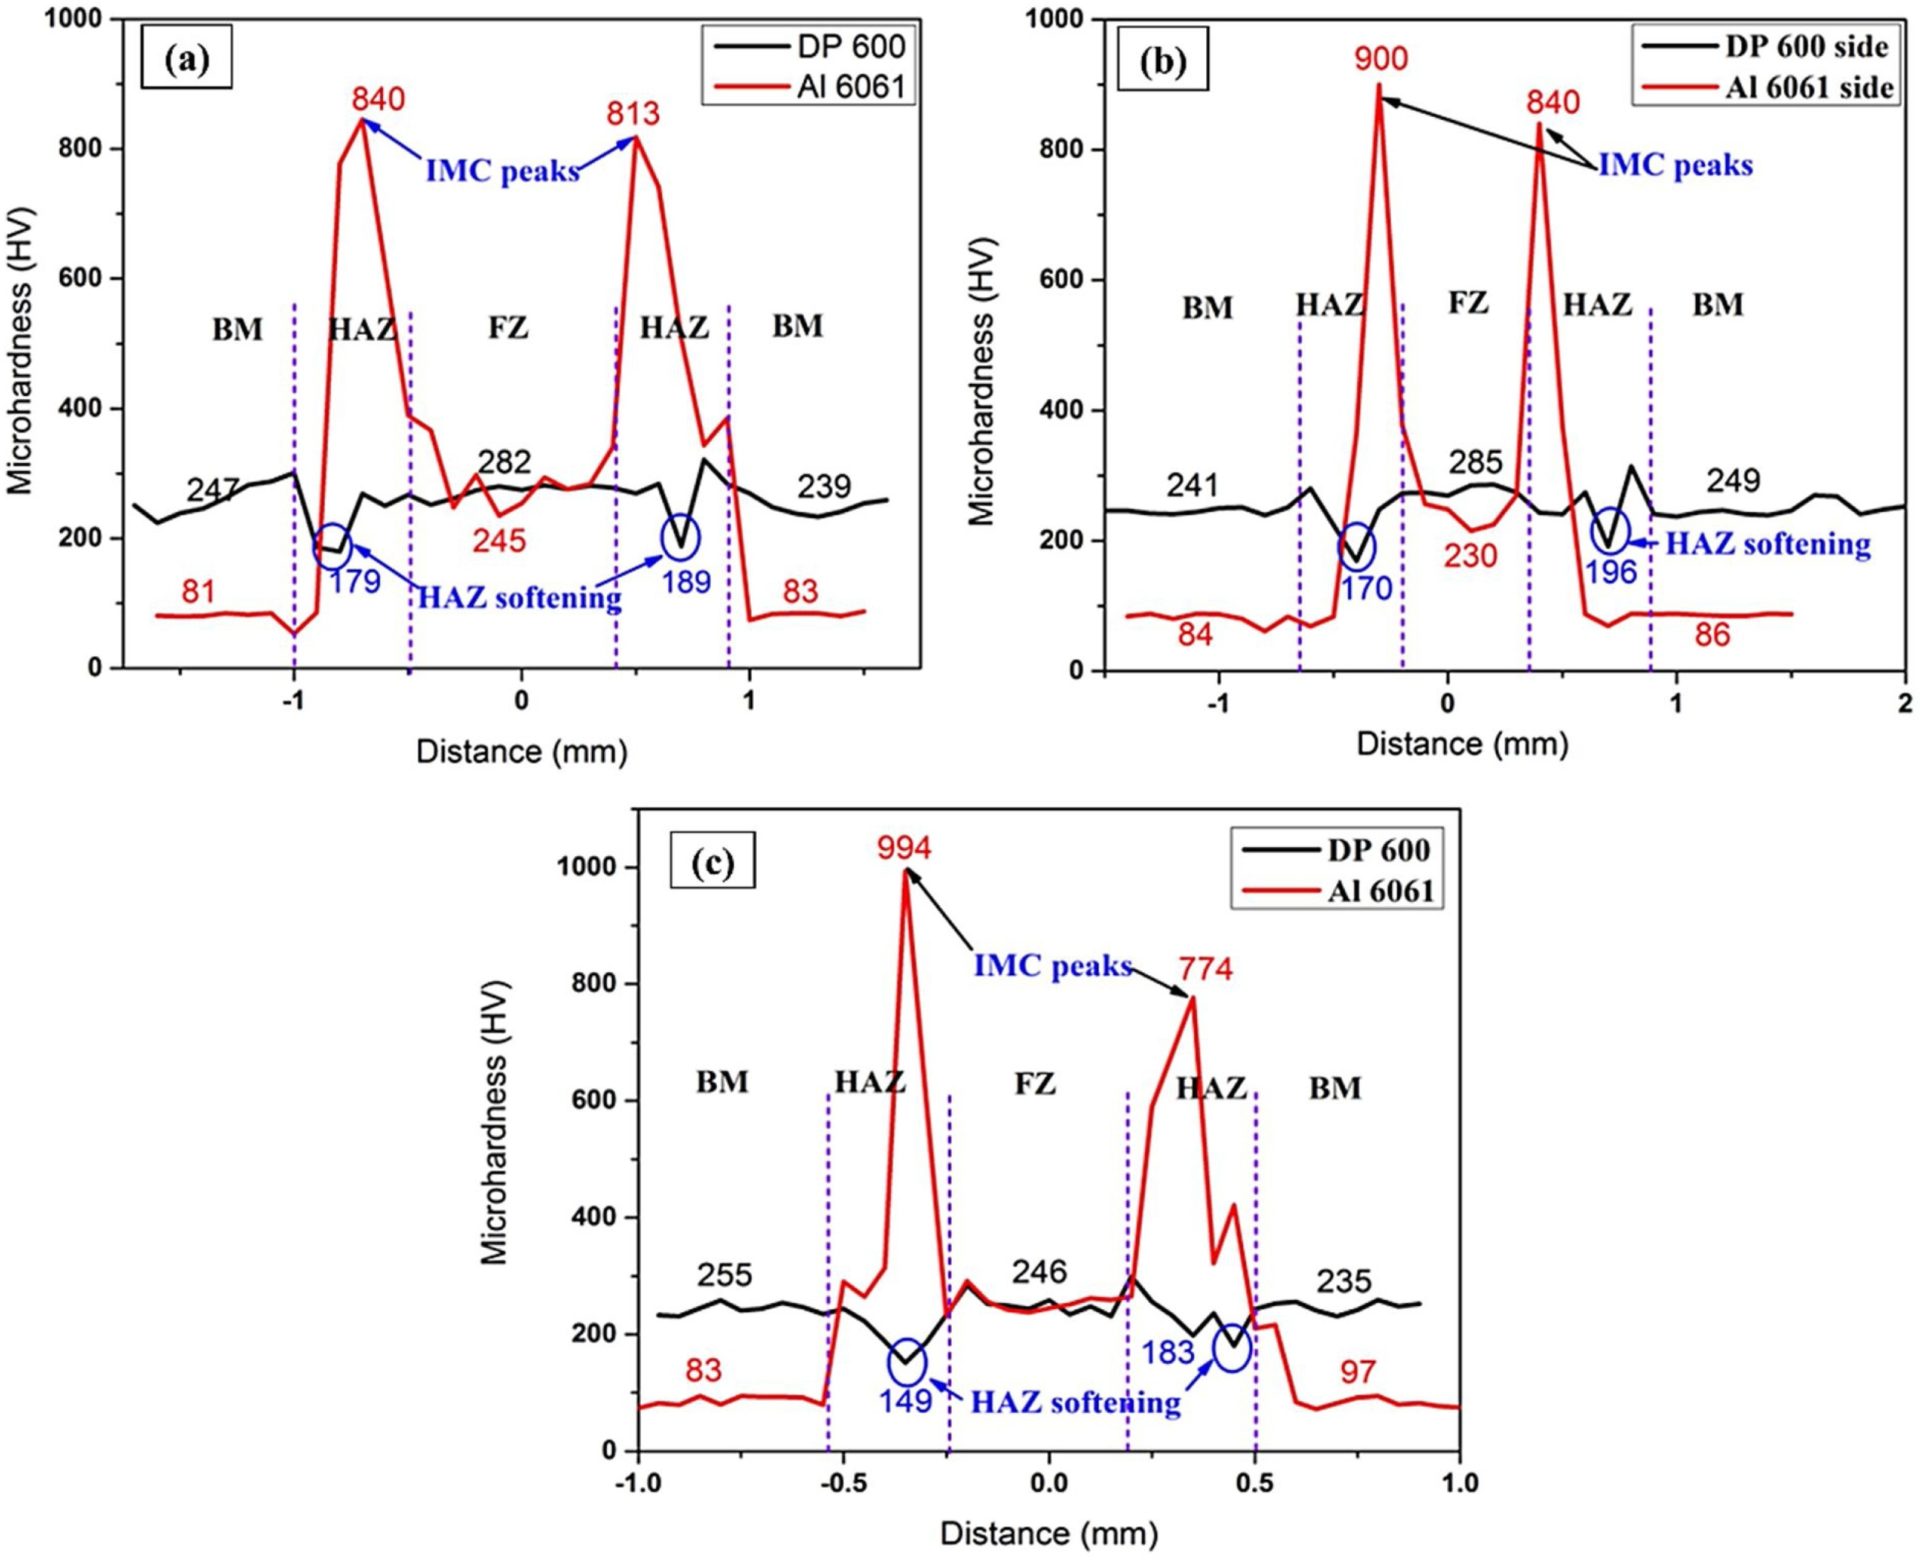
Figure 3: Microhardness Plot.I-1
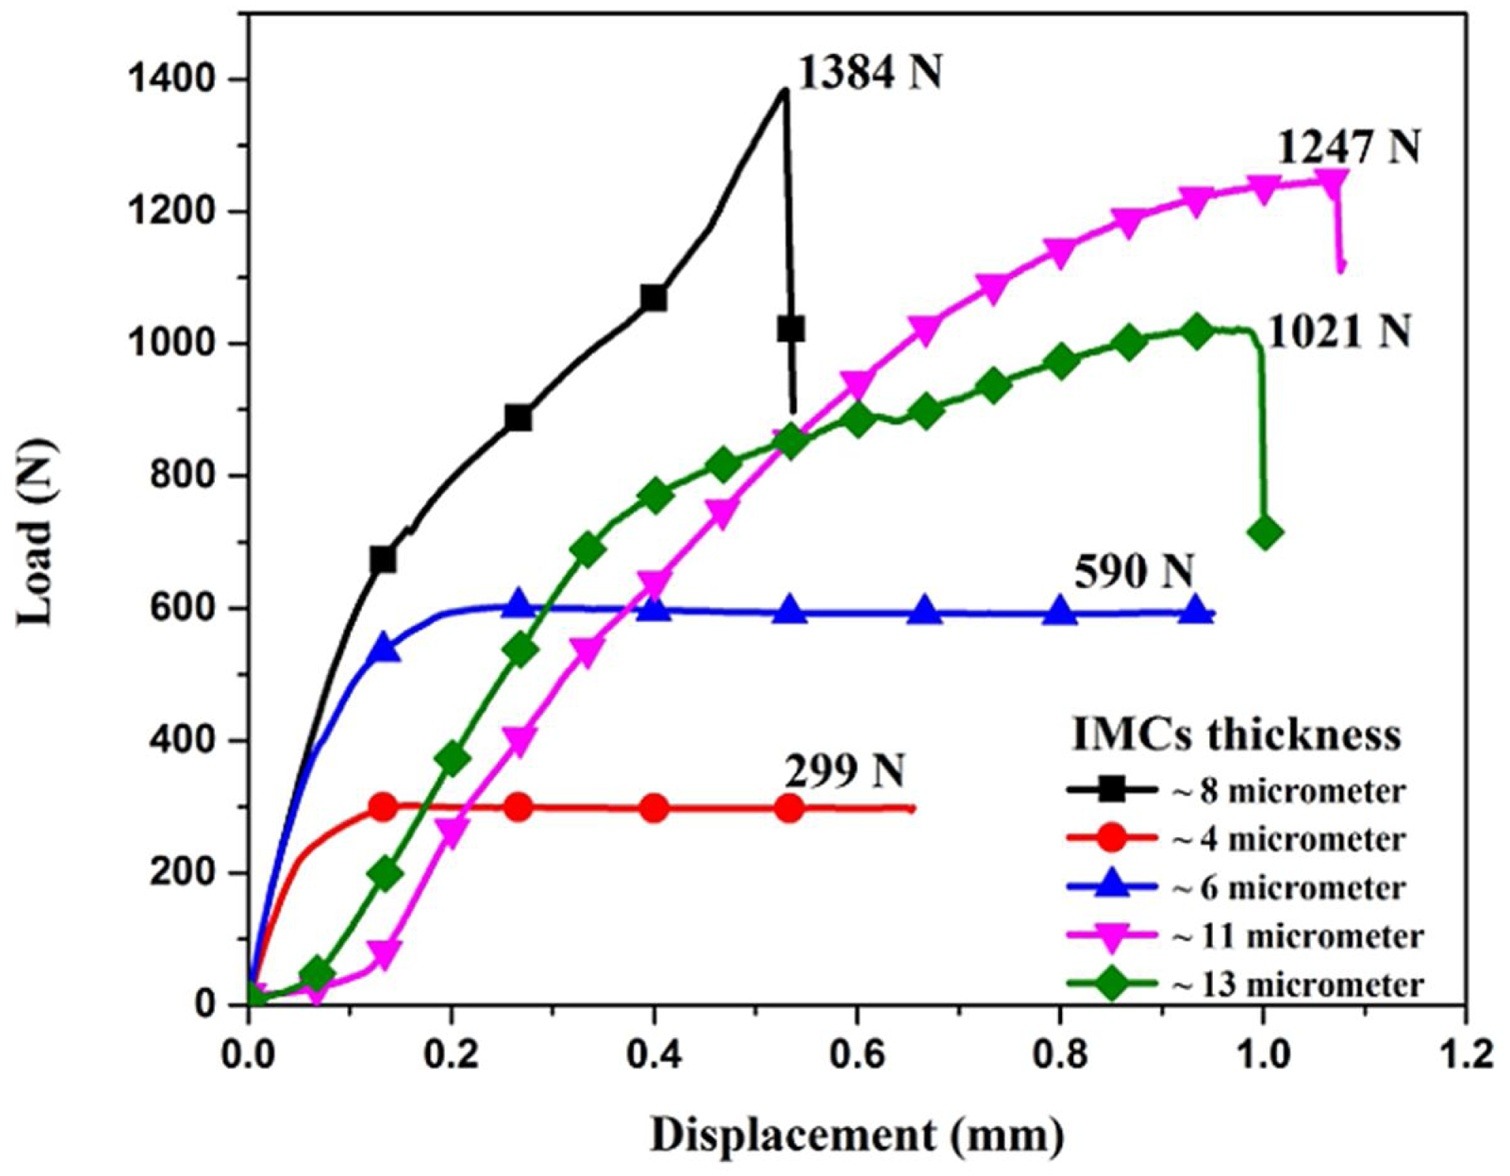
Figure 4: Load vs. Displacement.I-1
High Energy Density Welding
Fundamentals and Principles of High Energy Density Welding
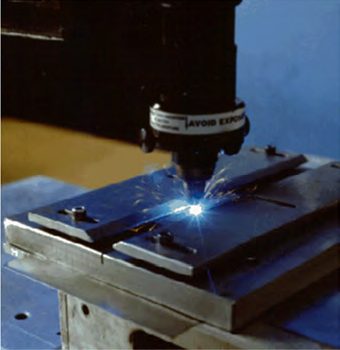
High energy density welding processes are those that focus the energy needed for welding to an extremely small size area. This allows for very low overall heat input to the workpiece, which results in minimal BM degradation, residual stress, and distortion. Welding speeds can be very fast. The two main processes known for extreme energy densities are laser (Figure 1) and Electron Beam Welding (EBW).

Figure 1: Laser welding.
As shown in Figure 2, energy densities of focused laser and electron beams can approach and exceed 104 kw/cm2. These energy densities are achieved through a combination of high power and beams that are focused to an extremely small diameter. Diameters as small as a human hair (0.05 mm) are possible. PAW[KH1] offers greater energy density than conventional arc welding processes and is sometimes referred to as the “poor man’s laser”.
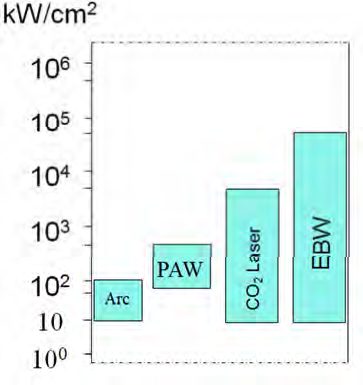
Figure 2: Power densities of various welding processes.
High energy density processes produce weld profiles of high depth-to-width ratio, as compared to other welding processes (Figure 3). As a result, much greater thicknesses can be welded in a single pass, especially with EBW. The figure also illustrates the fact that high energy density processes can produce a weld with minimal heating to the surrounding area as compared to the other processes. However, the high depth-to-width ratio weld profile is much less forgiving to imperfect joint fit-up than the profile produced by arc welding processes.
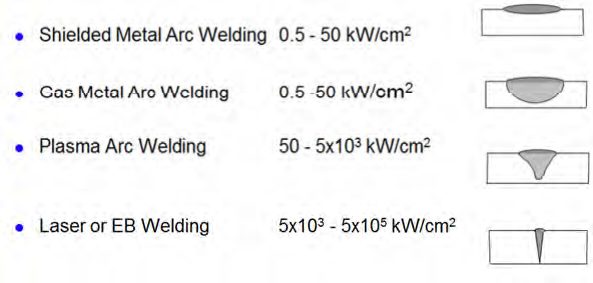
Figure 3: Comparison of typical weld profiles.
Laser and EBW processes are used in a wide variety of industry sectors. Very high weld speeds are possible and the welds are usually aesthetically pleasing. Laser welding is very adaptable to high-speed production so it is common in the automotive sector. The ability to precisely locate welds on smaller sensitive components with minimal heat input makes laser welding very attractive to the medical products industry.
When welding with high energy density processes, the laser or EB is focused along the joint line of the workpieces to be welded. The extreme power density of the beam not only melts the material, but causes evaporation. As the metal atoms evaporate, forces in the opposite direction create a significant localized vapor pressure. This pressure creates a hole, known as a keyhole, by depressing the free surface of the melted metal. The weld solidifies behind the keyhole as it progresses along the joint (Figure 4). This method of welding known as keyhole welding is the most common approach to laser and EB, and produces the characteristic welds of high depth-to-width ratio. There are some cases where the keyhole mode is not used. This mode is known as conductive mode welding. Conductive mode welds have a weld profile closer to that of an arc weld A-11, P-6
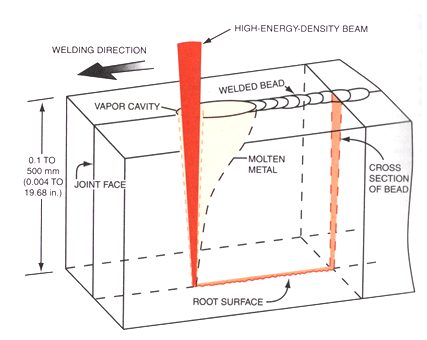
Figure 4: Keyhole mode welding.