True Fracture Strain
topofpage
- True Fracture Strain (TFS) Measurement Methods: Fracture Area (Af)
- True Fracture Strain (TFS) Measurement Methods: Fracture Types
- True Fracture Strain (TFS): Formability Classification and Rating System
- True Fracture Strain (TFS): Alternatives to TFS
- True Fracture Strain (TFS): Correlation to Hole Expansion Ratio
- True Fracture Strain (TFS): Standardization: VDA 238-110 for industrial applications
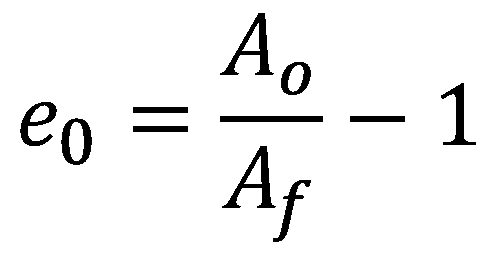
Fracture strain values derived from standard uniaxial tension tests can be used to evaluate automotive crashworthiness and forming behavior of aluminum alloys and Advanced High-Strength Steels (AHSS).Y-10, W-24, W-25, L-22, L-23, T-22, H-15, L-24 The true fracture strain (TFS) and similar concepts have emerged recently as intrinsic measures of local formability for AHSS. TFS is the true (logarithmic) strain associated with the “zero-gage-length” elongation at fracture (e0), where e0 is a conceptual engineering strain value based on an infinitesimal gage length in a tension test, where:
Equation 1
and Ao and Af are the cross-section area before testing and the fracture area after testing, respectively (constant volume assumed).D-13 It follows that TFS is defined as:
Equation 2
TFS is related to percent reduction of area at fracture (Z, %), where:
Equation 3
True Fracture Strain (TFS) Measurement Methods:
Fracture Area (Af)
Tensile test samples have a rectangular cross section before testing, indicated in the left image in Figure 1. The right image shows an idealized tension test specimen fracture surface, where five thickness measurement locations are indicated: two at the edges (ta, te); one at the center (tc), and two at the quarter-width positions (tb, td). Measured approximately at mid-thickness, wf is the fracture width. The dashed outline indicates the original specimen cross-section before testing (to·wo = Ao), and a 10-sided polygon (decagon) approximates the projected fracture area (Af), where the corners of the polygon correspond width-wise to the five thickness measurement locations.

Figure 1: Schematic representation of a tension test specimen before testing (left) and after fracture (right) viewed along the tensile axis.
From the dimensions portrayed in Figure 1, four possible methods to determine Af are indicated in Table 1—three lineal methods and one areal method.H-17 Method A uses a single thickness measurement at mid-width. Alternatively, for Method A the minimum thickness (tmin) may be used in cases where tc ≠ tmin. Method B uses a weighted three-thickness average A-24 —also known as the ASTM parabolic method.H-14, H-16 Method C uses a five-thickness average. For Method D, Af is the area of the polygon depicted in the left image of Figure 1.

Table 1. Fracture Area Measurement Methods.H-17
Dimensional measurements may be made quickly and conveniently with a calibrated digital microscope equipped with focal stacking capability and linked to image analysis software. Note that tf, wf and Af are respectively: the projected thickness, the projected width, and the projected area of the fracture surface. That is, to accommodate irregular and angled fracture surface features, measurements are made with respect to a virtual plane normal to the tensile axis. Alternatively, lineal measurements may be made with a conventional microscope equipped with a dial indicator or measuring stage. In this case, continual manual refocusing may be necessary to ensure true projected dimensional measurements.
Recently the effects of fracture area measurement method and tension test specimen type on fracture strain values were evaluated H-17. It was concluded that specimen type (i.e., width-to-thickness ratio) has a far greater impact on the consequent fracture strain value in contrast to that of measurement method. It was also advised that, when reporting fracture strain values derived from tension tests, the specimen type, the material thickness, and the fracture area measurement method be clearly indicated.
True Fracture Strain (TFS) Measurement Methods:
Fracture Types
Based solely on fracture appearance, various fracture types may be observed, with examples shown in Figure 2. H-17 The fracture type changes from Type 1 to Type 2 to Type 3 as the tension test specimen width-to-thickness ratio (wo/to) increases (left to right). Type 1 fracture is perpendicular to the tensile axis across the specimen width; Type 2 fracture is an irregular transition from Type 1 fracture to Type 3 fracture; and Type 3 fracture is aligned at an angle across the specimen width (~50-60° from the tensile axis).
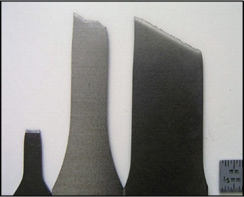
Figure 2: Various fracture types observed in uniaxial tension testing, from left to right: Type 1 fracture (wo/to = 4.5—ASTM Standard Sub-size specimen); Type 2 fracture (wo/to = 12.8—ASTM Standard specimen); and Type 3 fracture (wo/to = 16.8—JIS No. 5 Standard specimen); The original width-to-thickness ratio (wo/to) is measured within the gage section of the test specimen.H-17
A similar fracture orientation dependence on specimen width was reported for Dual Phase (DP) steels more than thirty years ago by researchers at the Colorado School of Mines.S-49 A 2018 publication W-23 confirmed this behavior for other AHSS types, and illustrated that the transitional behavior—in terms of critical width-to-thickness ratio—is material dependent.
Figure 3 shows example Type 1 and Type 3 fractures in cross-section at the mid-width position (corresponding to position tc in Figure 1). Type 1 fractures typically run at an angle through thickness (~50-55° from the tensile axis). While most Type 1 fractures resemble that shown in Figure 2 (left) and that shown in Figure 3a, occasional through-thickness chevron profiles and “cup and cone” W-23 type fractures have been observed for Type 1 fractures. Nevertheless, Type 1 fractures are roughly symmetric about a plane normal to the sheet surface at the mid-width position.
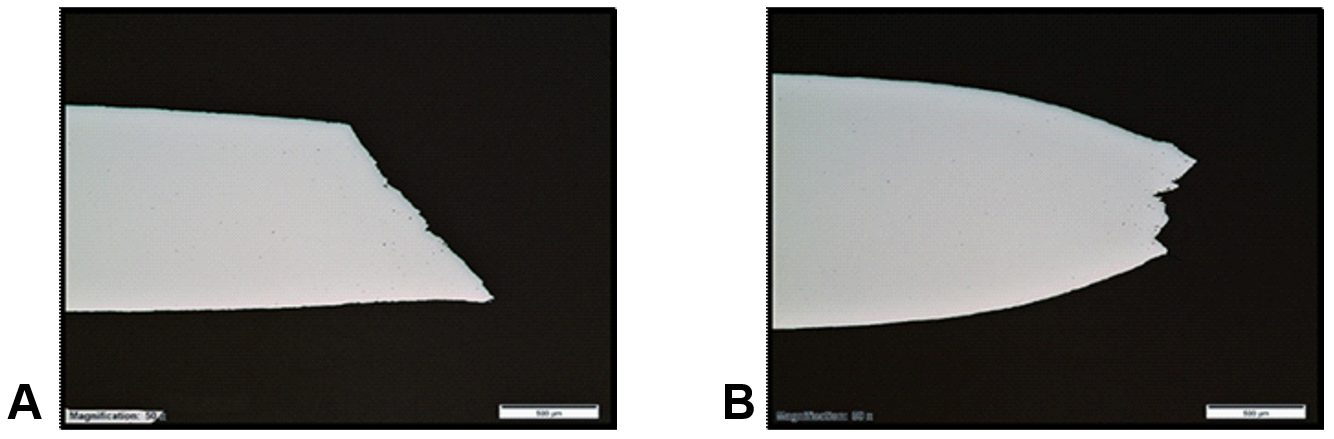
Figure 3. Examples of (A) Type 1 fracture, and (B) Type 3 fracture; Polished through-thickness cross-sections at the mid-width position; Tensile axis is horizontal.
Type 3 fractures invariably show localized necking in through-thickness cross-section as in Figure 3b. Therefore, Type 3 fractures are roughly symmetric about a plane parallel to the sheet surface at the mid-thickness position. Type 2 fractures have both Type 1 and Type 3 characteristics at different positions across the width and thus have no overall plane of symmetry. Various degrees of damage (void formation) are observed in through-thickness cross-sections of fractured specimens— for example, Figure 3. Citation H-18 contains a detailed compendium with more information on this topic.
ElsewhereW-23, L-21 it was explained that the idealized fracture thickness profile—as depicted in the right image in Figure 1—is applicable only to smaller width-to-thickness ratios (thicker, hot-rolled materials or narrower gage sections). For thinner, cold-rolled materials, or for wider gage sections, there is often no clear fracture thickness minimum at the mid-width position. In fact, in some cases a fracture thickness maximum at mid-width has been observed. Furthermore, occasional mid-thickness delamination renders the volume-constancy assumption in question, with associated implications in Equation 1
True Fracture Strain (TFS):
Formability Classification and Rating System
In 2016 the foundation for a formability classification and rating system was introduced for AHSSH-14, where formability performance expectations are distinguished by the relationships between true fracture strain (TFS) and true uniform strain in a tension test. Such performance mapping concepts continue to be explored and modified by steelmakersH-16, W-23, L-21, D-12, W-22, V-5, R-6, S-48 by automakersH-18, H-19 and by international industry consortiums.G-20 Traditionally AHSS performance has been represented by the product of ultimate tensile strength and total elongation (UTS x TE) and relative position on the so-called “banana diagram” or Global Formability Diagram. While this conventional methodology discriminates behavioral extremes, much is lost regarding the nuances of local formability.
Intrinsic Formability Parameters
Widely considered an intrinsic measure of global formability, the true uniform strain (εu) is the logarithmic strain associated with uniform elongation (UE, %) in a uniaxial tension test, where:
Equation 4
Example TFS and εu values are shown for a series of 980-class AHSS (980 MPa minimum tensile strength) in Figure 4H-14. In this analysis, TFS values ranged from less than 0.5 [DP 980 (LSi)] to more than 1.0 (CP 980), and εu values ranged from 0.05 (CP 980) to 0.15 (GEN3 980). The Third Generation AHSS materials (GEN3-type) have the largest εu values, and the Multi-Phase/Complex-Phase steels (MP/CP-type) have the largest TFS values. As a group the Dual Phase steels (DP-type) have intermediate εu values and a wide range of TFS values. As illustrated in Figure 4, TFS is far greater than εu. A similar disparity between fracture strain and uniform strain was shown in Citation D-14, and no consistent relationship between the two parameters was determined.
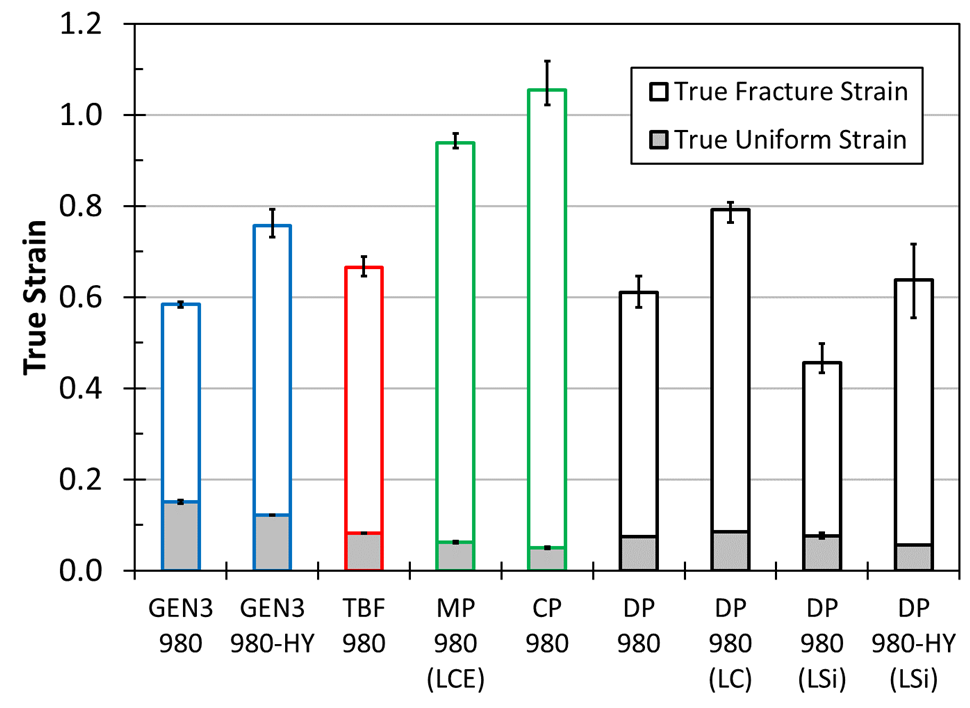
Figure 4: True uniform strain (εu) and true fracture strain (TFS) values for a series of 980-class AHSS; Error bars show the range among three test specimens for each material.H-14
The local/global strain ratio (L/GSR) and the formability index are key parameters to guide application-specific material selection and to help set targets for future AHSS grade developments.H-14, H-16 The L/GSR reflects the relative preponderance of local formability to global formability and is defined as:
Equation 5
The L/GSR is useful in understanding relative intrinsic formability “character”. Materials with higher relative TFS values are naturally expected to perform better under flanging, edge stretching and tight-radius bending conditions [e.g., MP 980 (LCE) and CP 980 in Figure 4], while materials with higher relative uniform strain values (i.e., higher terminal n values) are better suited for stretch forming and are able to distribute strain more uniformly (e.g., GEN3 980 and GEN3 980-HY in Figure 4).
Furthermore, the formability index (F.I. in the formula) is defined as:
Equation 6
This index represents an intermediate strain value between εu and TFS and provides a convenient measure of the overall formability expectation, where both local formability and global formability are considered. As an example, Figure 5 shows an exponential relationship between F.I., and the limiting bend ratio (r/t) determined from 90° V-bend testing for the same series of 980-class AHSS represented in Figure 4.H-14 It was reasoned that in the early stages of deformation, global formability (εu) dictates the strain distribution around the punch nose, while fracture resistance is governed by local formability (TFS) in the latter stages of deformation.
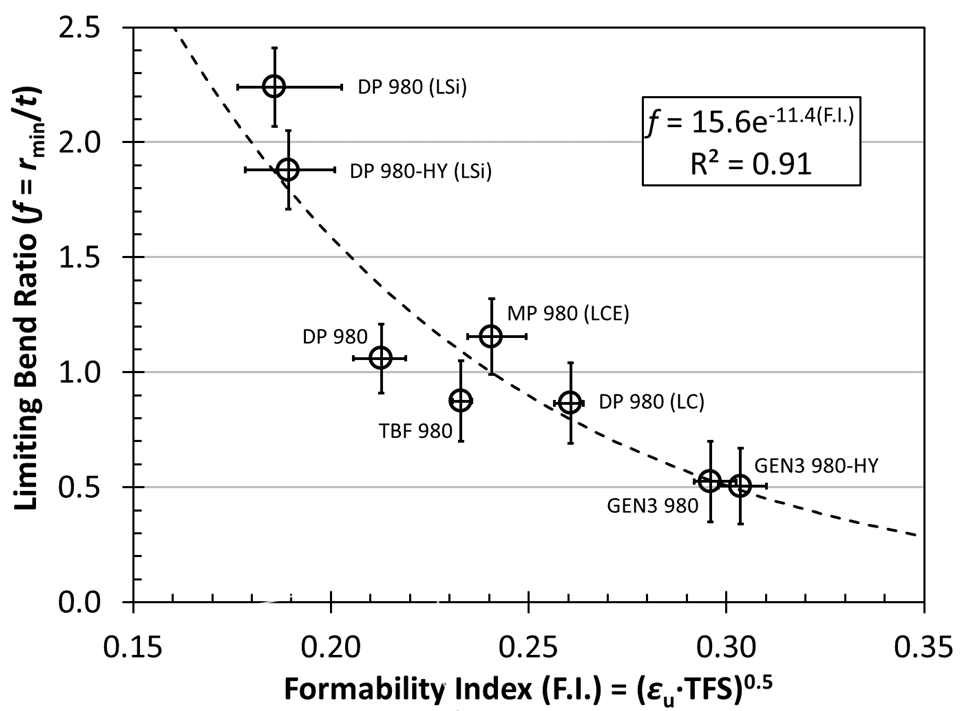
Figure 5. Correlation between the limiting bend ratio (f) and the formability index (F.I.) for a series of 980-class AHSS. A higher formability index corresponds to a lower (better) limiting bend ratio in 90° V-bend testing.H-14
Local/Global Formability Map
Figure 6 illustrates the essential framework of the local/global formability map—known eponymously as the Hance diagram.H-14, D-12, G-20 Here, the dashed lines represent the boundaries between global character (L/GSR < 5), balanced character (5 < L/GSR < 10), and local character (L/GSR > 10). The continuous curves represent arbitrary iso-F.I. contours corresponding to the values indicated (in parentheses). The qualitative assessments (Poor through Excellent) indicated for each formability level are also arbitrary; however, these performance level monikers were chosen to reflect real-world experience. Portrayed in this way (in contrast to Figure 4, for example), the relationships between true fracture strain and true uniform strain are more discernable, and both the formability character and the formability level become apparent.
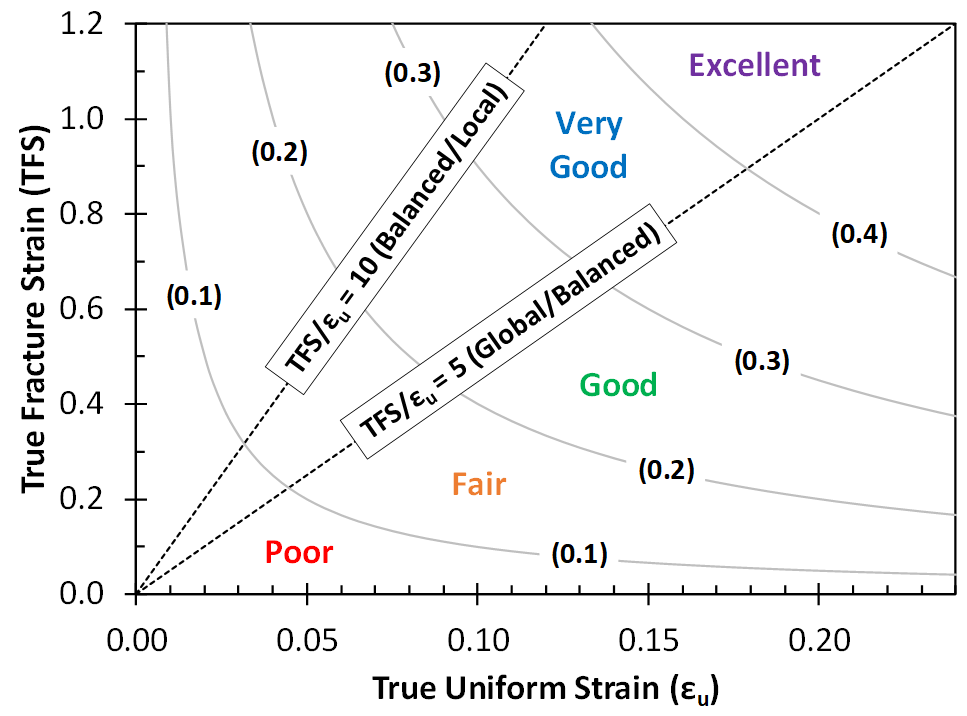
Figure 6: Essential framework of the local/global formability map concept.H-16
Case Study Using the Local/Global Formability MapH-15
The basic utility of the local/global formability map concept was demonstrated for an automotive seating system development program.H-15 In this case study, stamping trials were conducted with two 980-class AHSS (980 MPa minimum UTS designation):
- 1.6mm 980DP(LSi): A classic Dual Phase (DP) ferrite/martensite steel with low silicon content (LSi), and
- 1.6mm 980MP(LCE)—a Multi-Phase (MP) steel with high yield strength and low carbon equivalent (LCE).
Basic formability parameters are summarized in Table 2 for the trial materials. Based solely on elongation values (UE, TE), one might have concluded that the formability of 980DP(LSi) would exceed that of 980MP(LCE).

Table 2. Formability Parameters for Two 980-Class AHSS.
However, the stamping trial results were counterintuitive and drastically different among the two trial materials. The 980DP(LSi) material exhibited severe edge-cracking in multiple locations, while the 980MP(LCE) material ran without issue. Both materials were free of necking-type failures as predicted by computer simulations (sufficient global formability). An example part overview is shown in Figure 7. Typical 980DP(LSi) edge cracks are shown in Figure 8 for a pierced/extruded hole (Location 1) and for a blanked/stretched perimetric edge (Location 2). Clearly, relative sheared-edge ductility may not simply be deduced from conventional tensile elongation values.
![Figure 7: Overview of a stamped automotive seating component [length ~ 480 mm (19 in.)]. H-15](https://ahssinsights.org/wp-content/uploads/2020/10/2.3.5a-Figure7.svg)
Figure 7: Overview of a stamped automotive seating component [length ~ 480 mm (19 in.)].H-15
![Figure 8: Close-up views of Location 1 (left) and Location 2 (right) identified in Figure 7 [material: 980DP(LSi)]; Location 1 is a pierced hole that was extruded during forming, and Location 2 is a blanked perimetric edge that was stretched during forming (underside with respect to Figure 7). H-15](https://ahssinsights.org/wp-content/uploads/2020/10/2.3.5-Fig8.jpg)
Figure 8: Close-up views of Location 1 (left) and Location 2 (right) identified in Figure 7 [material: 980DP(LSi)]; Location 1 is a pierced hole that was extruded during forming, and Location 2 is a blanked perimetric edge that was stretched during forming (underside with respect to Figure 7).H-15
The local/global formability map coordinates of the 980DP(LSi) and 980MP(LCE) trial materials are shown in Figure 9. With reference to the framework described in Figure 6, 980DP(LSi) exhibits global/balanced character with an overall borderline rating of Fair/Good (F.I. = 0.20); while 980MP(LCE) has decidedly local character with an overall rating of Good (F.I. = 0.26). Furthermore, the TFS value of 980MP(LCE) is more than twice that of 980DP(LSi).
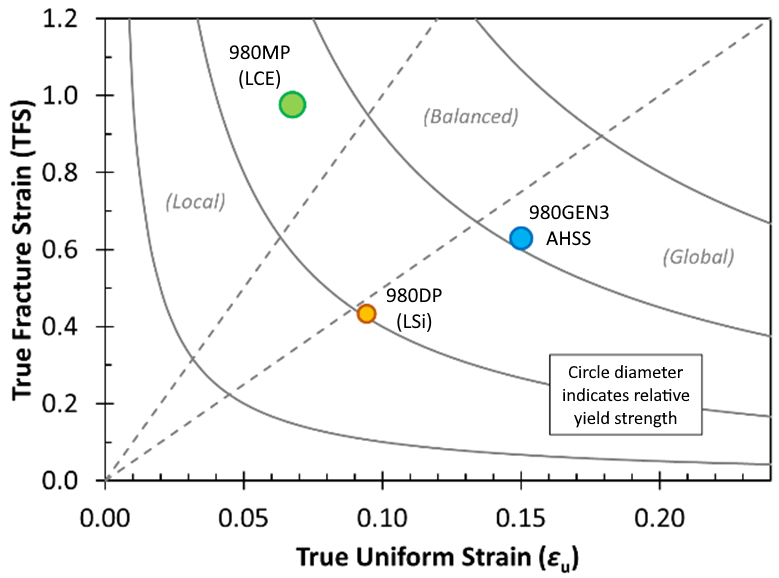
Figure 9: Local/global formability map featuring three 980-class AHSS—980DP(LSi), a classic DP ferrite/martensite steel with low silicon content (LSi); 980MP(LCE), an MP steel with high yield strength and low carbon equivalent (LCE); and 980GEN3, a third generation AHSS. Image based on Citations H-15 and H-17.
As an independent confirmation of the local formability advantage of 980MP(LCE), the hole expansion ratio (HER, λ) is more than four times that of 980DP(LSi) (Table 2). A strong correlation between TFS and λ has been confirmed by several authors L-22 L-23 T-22 H-15 As the component featured in this case study is dominated by extremely challenging edge-stretching conditions, 980MP(LCE) is the clear wiser material selection. However, in applications with more demanding global formability requirements, other issues such as intolerable strain localization could arise, and a third generation AHSS might be the best choice. As an example, when contrasting 980GEN3 AHSS (third generation AHSS) to 980DP(LSi) in Figure 9, the intrinsic global and local formability parameters (εu and TFS), as well as the F.I, are approximately 50% greater.
True Fracture Strain (TFS): Alternatives to TFS
While the local/global formability map methodology was developed in the context of true fracture strain (TFS), there are other ways to represent intrinsic local formability (fracture resistance) with data derived from standard uniaxial tension tests. In the original conception (Hance diagram), true uniform strain (εu) and TFS are two points along a logarithmic strain continuum from zero to fracture, and the relationships between these values elegantly describe the formability character (local/global strain ratio) and the overall formability level (formability index). The “best” local formability parameter may be a matter of practicality or applicability, or simply a matter of preference. Each method has its strengths and weaknesses, and such fracture strain concepts continue to evolve.
True Thinning Strain at Fracture
The true fracture strain (TFS) value is an area-based measurement of fracture strain and thus reflects the tension test specimen width change as well as the thickness change, for better or for worse. Citation H-18 suggests that the true thinning strain at fracture (ε3f) is a more appropriate measure of local formability, where:
Equation 7
and to and tf are the original thickness (before testing) and final thickness (after fracture). By convention ε3f is a positive value and represents the absolute value of the true thickness strain at fracture (a negative value). Furthermore, the post-uniform portion of the fracture strain may be isolated by subtracting the uniform component of thinning strain, where:
Equation 8
and εu and r are the true axial uniform strain and the plastic strain ratio (normal anisotropy) measured during the tension test, respectively. Post-uniform fracture strain components might be more relevant to materials with high uniform elongation values such as TWIP steels H-18. In a similar way, the post-uniform portion of the area-based TFS value may be expressed as:
Equation 9
Another study W-23 concluded that: (1) area-based fracture strain measurements such as TFS result in less experimental scatter when compared to thickness-based fracture strain measurements such as ε3f, and (2) area-based measurements show less dependence upon the method by which fracture strains are determined. It appears that a single thickness measurement may misrepresent the fracture strain and that a multiple-thickness (average thickness) or area measurement approach may be more stable.
Critical Fracture Strain
Perhaps a lesser-known and under-exploited representation of fracture strain is the so-called critical fracture strain value (CFS)—introduced in 1999 for aluminum alloys in Citation Y-10 and re-visited in 2007 in the context of High-Strength Steel in Citation W-24. In concept CFS is the estimated true thinning strain at fracture, where:
Equation 10
In determining CFS, only the engineering stress-strain data from a uniaxial tension test are needed—that is, no post-fracture area or thickness measurements are required: eu is the engineering uniform strain value (% uniform elongation/100); sf is the engineering fracture stress; and su is the ultimate tensile strength or UTS. Figure 10 shows an example engineering stress-strain curve for a 980-class AHSS, where the parameters relevant to CFS are marked. In this example, CFS = -ln[(1-0.07/2)·(787/1015)] = 0.29.
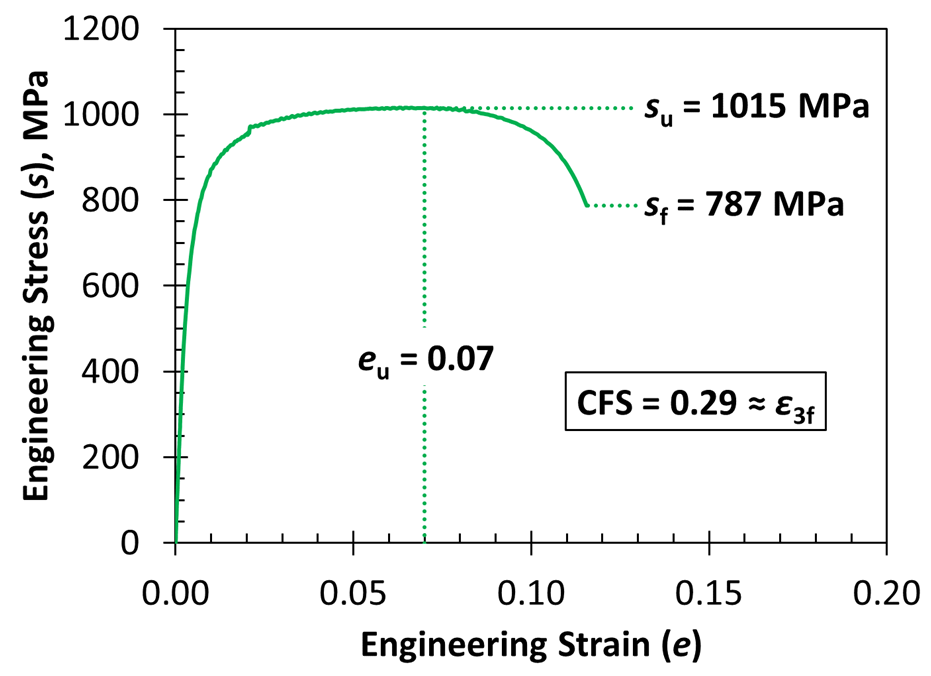
Figure 10: Example engineering stress-strain curve for a 980-class AHSS. Here, eu is the engineering uniform strain, su is the ultimate tensile strength (UTS), sf is the engineering fracture stress, CFS is the critical fracture strain, and ε3f is the true thinning strain at fracture.
True Fracture Strain (TFS):
Correlation to Hole Expansion Ratio
In a recent studyL-5, tensile properties (80 mm gage length) and hole expansion ratio were measure for AHSS with minimum tensile strength designations ranging from 600 to 1200 MPa, and thickness between 1 and 2 mm. No particular correlation was found between the hole expansion ratio and conventional tensile properties such as uniform elongation, total elongation, n-value, and so on.
The most promising relationship was found between the hole expansion ratio (converted to logarithmic strain) and the true thinning strain at fracture in tension. This relationship is illustrated in Figure 11 for total thinning strain (ε3f, Equation 7) on the left, and for post-uniform thinning strain (ε*3f, Equation 8) on the right. In both cases, better correlation is shown for transverse tension tests rather than for longitudinal tension tests (linear fit through the origin).
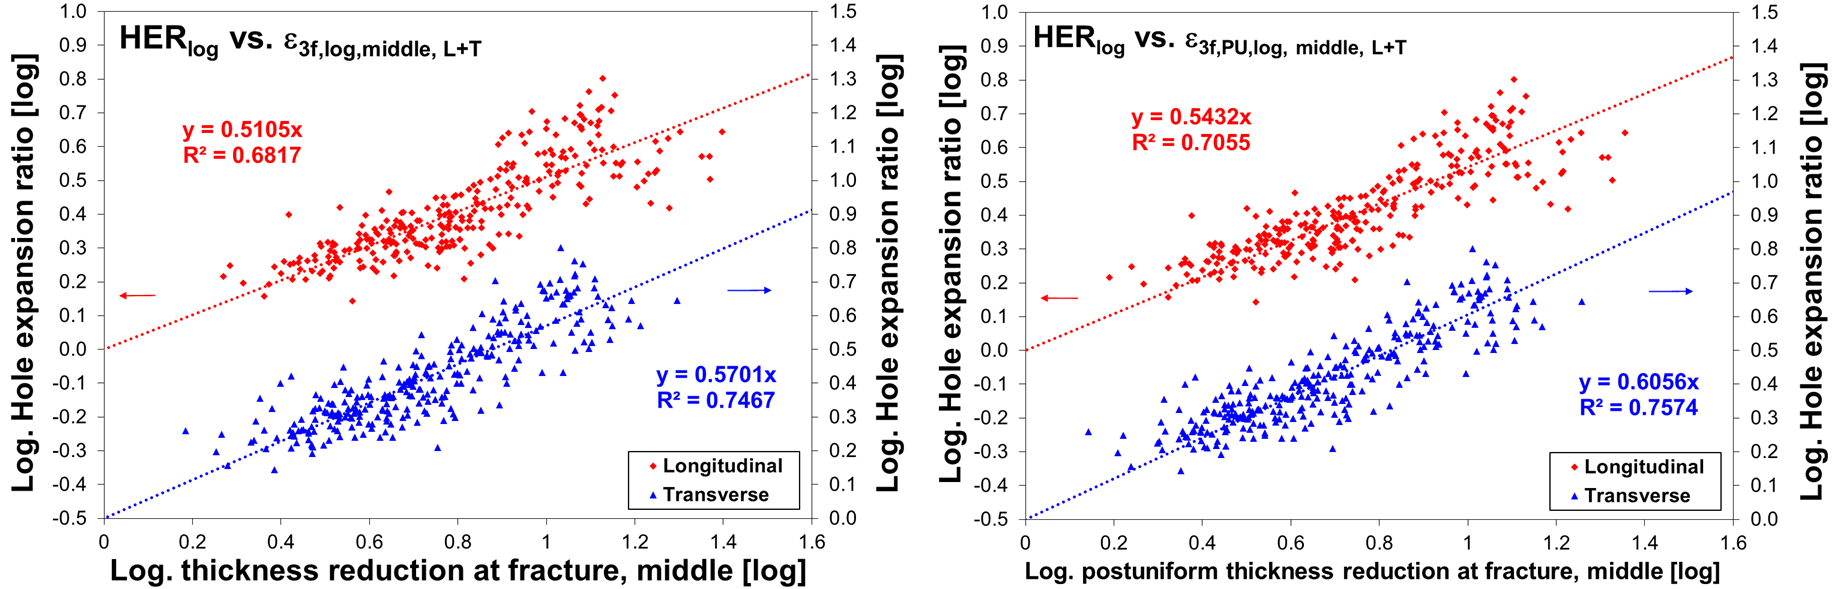
Figure 11: Hole expansion ratio (logarithmic strain) as a function of true thinning strain at fracture. Left graph: total thinning strain (ε3f); Right graph: post-uniform thinning strain (ε*3f).L-5
While the above correlations are good, the inherent scatter associated with the hole expansion test, fracture strain measurements, and other local formability parameters may limit applicability in a production environment. Furthermore, various factors affect hole expansion in production environments, including hole preparation technique, edge condition, and cutting clearance.
Standardization: VDA 238-110 for industrial applications of TTS (True Thickness Strain) and TFS (True Fracture Strain)
2023 saw the release of the first Industry standard method of using fracture surfaces from tested tensile bars to characterize local ductility. VDA 238-110V-25 covers industrial application of TTS (True Thickness Strain at fracture at minimum thickness) and TFS (True Fracture Strain from area reduction) to quantify local ductility based on the postmortem microscope analysis of the fracture surface of tensile test samples.
Shortly thereafter was the publicationL-72 of a detailed study evaluating the gauge repeatability and reproducibility (GRR) based on round-robin test results from 18 labs, spanning close to1500 tests of three AHSS grades: CR440Y780T-DH, CR780T980T-CP, and HR660Y760T-CP. Conclusions from this study include:
- For the three grades evaluated, the greatest total variance of hole expansion results associated with punched holes
- Measurement variance of TTS testing is comparable to that of elongation at breakage measurements, and substantially lower than seen in hole expansion testing.
- For the two complex phase steels, TTS and TFS results are very similar, whereas in the high ductility dual phase (DH) grade, the TFS value is slightly higher than TTS. The larger TFS value may be related to the higher global ductility of the DH grade compared to the CP steels. TFS includes a contribution of both thickness and width reduction, leading to a comparatively high value, while TTS represents the thickness reduction. As such, TTS may be a more conservative, but more representative value of local formability material capability.H-18 In addition, characterizing TTS may be experimentally simpler than TFS.
The VDA 238-110 testV-25 is relatively recent, and is not as mature as tensile testing which has had a continually revised standard procedure for over 100 years [ASTM E8 was first issued in 1924]. Aspects of VDA 238-110 that may need to be addressed in future revisions include these observations from Citation L-75:
- Tensile sample failure location – the minimum thickness at fracture may not be located at the sample center.
- Cracks may form at the sample shoulders leading to premature failure – the validity of these results should be questioned.
- Edge cracks starting normal to the tensile direction, typically without significant necking and an asymmetric fracture shape pattern, may not be a good measure of bulk local ductility.
- The real fracture shape border may be best seen in three-dimensions rather than a 2-D representation. Otherwise, it is possible to produce false values for reduction of area and/or minimum thickness values.
- There is ambiguity in the definition of thickness close to sample edges. Thickness is defined as the cross section of a vertical line with the sample fracture contourplot. If this line crosses “empty air” at the left/right outer edges of the broken tensile sample, then invalid readings may occur due to the definition.
- When measuring broken surfaces, there is still some subjectivity in the measurement, especially on surfaces with high fracture angle.
 |
Thanks are given to Brandon Hance, Ph.D., who contributed the majority of this article. |
Back to the Top
- True Fracture Strain (TFS) Measurement Methods: Fracture Area (Af)
- True Fracture Strain (TFS) Measurement Methods: Fracture Types
- True Fracture Strain (TFS): Formability Classification and Rating System
- True Fracture Strain (TFS): Alternatives to TFS
- True Fracture Strain (TFS): Correlation to Hole Expansion Ratio
- True Fracture Strain (TFS): Standardization: VDA 238-110 for industrial applications