Press Requirements
AHSS products have significantly different forming characteristics and these challenge conventional mechanical and hydraulic presses. The dramatically higher strength of these new steels result in higher forming loads and increased springback. Higher contact pressures cause higher temperatures at the die-steel interface, requiring high performance lubricants and tool steel inserts with advanced coatings. Although the decrease in ductility is not as severe as seen with HSLA grades of a similar strength level, there is a reduction in formability. Further complicating matters is that in addition to traditional stamping failures due to necking when the part strains exceed the forming limit curve, AHSS grades have additional failure modes such as reduced bendability and cut edge ductility (collectively called local formability failure modes) which are not predicted using current analytical techniques.
These challenges lead to issues with the precision of part formation and stamping line productivity. The stamping industry is developing more advanced die designs as well as advanced manufacturing techniques to help reduce fractures and scrap associated with AHSS stamped on traditional presses. Using a servo-driven press is one approach to address the challenges of forming and cutting AHSS grades. Recent growth in the use of servo presses in the automotive manufacturing industry parallels the increased use of AHSS in the body structure of new automobiles.
Characteristics of Servo Presses
A servo press uses a servomotor as the drive source. Servo press systems are more flexible than flywheel-driven presses and are both faster and more accurate than hydraulic presses. A servomotor allows for control of the position, direction, and speed of the output shaft in contrast to a constant cycle speed of flywheel driven presses, for example. New forming techniques take advantage of this flexibility, achieving more complex part geometries while maintaining dimensional precision.
Mechanical presses are powered by an electric motor that drives a large flywheel. The flywheel stores kinetic energy, which is released through various drive types like cranks, knuckle joints, and linkages. Powering hydraulic presses are electric motors which drive hydraulic cylinders to move the ram up or down.
Servo-driven presses can be either mechanical or hydraulic. In servo-mechanical presses, the high-powered servo motor allows for direct driving of the mechanical press without using a flywheel and clutch. Up to the rated speed, maximum torque is available. Beyond this rated speed, the available torque decreases until reaching the maximum speed. If forming speeds remain below this rated speed, servo presses may have an advantage over flywheel driven presses since full tonnage is available even at lower strokes per minute. This is a useful feature if heat build-up limits how fast the part is capable of running.
Traditional hydraulic presses use variable volume pumps powered by constant velocity electric motors. Servo-hydraulic presses either combine conventional electric motors with servo (proportional) valves or pair servo motors with simple pumps and valves. Typically, servo-hydraulic presses reach higher slide speeds than conventional hydraulic presses, but usually are not faster than servo-mechanical presses over a complete cycle. Due to this advantage, most automotive stampers use servo-mechanical presses.
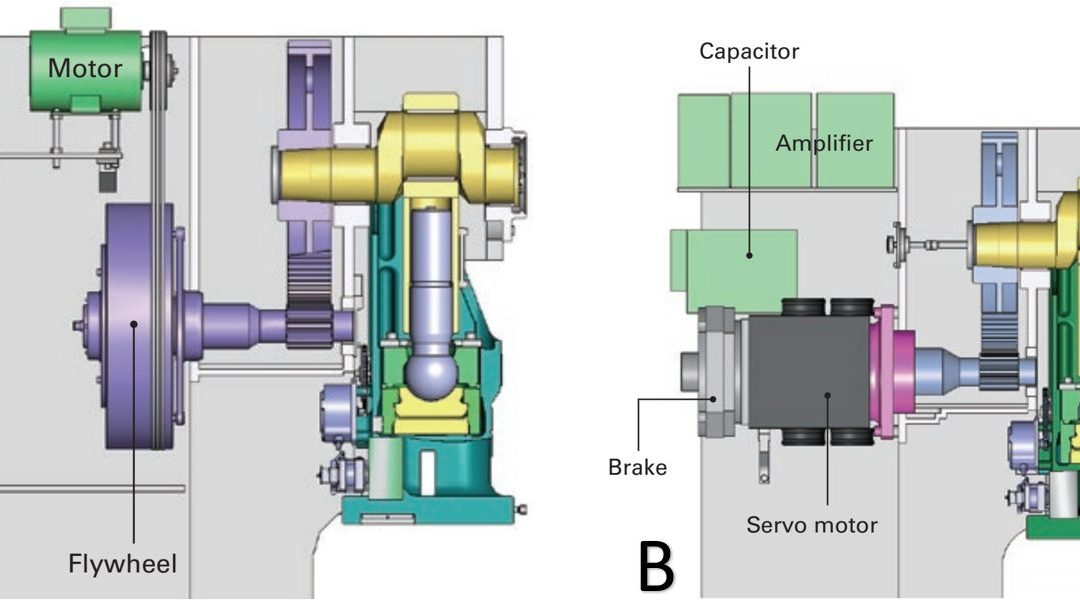
For both servo-mechanical and servo-hydraulic presses, the other press components remain the same as conventional presses. Figure 1 compares pertinent elements of a flywheel-driven mechanical press with one driven by a servo motor.
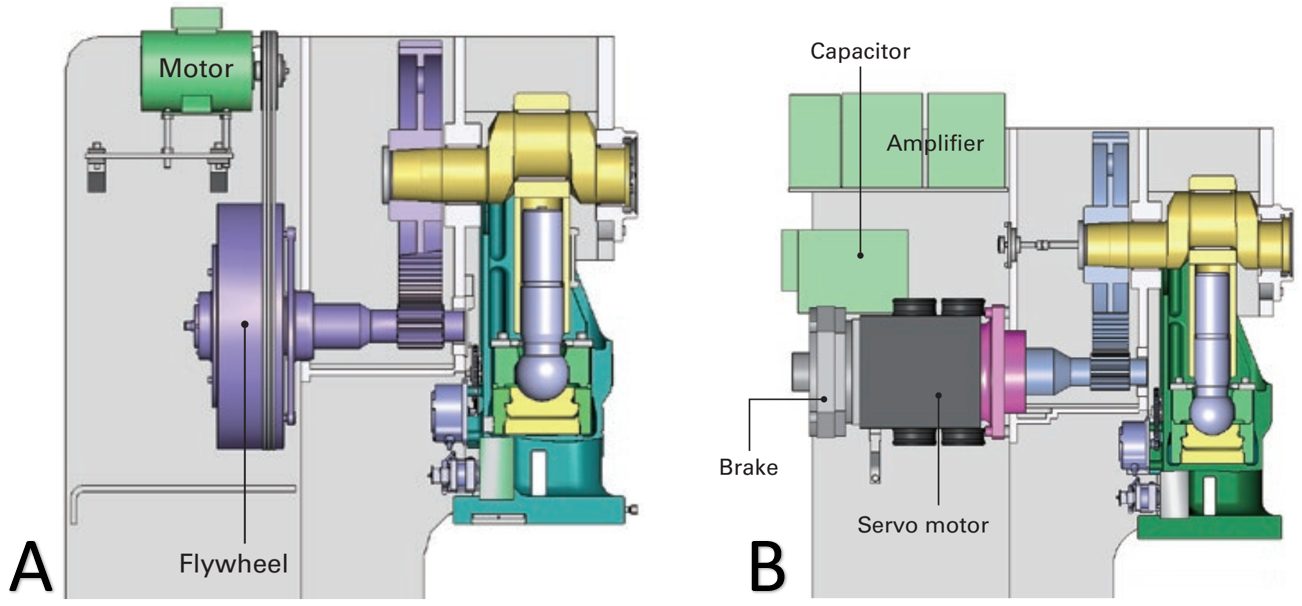
Figure 1: Drive components in a mechanical press. A) Flywheel driven; B) Servo motor driven.A-9
Advantages of Servo Presses
Servo press technology has many advantages compared to flywheel-driven mechanical presses when working with AHSS materials. Press manufacturers and users claim advantages in stroke, speed, energy usage, quality, tool life and uptime; these of course are dependent upon part shape and forming complexity. Figure 2 shows the difference between the available motions of flywheel-driven mechanical presses verses servo driven mechanical presses. The slide motion of the servo press can be programmed for more parts per minute, decreased drawing speed to reduce quality errors, or dwelling or re-striking at bottom dead center to reduce springback.
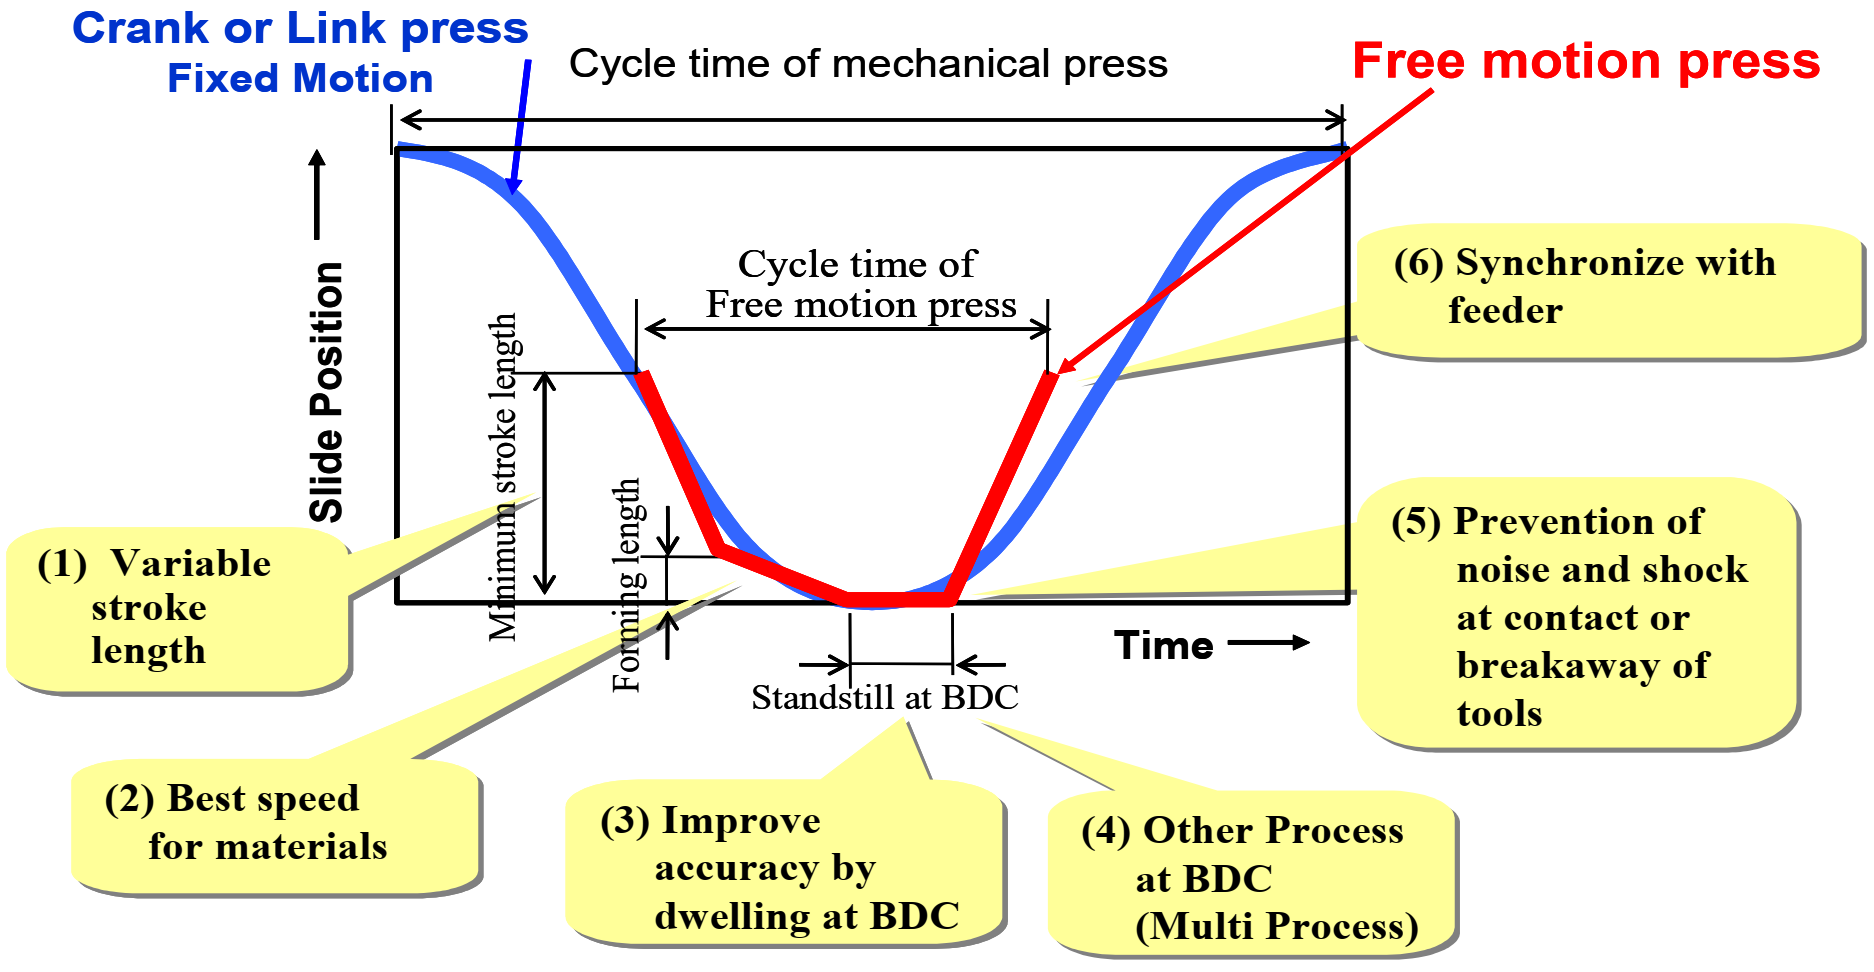
Figure 2: Comparison of Press Signatures in Fixed Motion Mechanical Presses and Free-Motion Servo-Driven Presses.M-3
Some examples highlighting the flexibility of servo press motions include:
- Adjustable Stroke Length: The servo press has an adjustable stroke; the programmable slide motion allows for customizing the stroke profile to suit the characteristics of the part. By changing the programmed profile, the same press can produce deep draw stampings, shallow part stampings, or even blanking. This flexibility allows metal formers to use servo presses for multiple job types.
- Adjustable Stroke Direction – Pendulum Motion: Unlike in flywheel-driven presses, servo-driven presses do not need to return to Top Dead Center. A servomotor can change the rotation direction at predefined angles (like restricting the rotation per stroke between 90 degrees and 270 degrees) to increase production rates. This is known as pendulum mode.
- Adjustable Stroke Direction – Attach-Detach (forward/reverse) Motion: The slide moves downward at a pre-set speed, reaches a predetermined depth, and rises slightly. The slide then moves downward again, and the system repeats this motion. When the slide motion changes from downward to upward, the forming forces become negligible and the elastic deformation of dies and machine recover. This has the potential to mitigate springback that is associated with the forming of higher strength materials in traditional mechanical presses. By holding pressure at the bottom of the stroke, releasing the pressure, and then reapplying it, multiple stamping hits can be made in just one cycle, setting the form of the product, and eliminating the need for secondary operations.
- Improved Cycle Time: Servo-driven presses achieve improved cycle times compared with standard mechanical presses, improving stamping plant productivity. This comes from the ability of servo presses to run faster on the approach and retract portions of the cycle when no work is performed on the sheet metal. Figure 3 shows cycle rates for comparable stroke heights for both a servo-mechanical press and a traditional flywheel-driven mechanical press in which the stroke-time signature takes the form of a sine wave. This example shows a 60% improvement in parts per minute. Quality likely improved also, for reasons discussed below.
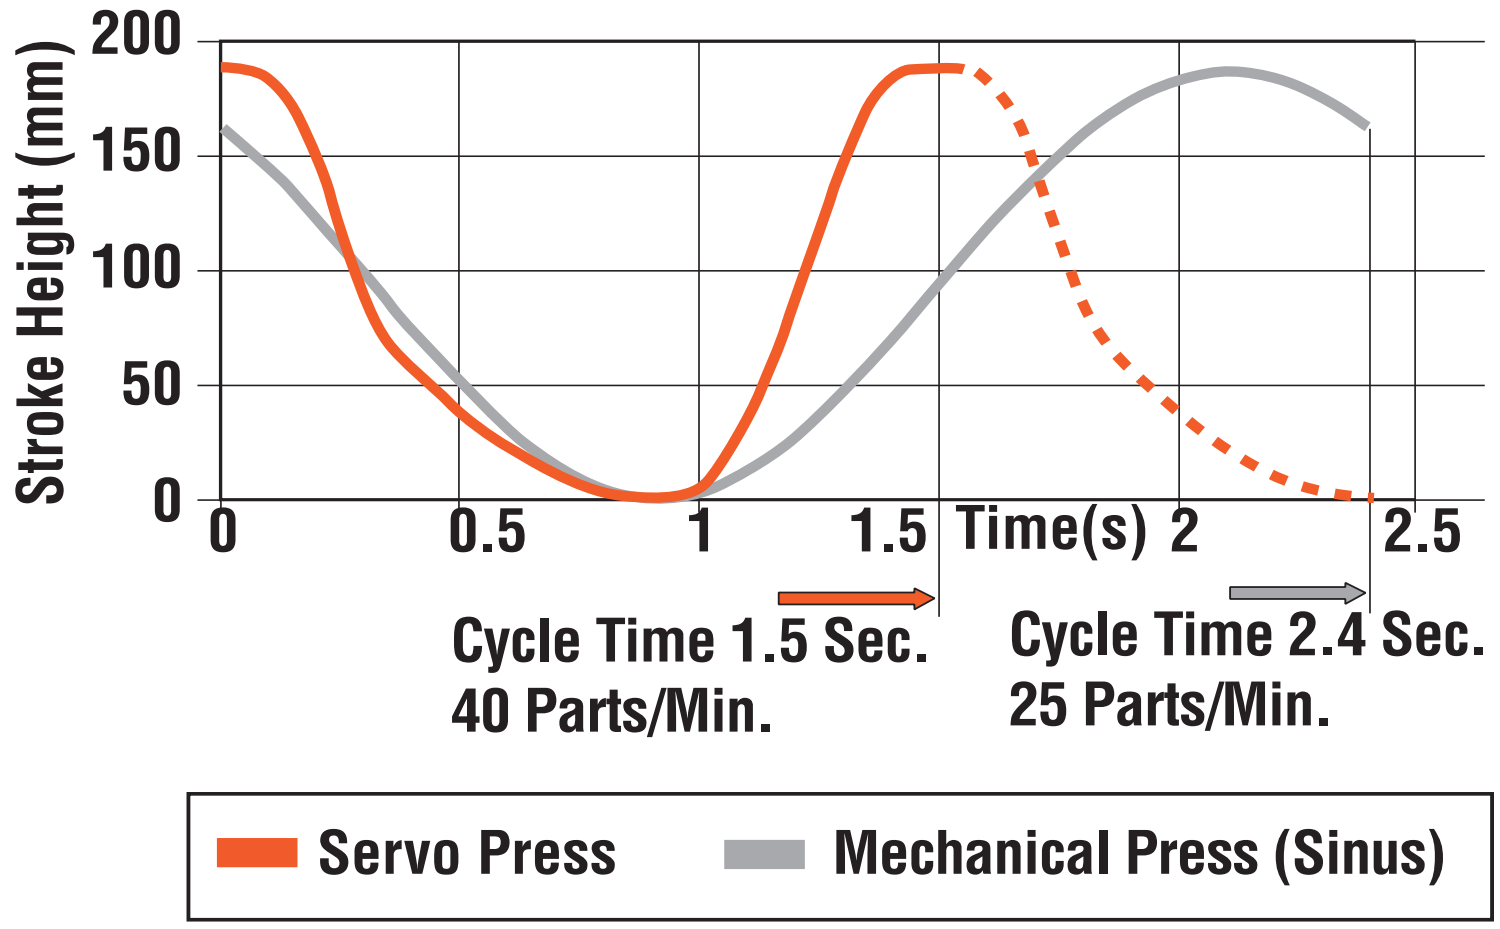
Figure 3: Cycle rates for servo-driven and flywheel-driven mechanical presses.B-9
- Variable Speed Slide and Acceleration/Deceleration: At any part of the press stroke, the slide speed in the forming stage can be programmed to accelerate, decelerate, or remain constant, as necessary. Decreasing the touch speed of upper and lower dies minimizes impact shocks, improving quality while increasing the life of tools and presses. After forming, returning to the top slide position (not necessarily Top Dead Center) can occur quickly. These slide movements may alter the frictional characteristics between dies and sheet materials.
- Dwell Function of the Slide: Programming the slide to dwell at bottom dead center (BDC) is critical when stamping press hardenable steels, as this time allows for the necessary cooling under full press load that is key to achieving the dimensional and strength properties. In other applications, coining pressure at BDC ensures shape and dimensional accuracy of the product formed.
- Quality Improvements: High cycle rates in flywheel driven presses risk heating the sheet metal and tooling, leading to breakdown of lubricants and accelerated tool wear. During blanking or hole piercing, high cycle rates increase the reverse-tonnage snap through loads, damaging cut edge quality and sending shock waves through your tooling and press. Servo-driven presses can slow down just before contact with the sheet metal to dramatically reduce impact forces and shock loads, yet maintain high productivity by having the ram move much faster while no work is occurring. Improved product consistency should translate to fewer rejections.
- Longer Tool Life: Decreasing the tool impact speed reduces impact loading, thus maximizing tool life. With servo-driven presses, there is not a productivity penalty. Slower speeds and less aggressive forming conditions may allow for use of a lower grade lubricant. Pulsating or oscillating slide motion can extend the working limit.
- Uptime: Fewer moving parts and reduced shock loads translate into reduced die fatigue and greater uptime.
- Independent Motion of the Die Cushion: Programmable die cushions available with some servo presses function like hydraulic cushions found on some mechanical presses. A pressure sensor within the servo die cushion controls its position. This allows for the optimization of metal flow in the flange between the die and the blank holder. Varying the blank holder force during the stroke reduces springback in AHSS.S-44 Additionally, servo-driven die cushions can regenerate energy when the upper die and slide push the cushion downward.
- Formability Improvements: Using a servo press with a modified press cycle has allowed some stampers to use a less expensive, less formable grade without increasing rejects or compromising dimensional tolerance.
- Reduced Noise: Fewer moving parts combined with slower tool impact speeds and reduced snap-through loads lead to a quieter work environment.
- Synchronization with Transfer and Feed Systems: Servo presses provide for adjustments in slide position and speed, allowing for optimized timing to coordinate with part transfer systems.
- Multiple Operations in One Cycle: Control of the slide position combine with the ability to dwell make In-die operations possible.
- Energy Savings: During operations like blanking or drawing, servomotor power is used only while the press is moving, unlike in mechanical presses with a continuously rotating flywheel and clutch/brake mechanism. These mechanical press components each have energy losses due to friction. The lower energy consumption and associated costs seen in servo-driven presses are even more substantial in larger capacity presses. Also contributing to the energy savings is the dynamic braking operation of the servo driven motor, where the energy from braking transfers back into the power system. Similarly, compressed die cushions can feed energy to the storage device. When economically justified, installation of an external energy storage unit can make up for energy peaks while reducing the nominal power drawn from the local power supply system.
Figure 4 illustrates power storage and output in a servo-mechanical press system over the course of a cycle. In this example, the press operates with two main motors, each having a maximum output of 175 kW. An external energy device stores energy from the slide deceleration, and is tapped when the press motion requires more than 175 kW from each motor. The stored energy (maximum of 350 kW combined in the two 175 kW motors) is available during peak power requirements, enabling the facility power load to remain nearly constant at around 50 kW.B-9
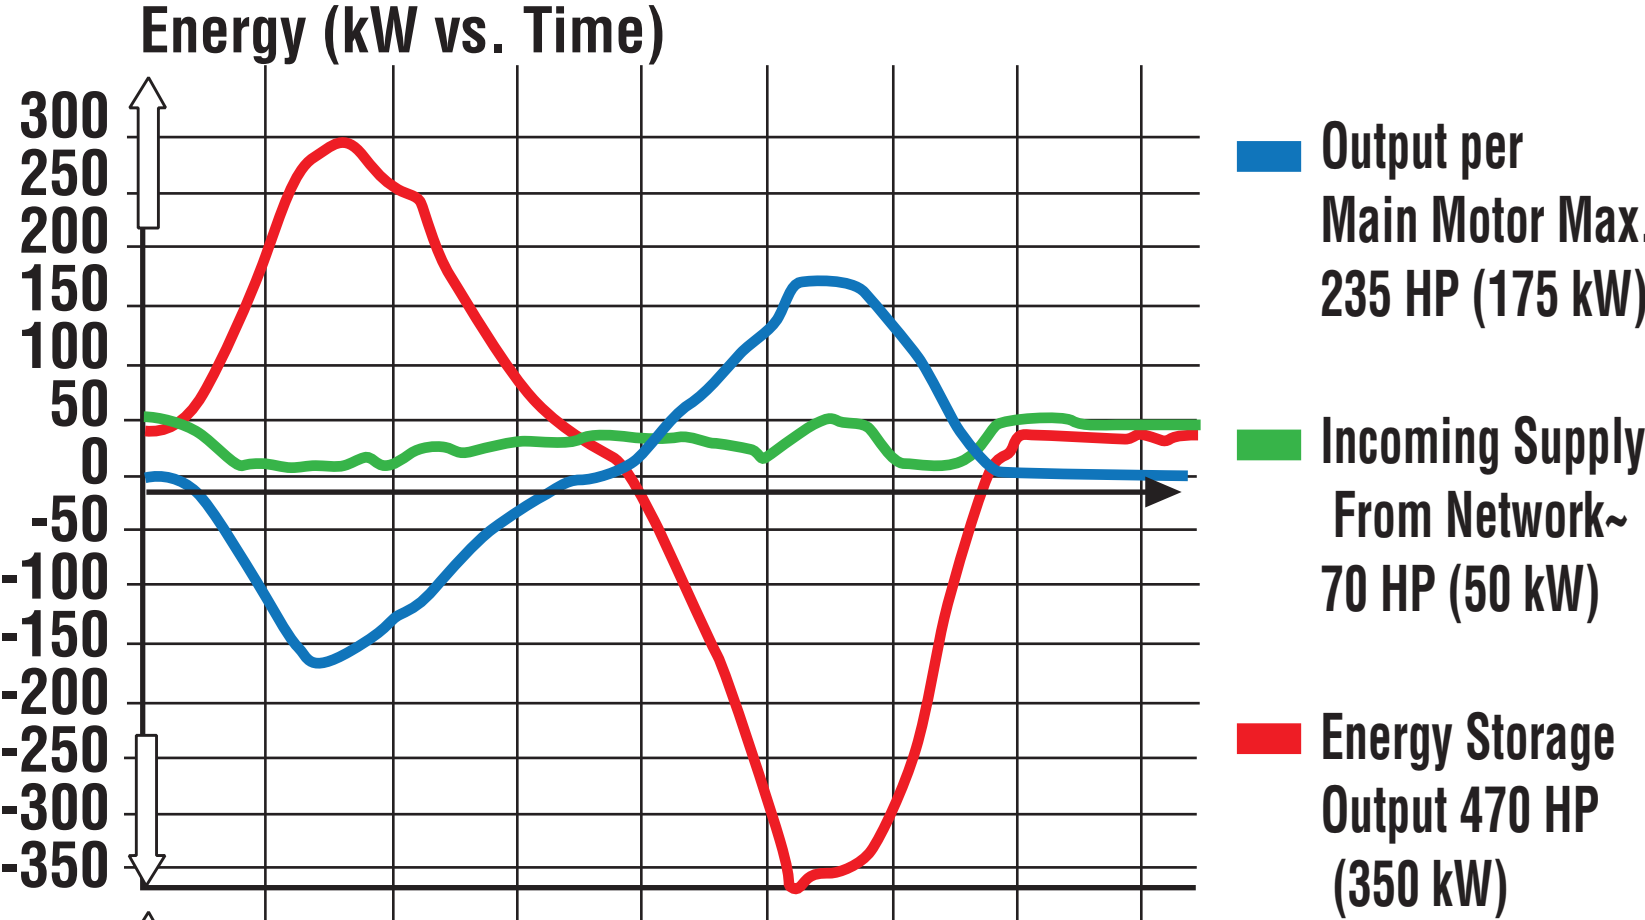
Figure 4: Power storage and output in a servo mechanical press system.B-9
Press Force and Press Energy
Categorizing both mechanical and hydraulic presses requires three different capacities or ratings – force, energy, and power. Historically, when making parts out of mild steel or even some HSLA steels, using the old rules-of-thumb to estimate forming loads was sufficient. Once the tonnage requirements and some processing requirements were known, stamping could occur in whichever press met those minimum tonnage and bed size requirements.
In these cases, press capacity (for example, 1000 kN) is a suitable number for the mechanical characteristics of a stamping press. Capacity, or tonnage rating, indicates the maximum force that the press can apply without damaging its components, like the machine frame, slide-adjusting mechanisms, pitman (connection rods) or main gear bushings.
A servo press transmits force (not energy) the same way as the equivalent conventional press (mechanical or hydraulic). However, the amount of force available throughout the stroke depends on whether the press is hydraulic or mechanically driven. Hydraulic presses can exert maximum force during the entire stroke as tonnage generation occurs via hydraulic fluid, pumps, and cylinders. Mechanical presses exert their maximum force at a specific distance above bottom dead center (BDC), usually defined at 0.5 inch. At increased distances above bottom dead center, the loss of mechanical advantage reduces the tonnage available for the press to apply. This phenomenon is known as de-rated tonnage, and it applies to conventional mechanical presses as well as servo-mechanical presses. Figure 5 shows a typical press-force curve for a 600-ton mechanical press. In this example, when the press is approximately 3 inches off BDC, the maximum tonnage available is only 250 tons – significantly less than the 600-ton rating.
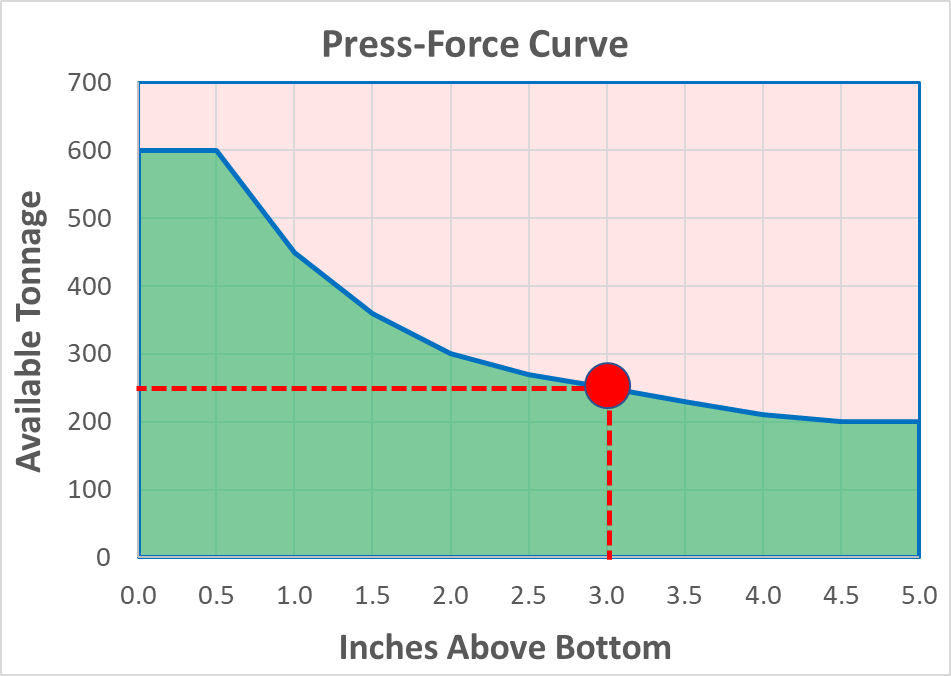
Figure 5: The Press-Force curve shows the maximum tonnage a mechanical press can apply based on the position of the slide relative to the bottom dead center reference distance. This de-rated tonnage applies to both conventional mechanical presses as well as servo-mechanical presses.E-2
Press energy reflects the ability to provide that force over a specified distance (draw depth) at a given cycle rate. Figure 6 shows a typical press-energy curve for the same 600-ton mechanical press. The energy available depends on the size and speed of the flywheel, as well as the size of the main drive motor. As the flywheel rotates faster, the amount of stored energy increases, reflected in the first portion of the curve. The cutting or forming process consumes energy, which the drive motor must replenish during the nonworking part of the stroke. At faster speeds, the motor has less time to restore the energy. If the energy cannot be restored in time, the press stalls. The graph illustrates how the available energy of the press diminishes to 25% of the rated capacity when accompanied by a speed reduction from 24 strokes per minute to 12 strokes per minute.
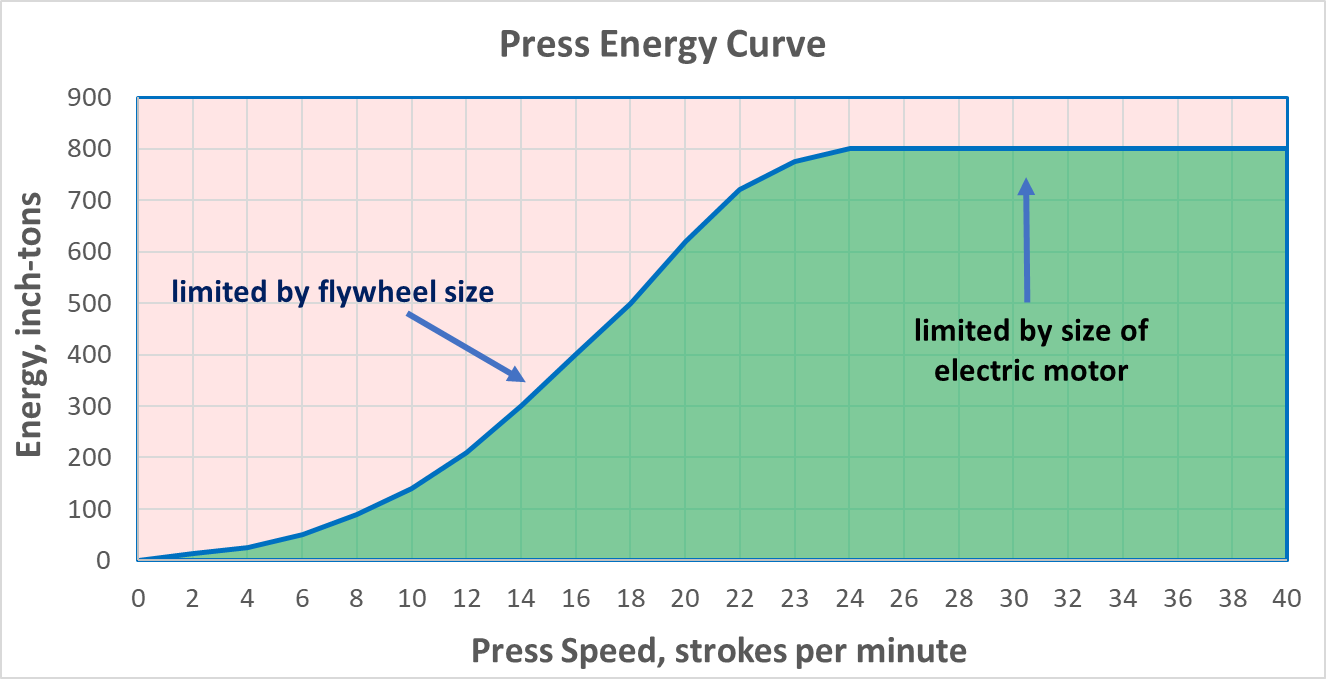
Figure 6: A representative press-energy curve for a 600 ton mechanical press. Reducing the stroke rate from 24 to 12 reduces available energy by 75%.E-2
Rules of thumb are useful to estimate press loads. However, a better evaluation of draw force, embossment force, and blank holding force comes from simulation tools. Many programs enable the user to specify all of the system inputs. This is especially important when forming AHSS because the rapid work hardening seen in these grades has a major effect on the press loads. In addition, instead of using a simple restraining force on blank movement, incorporating the geometry and effects of the actual draw beads leads to improved simulation accuracy.
A common shortcut taken in simulation is the assumption that the tools are rigid during forming. In practice, however, tools will deform elastically. Further increasing this deflection of the dies (sometimes called breathing) is the higher work hardening of AHSS grades. This discrepancy leads to a significant increase in the determined press loads, especially when the punch is at home position. Hence, for a given part, the draw depth used for the determination of the calculated press load is an important parameter. Applying the nominal draw depth may result in an over-estimation of press loads. Similarly, assuming that the structure, platens, bolsters, and other components of the press are completely rigid may lead to variation in press loads, especially after moving the physical tooling from one press to another.
In all cases, validation of all simulation predictions is good practice. Every simulation contains assumptions, with some being more critical than others. Use practical stamping tests to determine the optimum parameter settings for the simulation. Quick items to confirm simulation matches with reality include draw-in amounts (lay draw panel on top of blank) and press tonnages (check load monitors). When physical panels match simulation results, confidence in the simulation accuracy rises.
In processes like restrike operations, simulation may not accurately estimate press loads. In these cases, run “what-if” simulations to observe forming trends for a given part, which helps to develop a more favorable forming-process design.
Setting Draw Beads with Air Cushions and
Nitrogen Cylinders
Air cushions and nitrogen cylinders are common on single action mechanical presses to give them a double action. There is a tonnage spike on initial contact with the blankholder and setting of the draw beads, occurring while the press is still several inches off Bottom Dead Center. This spike increases the likelihood of a mechanical press being damaged. Figure 7 shows the potential negative consequences when a mechanical press exceeds the rated capacity of the press and the associated components.
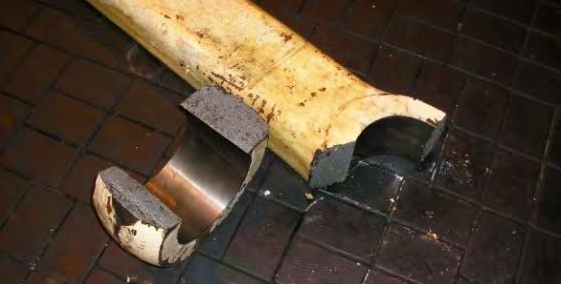
Figure 7: Broken connecting rod on a mechanical press.M-5
A nitrogen die cushion in a single-acting press needs to apply considerable force to set draw beads in AHSS sheets before drawing begins, as well as to apply stake beads at the end of the stroke for springback control. In some cases, binder separation may occur because of insufficient cushion tonnage, resulting in a loss of control for the stamping process and excessive wrinkling of the part or addendum. The high impact load on the cushion may occur several inches up from the bottom of the press stroke, where de-rated tonnage means a reduced maximum load to avoid press damage. Flywheel-driven mechanical presses are susceptible to damage due to these shock loads, since the impact point in the stroke occurs when the press is travelling at a higher velocity. The high shock loads dissipate additional flywheel energy well above bottom dead center of the stroke. Therefore, a nitrogen-die cushion may be inadequate for optimum pressure and process control when working with AHSS.
Staggering the heights of the nitrogen cylinders so they do not all engage at the same time is one way to reduce the shock load (Figure 8). A double-action press will set the draw beads when the outer slide approaches bottom dead center where the full tonnage rating is available and where the slide velocity is substantially lower. This minimizes any shock loads on the die and press with resultant load spikes less likely to exceed the rated press capacity.
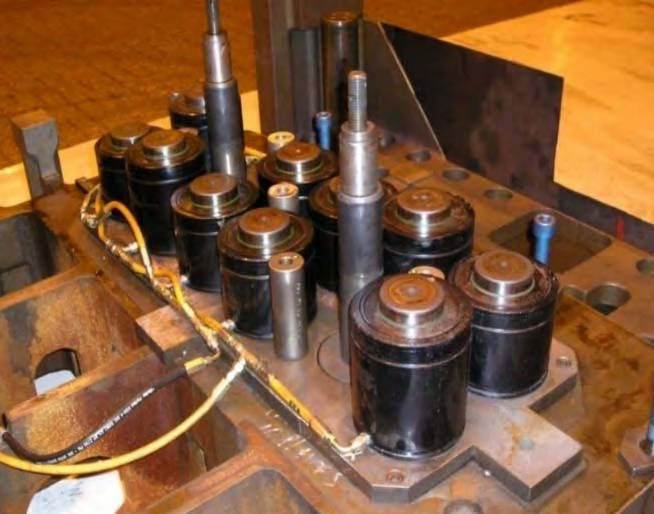
Figure 8: Staggered nitrogen cylinders reduce the initial shock load when setting draw beads by engaging at different depths in the press stroke.M-5
Press Considerations When Working With Higher Strength Steels (U-13)
The increased forces needed to form, cut and trim higher-strength steels create significant challenges for pressroom equipment and tooling. These include excessive tooling deflections, damaging tipping-moments, and amplified vibrations and snapthrough forces that can shock and break dies—and sometimes presses. Stamping AHSS materials can affect the size, strength, power and overall configuration of every major piece of the press line, including material-handling equipment, coil straighteners, feed systems and presses.
Here is what every stamper should know about higher-strength materials:
- Because higher-strength steels require more stress to deform, additional servo motor power and torque capability may be needed to pull the coil material through the straightener. Additional back tension between the coil feed and straightening equipment also may be required due to the higher yield strength of the material in the loop as the material tries to push back against the straightener and feed system.
- Because higher-strength materials require greater stress to blank and punch as compared to HSLA or mild steel, they generate proportionally increased snapthrough and reverse-unloading forces. High-tensile snapthrough forces introduce large downward accelerations to the upper die half. These forces work to separate the upper die from the bottom of the ram on every stroke. Insufficient die-clamping force could cause the upper-die half to separate from the bottom of the ram on each stroke, causing fatigue to the upper-die mounting fasteners.
- Because energy is expended with each stroke of the press—and this energy must be replaced—critical attention must focus on the size (horsepower) of the main drive motor and the rotational speed of the flywheel in higher-strength-steel applications. The main motor, with its electrical connection, provides the only source of energy for the press and it must generate sufficient power to meet the demands of the stamping operation. The motor must be properly sized to replace the increased energy expended during each press stroke. For these reasons, some stampers consider the benefits of servo-driven presses for these applications.
As steels becomes stronger, a corresponding increase in process knowledge is required in terms of die design, construction and maintenance, and equipment selection.
Case Study: The Importance of Press Energy
in Flywheel Driven Presses
In a flywheel-driven mechanical press, the size of the main motor, flywheel mass, and rotation speed of the flywheel become critical. The main motor, along with its electrical connections, is the only source of energy for the press and it must have sufficient power to supply the demands of the stamping operation. As the flywheel is an energy storage device, it must be able to store and deliver the required energy when needed. The stored energy varies by the square of the speed; thus, flywheels can store a large amount of energy when the press is running at full speed. If heat generation and forming problems occur when stamping AHSS grades, operators may be inclined to slow down press speeds. However, this slowdown may lead to not meeting the energy requirements to form the part, ultimately resulting in the press stalling.
Take the example of a part with a draw depth of 2 inches. If stamped from HSLA 350/450, it may need 150 tons of forming force, for a total of 300 inch-tons of forming energy (2 inches times 150 tons). On this press, 14 strokes per minute is sufficient to generate enough forming energy, as indicated by the green dot in Figure 9.
Studies have shown that the forming tonnage of DP steels may be twice that of HSLA steels, which means that the 2 inch draw depth could need 300 tons of forming force, for a total of 600 inch-tons of forming energy. The red dot in Figure 9 shows that our press must run at 20 strokes per minute to ensure that there is sufficient forming energy. The speed is well within the capability of the press, but our strategy of running faster may not be appropriate for forming AHSS grades where heat generation could result in lubricant breakdown leading to die wear, galling, and scoring. Running the press slower to avoid these concerns increases the risk of stalling.
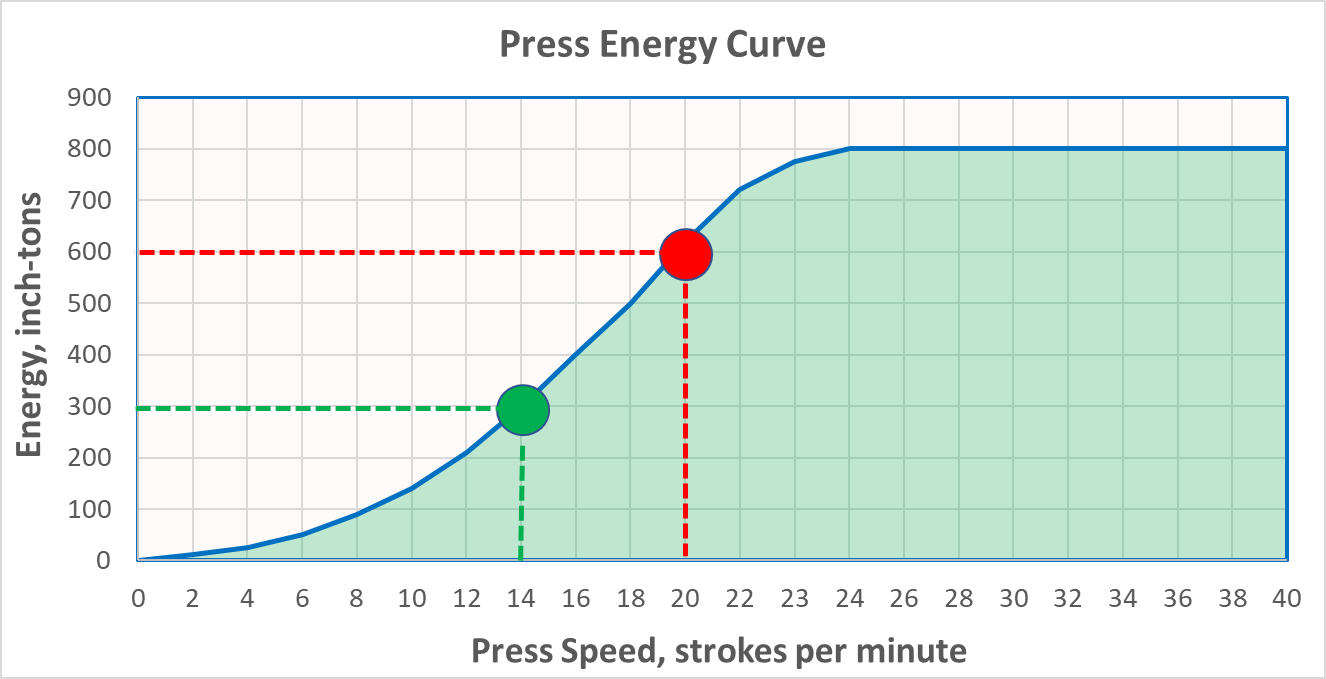
Figure 9: Higher strength materials requiring increased forming energy also require faster cycle times. If the greater cycle time cannot be maintained due to reasons like heat buildup or lubricant breakdown, a flywheel-driven press may stall.E-2
Case Study: Press Force and Press EnergyH-3
Predicting the press forces needed initially to form a part is known from a basic understanding of sheet metal forming. Different methods are available to calculate drawing force, ram force, slide force, or blankholder force. The press load signature is an output from most forming-process development simulation programs, as well as special press load monitors.
Most structural components include design features to improve local stiffness. Typically, forming of the features requiring embossing processes occurs near the end of the stroke near Bottom Dead Center. Predicting forces needed for such a process is usually based on press shop experiences applicable to conventional steel grades. To generate comparable numbers for AHSS grades, forming process simulation is recommended.
In Citation H-3, stamping simulations evaluated the forming of a cross member having a hat-profile with an embossment formed at the end of the stroke (Figure 10). The study simulated press forces and press energy involved for drawing and embossing a channel section from four steel grades approximately 1.5 mm thick: mild steel, HSLA 250/350, HSLA 350/450, and DP 350/600. Figures 11A and 11B clearly show that the embossing phase rather than the drawing phase dominates the total force and energy requirements, even though the punch travel for embossing is only a fraction of the drawing depth.
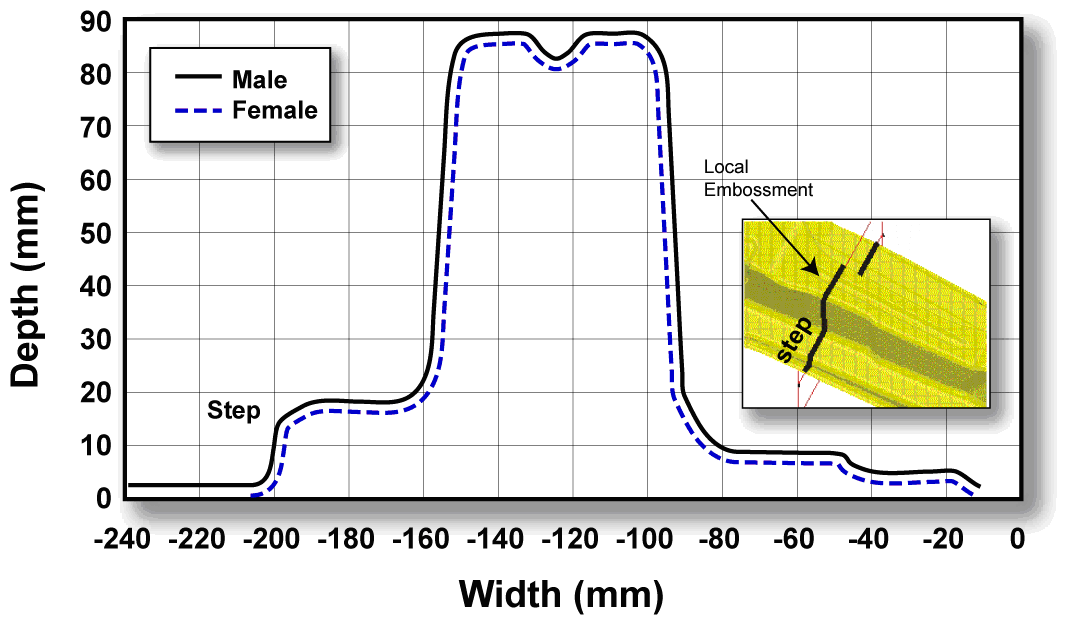
Figure 10: Cross section of a component having a longitudinal embossment to improve local stiffness.H-3
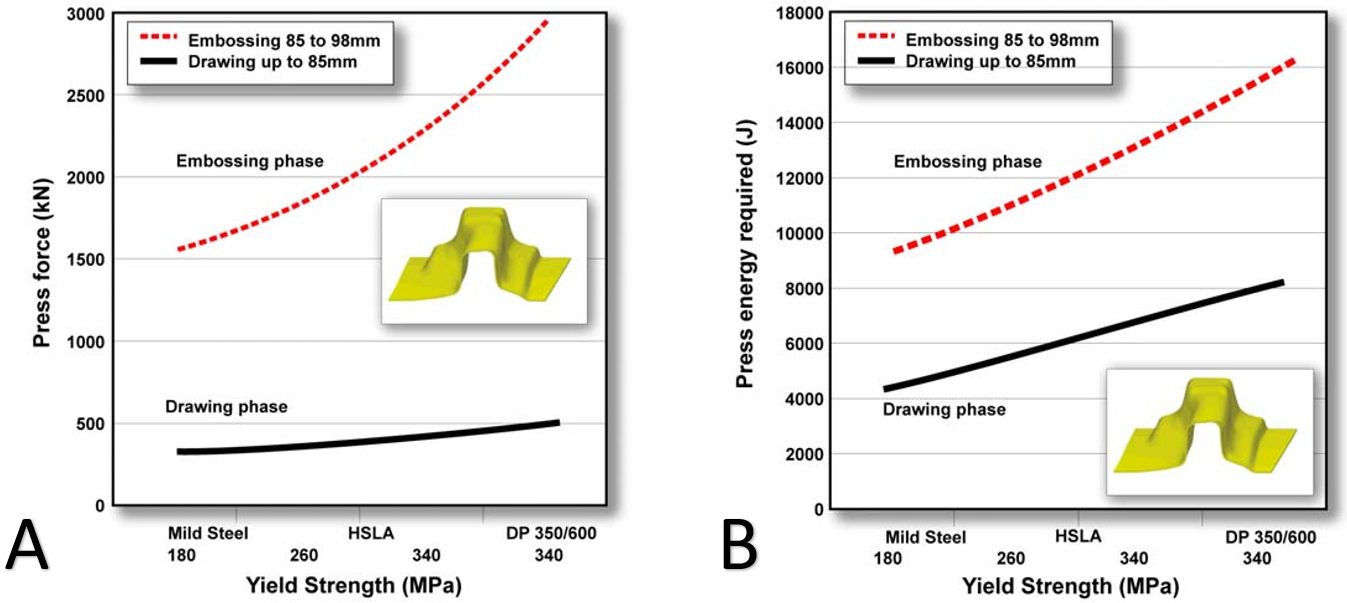
Figure 11: Embossing requires significantly more (A) force and (B) energy than drawing, even though the punch travel in the embossing stage is much smaller.H-3
Figures 12 and 13 highlight the press energy requirements, showing the greater energy required for higher strength steels. The embossment starts to form at a punch displacement of 85 mm, indicated by the three dots in Figure 12. The last increment of punch travel to 98 mm requires significantly higher energy, as shown in Figure 13. Note that compared with mild steel, the dual phase steel grade requires significantly more energy to form the part to home with the 98 mm travel.
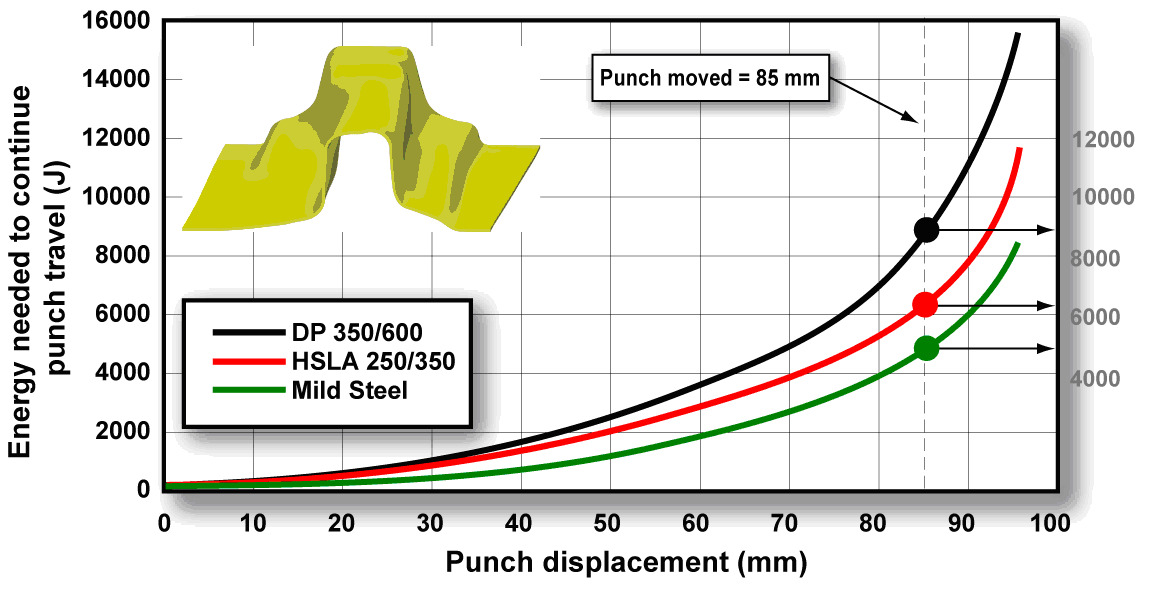
Figure 12: Energy needed to form the component increases for higher strength steel grades. Forming the embossment begins at 85 mm of punch travel, indicated by the 3 dots.H-3
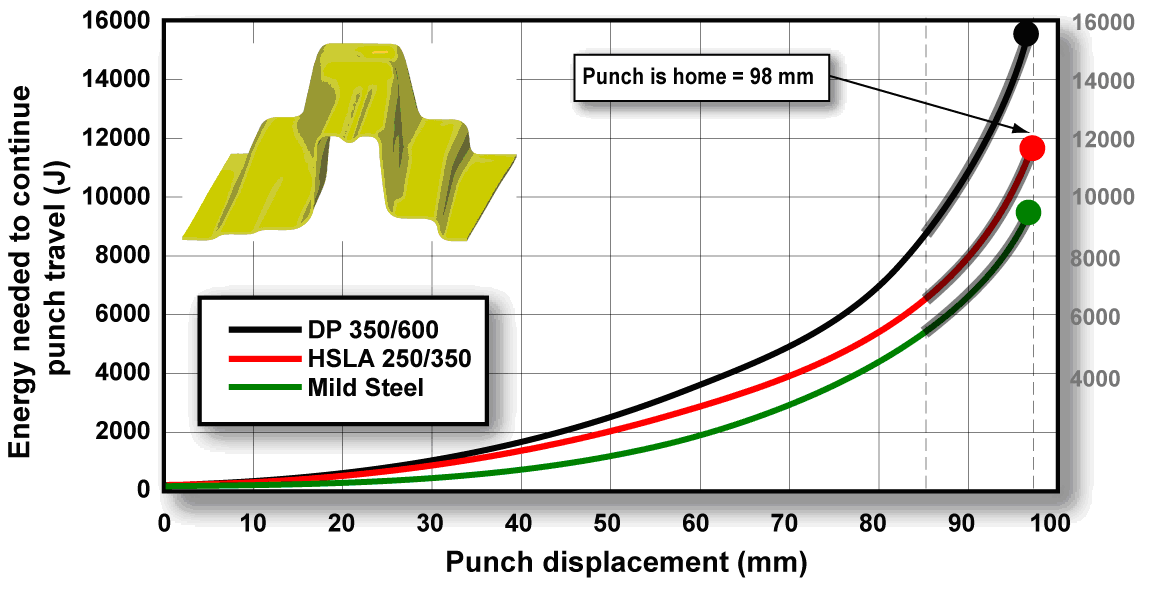
Figure 13: Additional energy required to form the embossment increases for higher strength steel grades.H-3
It is not only embossments that require substantially more force and energy at the end of the stroke. Stake beads for springback control engage late in the stroke to provide sidewall stretch. Depending on the design of the forming process, the steel into which the stake beads engage may have passed through conventional draw beads for metal flow control, and therefore are work-hardened to an even higher strength. This leads to greater requirements for die closing force and energy. Certain draw-bead geometries which demand different closing conditions around the periphery of the stamping also may influence closing force and energy requirements.
Energy Requirements
Using existing production data can estimate press loads for simple geometries, knowing just the thickness and tensile strength. There is a proportional increase in forming load (F) resulting from the product of thickness (t) and tensile strength (Rm). For example, in your current production (1), you know your drawing force F1, and the thickness t1 and tensile strength Rm1 of the steel you are forming. You are switching production (2) to a new tensile strength Rm2 and thickness t2, and you want to know the drawing force F2. Set up the following equation:

which is the same as

The work in Citation T-11 studied the press loads required to form a cross member with a simple hat profile from two steels of the same 0.7 mm thickness: HSLA 350/450 and DP 300/500 steels. Here, it was known that an HSLA coil with 433 MPa tensile strength required 791 kN of drawing force. Of interest was the drawing force required to stamp a dual phase steel with a tensile strength of 522 MPa. Using the equations above, the estimated force F2 was calculated as 954MPa:

This estimated 954 MPa compares favorably with the force measured during their trial stamping of 934 MPa. Using this technique typically is sufficient to estimate the press requirements, but may lead to an over-estimation of the actual loads.
The energy required for plastically deforming a material (force times distance) has the same units as the area under the true stress-true strain curve. For this reason, assessing the forming energy requirements of two grades requires comparing the respective areas under their true stress – true strain curves. The shape and magnitude of these curves are a function of the yield strength and work hardening behavior as characterized by the n-value. At the same yield strength, a grade with higher n-value will require greater press energy capability, as highlighted in Figure 14 which compares HSLA 350/450 and DP 350/600. For these specific tensile test results, there is approximately 30% greater area under the DP curve compared with the HSLA curve, suggesting that forming the DP grade requires 30% more energy than required to form a part from the HSLA grade.
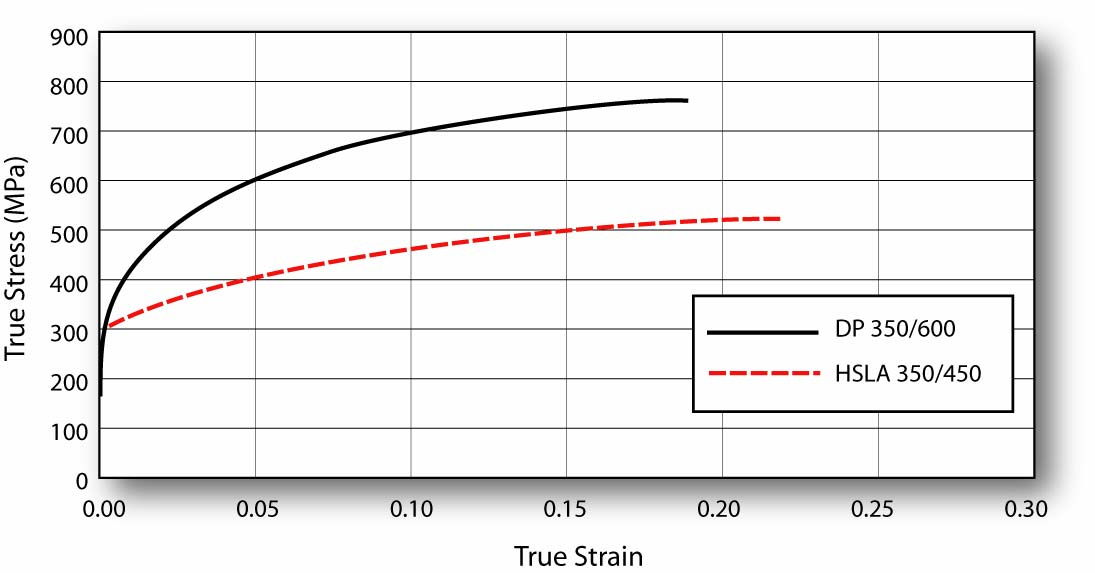
Figure 14: True stress-strain curves for two materials with equal yield strength.T-11
Greater work hardening of DP steels results in higher forming tonnage requirements when compared to HSLA grades at the same incoming yield strength and sheet thickness. However, AHSS applications justify a thickness reduction, and along with this is a reduction in the required press load. The required power is a function of applied forces, the displacement of the moving parts, and the speed. The energy rating of a press is also a function of applied press load and the distance over which the load is applied. For example, pushing 200 tons through 3 inches of deep drawing requires 600 inch–tons of energy. Changing the part to AHSS could require 500 tons of force working through the same 3 inch distance, requiring 1500 inch-tons of energy. Each stroke of the press expends a given amount of energy, all of which must be replaced before the next stroke begins.
Key Points
- Forming AHSS steels require increased press loads primarily because of their increased work hardening and increased strength levels.
- Press energy availability is as important as press force capacity when selecting a press to form AHSS grades.
- Slowing a press to counteract heat build-up may lead to stalling of flywheel-driven presses due to insufficient press energy availability.
- Comparing the areas under the respective true stress-true strain curves is one way to assess the additional increase in required press energy between two grades.
- Embossments and other features engaging off bottom dead center require sufficient de-rated tonnage and press energy at appropriate distances off bottom.
- DP 350/600 requires about twice the energy to form a hat-profile cross member than the same cross member formed from mild steel.
- Forming and process simulations are the most efficient and accurate approach to estimating the punch force and energy requirements to process AHSS grades.
- Servo-driven presses have characteristics which make them suitable for forming complex geometries using advanced high strength steels. Adding to their business case, servo-driven presses are more energy efficient and the flexibility in press cycle profiles can lead to enhanced productivity.
Back To Top
Testing and Characterization
The term local formability describes when part and process design, in addition to sheet metal properties like strength and elongation, influence the amount of deformation the metal can undergo prior to failure. Cutting, punching or other methods of obtaining a trimmed blank or an internal hole results in cracks, rough edges, work-hardening and other edge damage – all of which influences edge quality. The challenges of capturing all of the factors that influence edge quality makes the prediction of fracture severity and cut edge expansion very difficult and usually impossible. The many variables highlight the need for a standardized test method. However, restricted sample preparation and testing variables in these standards do not reflect the variety of conditions encountered in production environments. Use caution when comparing results generated under different conditions.
Hole Expansion Testing
The Hole Expansion test (HET) quantifies the edge stretching capability of a sheet metal grade having a specific edge condition. Higher values of the hole expansion ratio are associated with grades and forming methods more likely to have improved local formability characteristics.
Steel producers study hole expansion capacity to create new products with targeted edge stretching performance through modifications of chemistry, rolling and thermal practices. Product designers use the hole expansion test to determine if the chosen steel grade has the inherent forming characteristics to meet their targeted shape with their chosen forming system. If they are not compatible, the chosen grade must change or aspects of the forming process must change, or possibly both.
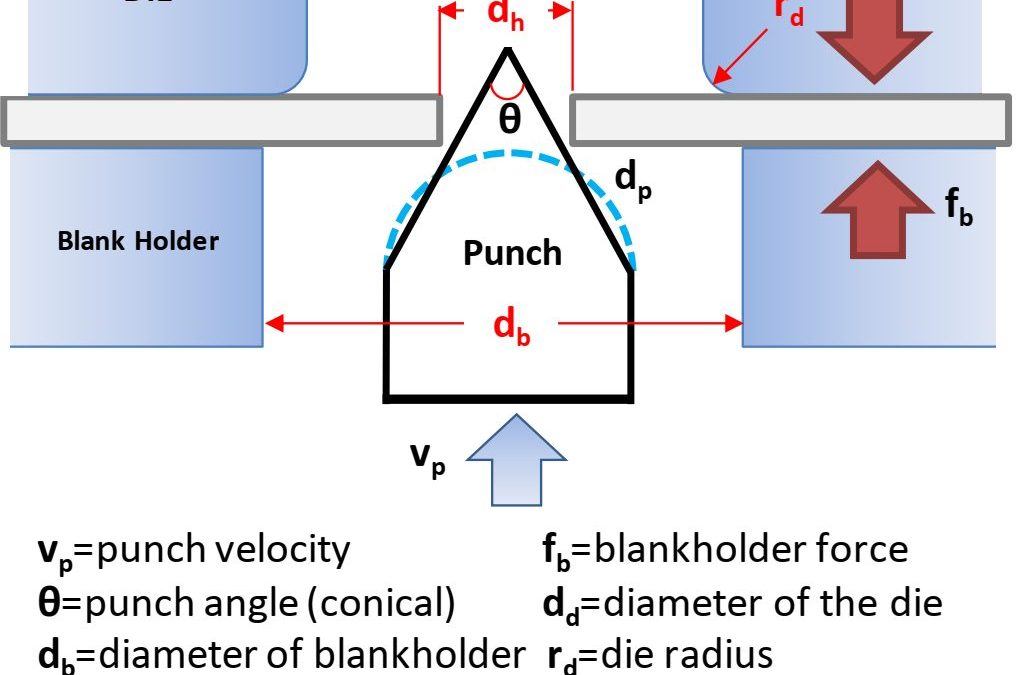
ISO 16630 is the primary standard used which describes the test method and constraints.I-9 Others, like JIS Z 2256J-6 are based on the ISO standard, with only minor differences, if any. This standard specifies use of a 10mm diameter hole created with a 12% clearance. The sample containing the hole is clamped in place, and a conical punch having a 60 degree apex angle expands that initial hole (Figure 1). The test stops after observation of a through-thickness crack or upon experiencing a load-drop exceeding a critical threshold (Figure 2). The hole expansion ratio (HER), also known as the Hole Expansion Capacity (HEC), is simply the percent expansion of the diameter of the initial hole, typically shown as the Greek letter lambda, λ.
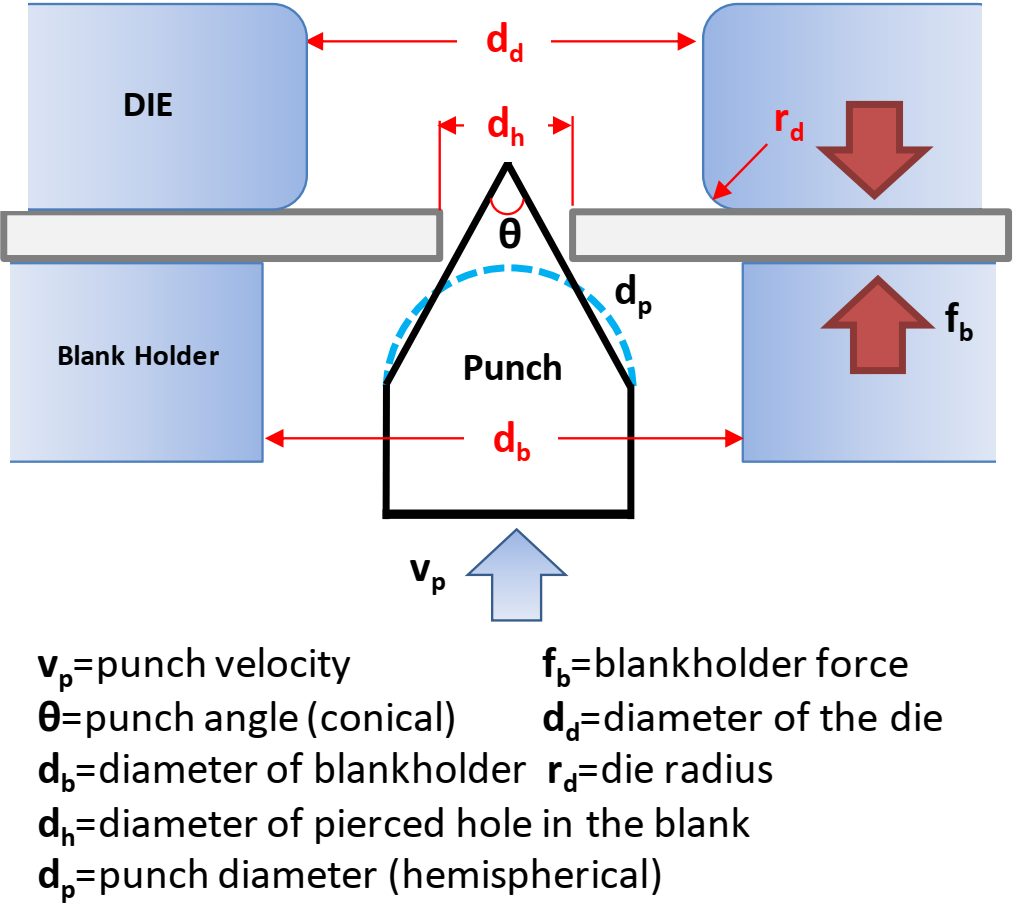
Figure 1: Schematic of Hole Expansion Test.A-10
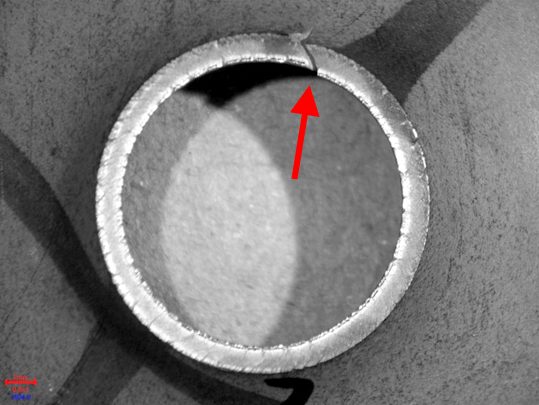
Figure 2: Expanded Edge at the end of a Hole Expansion Test performed using a conical punch. The arrow points to the through-thickness crack that ended the test.E-2
The sample preparation and testing requirements of ISO 16630 are well-defined for good reason. Factors known to influence the hole expansion ratio include:
Even with these rigorously defined procedures, the test results can be heavily influenced by specimen preparation technique, specific test parameters, and human subjectivity – in other words, poor gage R&R (repeatability and reproducibility). For example a group of European steel researchers reported “an unacceptably large difference between labs” with regard to hole expansion testing. They ultimately concluded that the “difference is too large for the method to be useful in practice”.
A-76
Testing sheet steels of different thicknesses in a laboratory setting requires having multiple punches and/or dies of different diameter to maintain a consistent clearance, which is based on a percentage of the sheet thickness tested.
In production, the punch-to-die clearance can change during the life of the part, both from tooling wear as well as press misalignment. There is the additional risk that clearance can vary around the perimeter of the cut section, leading to inconsistent performance. Increasing sheet metal strength magnifies this issue.
The method used to create the free edge influences the edge quality. Improved edge quality and reduced mechanical work hardening of the edge is achieved by laser cutting, EDM cutting, water jet cutting, or fine blanking processes, and will typically improve the hole expansion ratio. Trim steel clearances, shear angles, tool steel types, and sharpness also impact hole expansion test results.
In the example shown in Figure 3, the hole expansion ratio is reduced from 280% for a milled or water jet edge down to 80% for a traditional cut edge. If clearances further increase – which could happen without proper tooling maintenance over the life of the part – the ability to expand a cut edge further decreases.
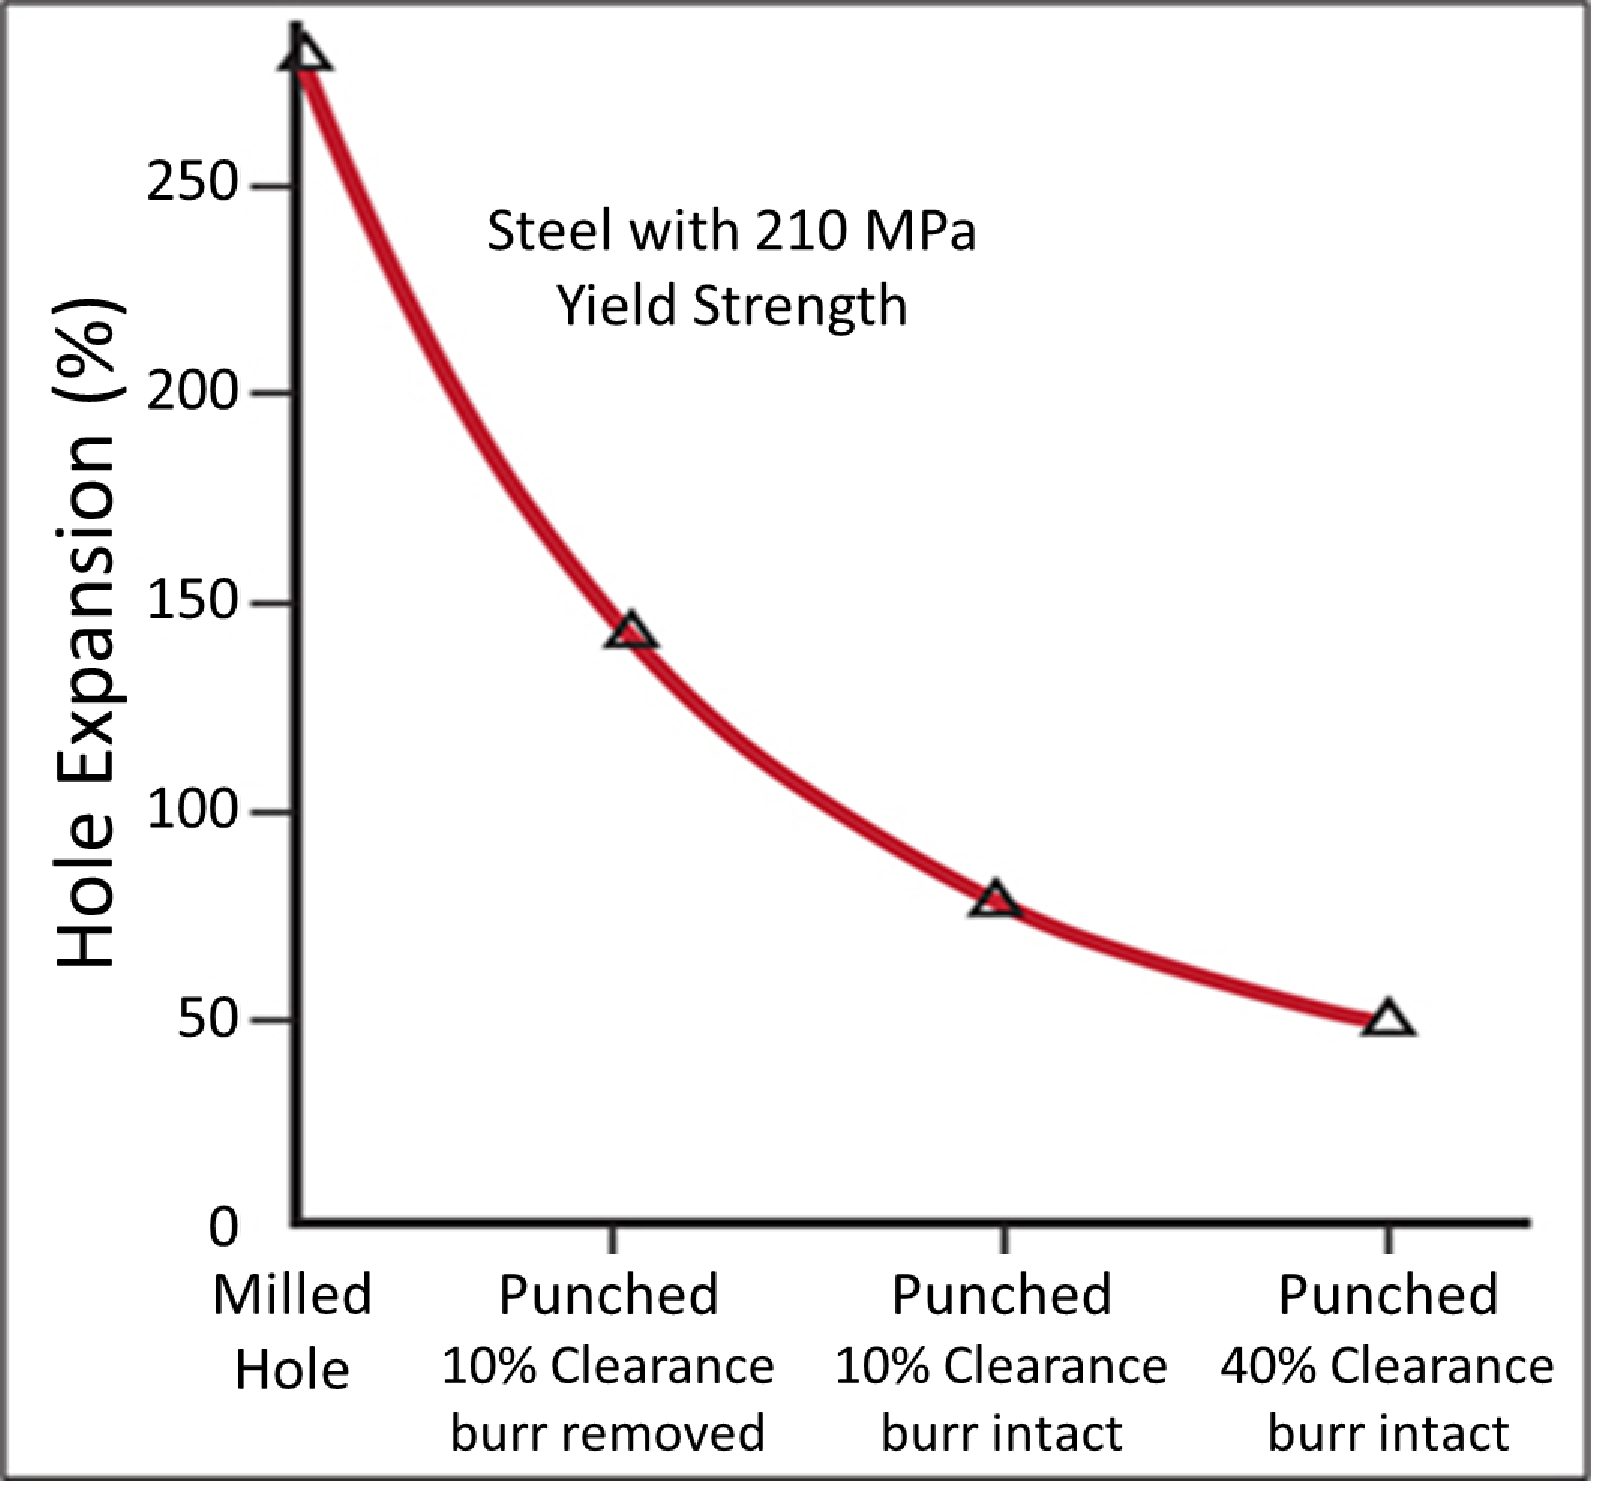
Figure 3: Hole Expansion Capacity Decreased as Edge Quality Decreases. (Based on data from Citation H-1.)
Figure 4 highlights the effect of punched vs machined holes, showing the edge damage from punching lowers the hole expansion capability. This edge damage becomes a key component of what is known as the Shear Affected Zone, or SAZ. DP steels and TRIP steels have a large hardness difference between the constituent phases, and therefore are associated with lower hole expansion ratios than HSLA and CP steels, where the phases are of more similar hardness. The influence of the metallurgical phase hardness difference is explored here. Detailed studies of sheared edge stretchability as a function of clearance, edge preparation, and grade are shown in Citations K-6 and K-10.
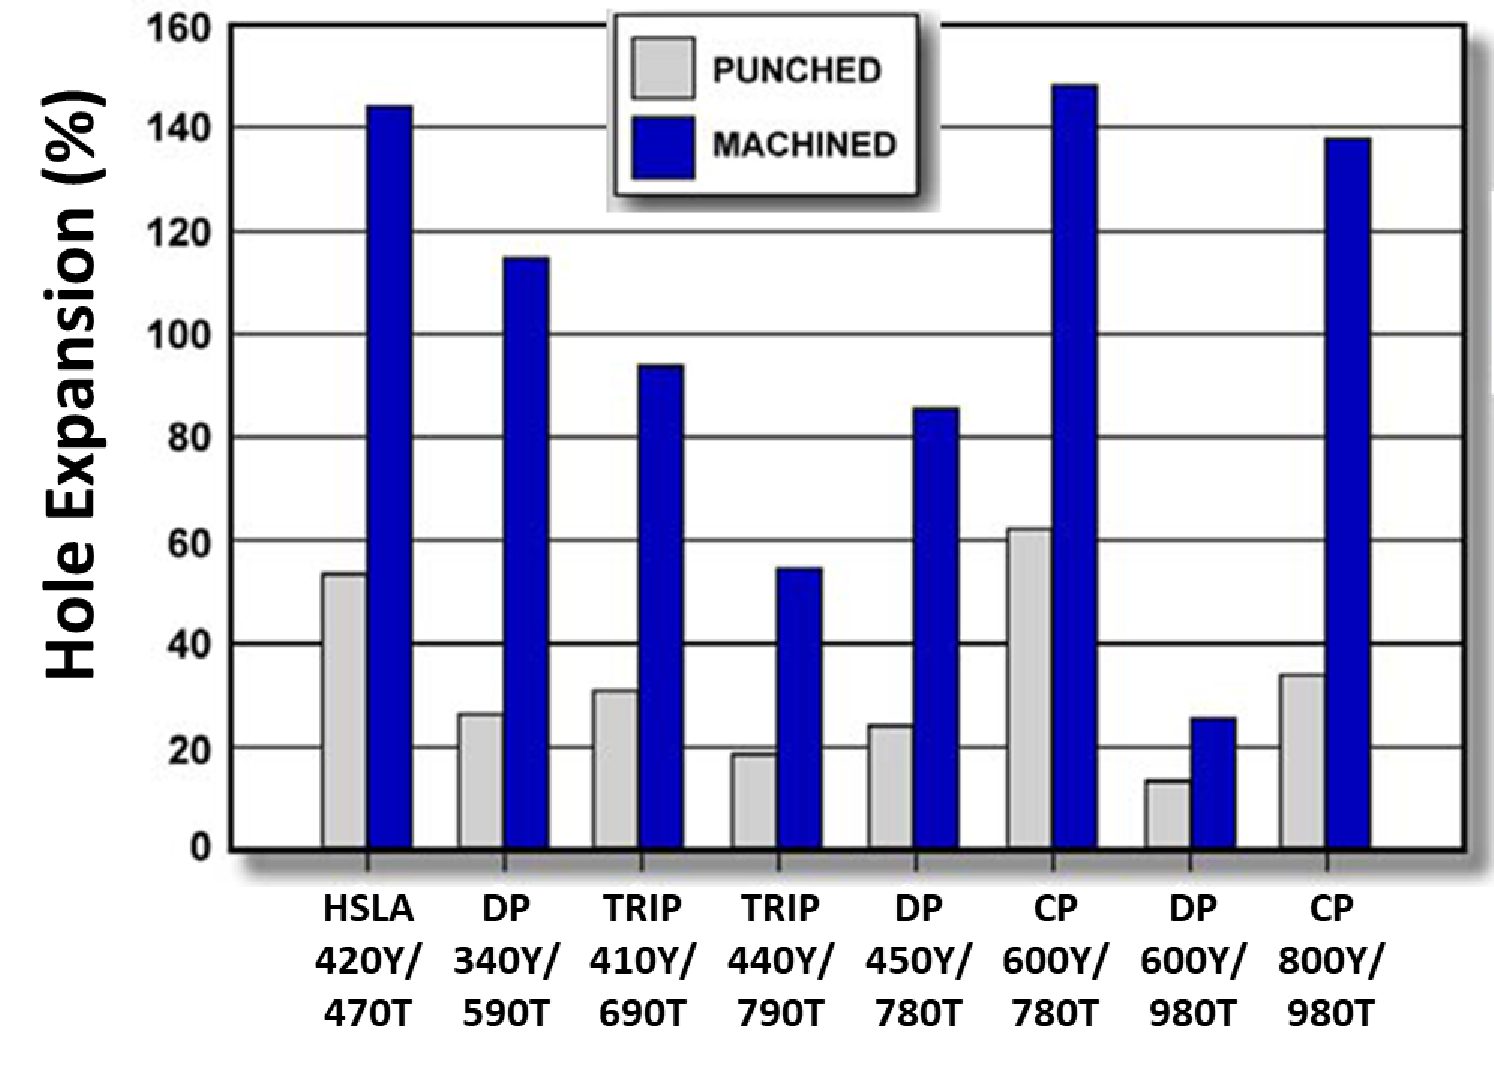
Figure 4: Hole expansion test results comparing punched and machined holes showing effect of damage to edge stretchability. (Based on data from Citation V-1.)
Over time, the targeted edge quality degrades and targeted clearance changes without proper attention. A study documented in Citation C-1 evaluated the hole expansion ratio created by hole punching tools as they wore in a production environment. Tools evaluated were made from 60 HRC uncoated Powder Metallurgy tool steels. Data in Figure 5 show the percent hole expansion from newly ground punches and dies (Sharp Tools) and from used production punches and dies (Worn Tools). The radial clearance was 0.1 mm. A rust preventative oil was applied to the steels during the punching; a lubricant oil was applied during hole expansion. Tool wear and possible micro-chipping resulted in a poor edge condition. The clearance was not significantly affected, but the steel edges suffered cold work which dramatically affected their hole expansion results.
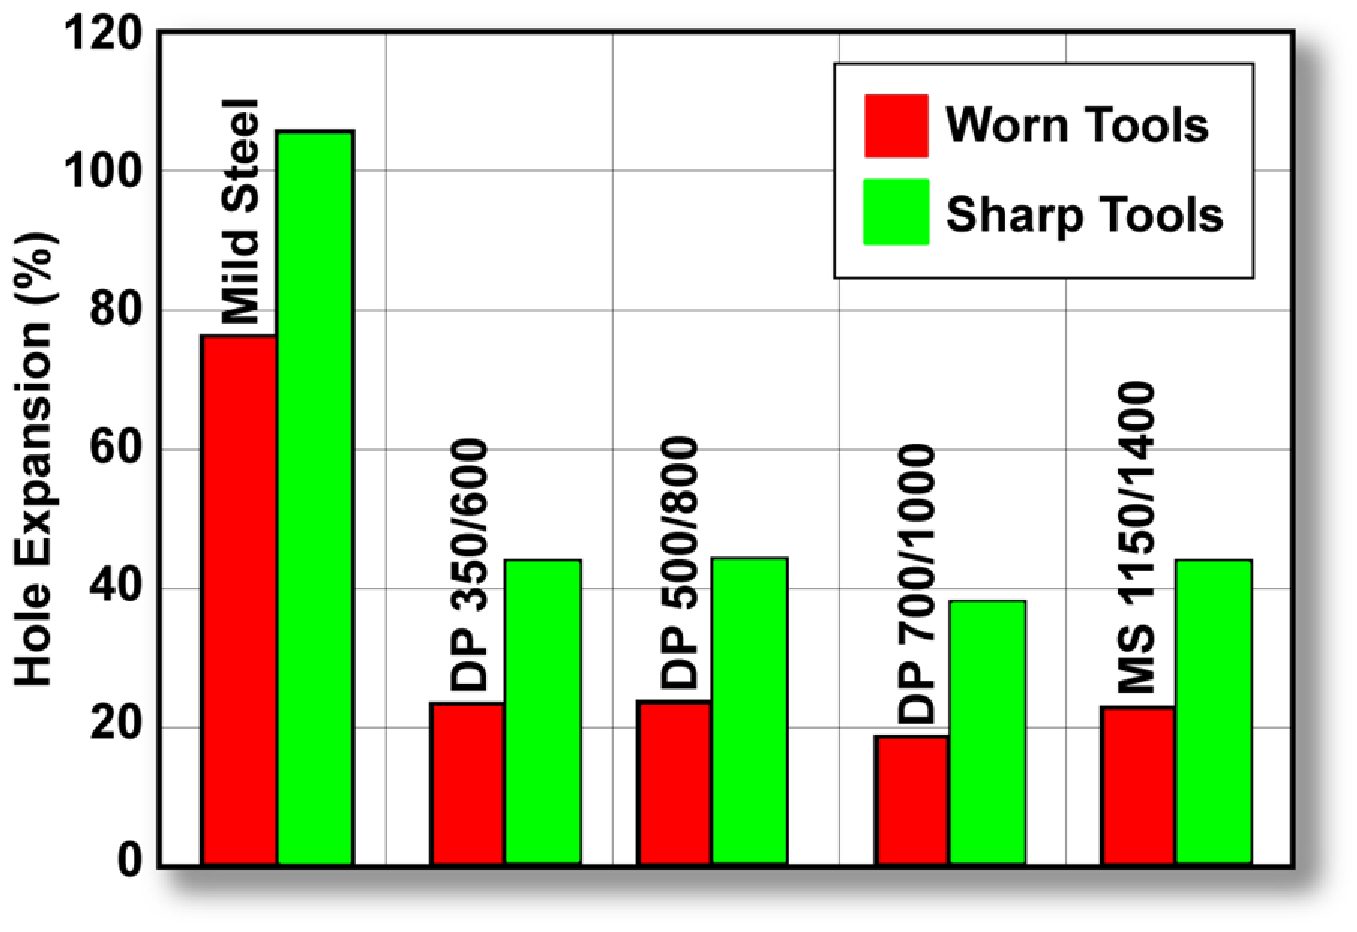
Figure 5: Impact of production tooling condition on hole expansion performance. (tests conducted w 50 mm diameter conical punch).C-1
Conclusions from Citation C-1 include:
- The best quality edge condition will produce the best results
- Tooling must remain sharp and damage-free to maintain the consistency in edge conditions.
- The burr should be in contact with the punch rather than on the freely-expanding side
- Hard and wear resistant tools, such as those produced from coated powder metallurgy (PM) tool steels, are highly recommended.
Additional information on tool materials can be found here and other articles in that category.
The ISO 16630 specificationI-9 eliminates one variable by prescribing the use of a 10 mm diameter hole, but it is important to understand that starting hole diameter influences the degree to which that hole can be expanded. A study that included mild steels to AHSS grades evaluated the effect of starting hole diameter.I-10 All steels were 1.2mm, punched with a clearance of 12.5%, and expanded with a conical punch having a 60° apex angle. As the starting diameter increases, the degree to which the hole can be expanded decreases, Figure 6. Note that as the strength increases, this effect appears to be minimized.
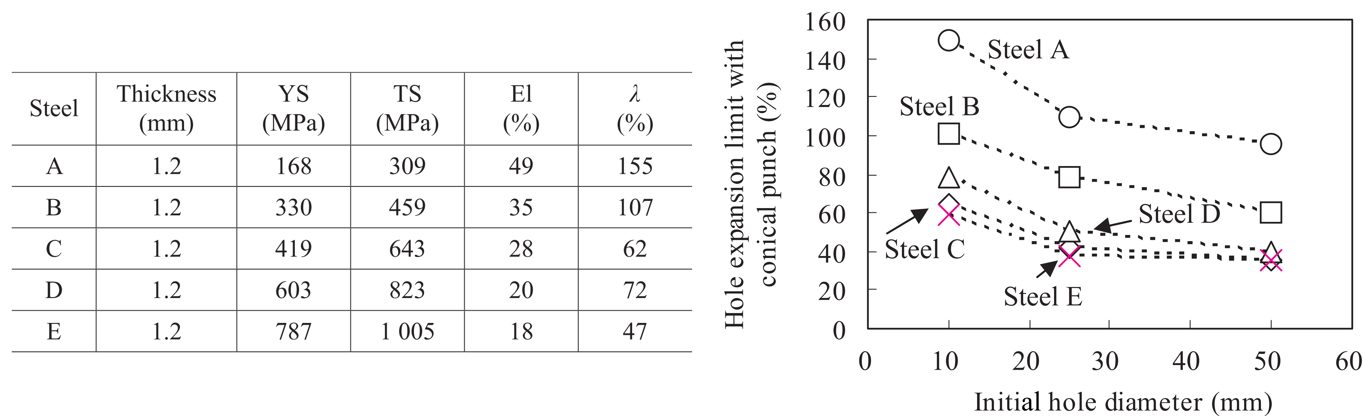
Figure 6: Hole Expansion Ratio Decreases as Initial Hole Diameter Increases.I-10
Increasing the starting hole diameter may help to distinguish between different grades.K-11 Similar hole expansion performance exists between DP980 and TRIP780 under ISO 16630 test conditions (punched 10 mm hole). It is easier to discern better performance in the TRIP780 product when performing a similar test with a 75 mm diameter punched hole (Figure 7).
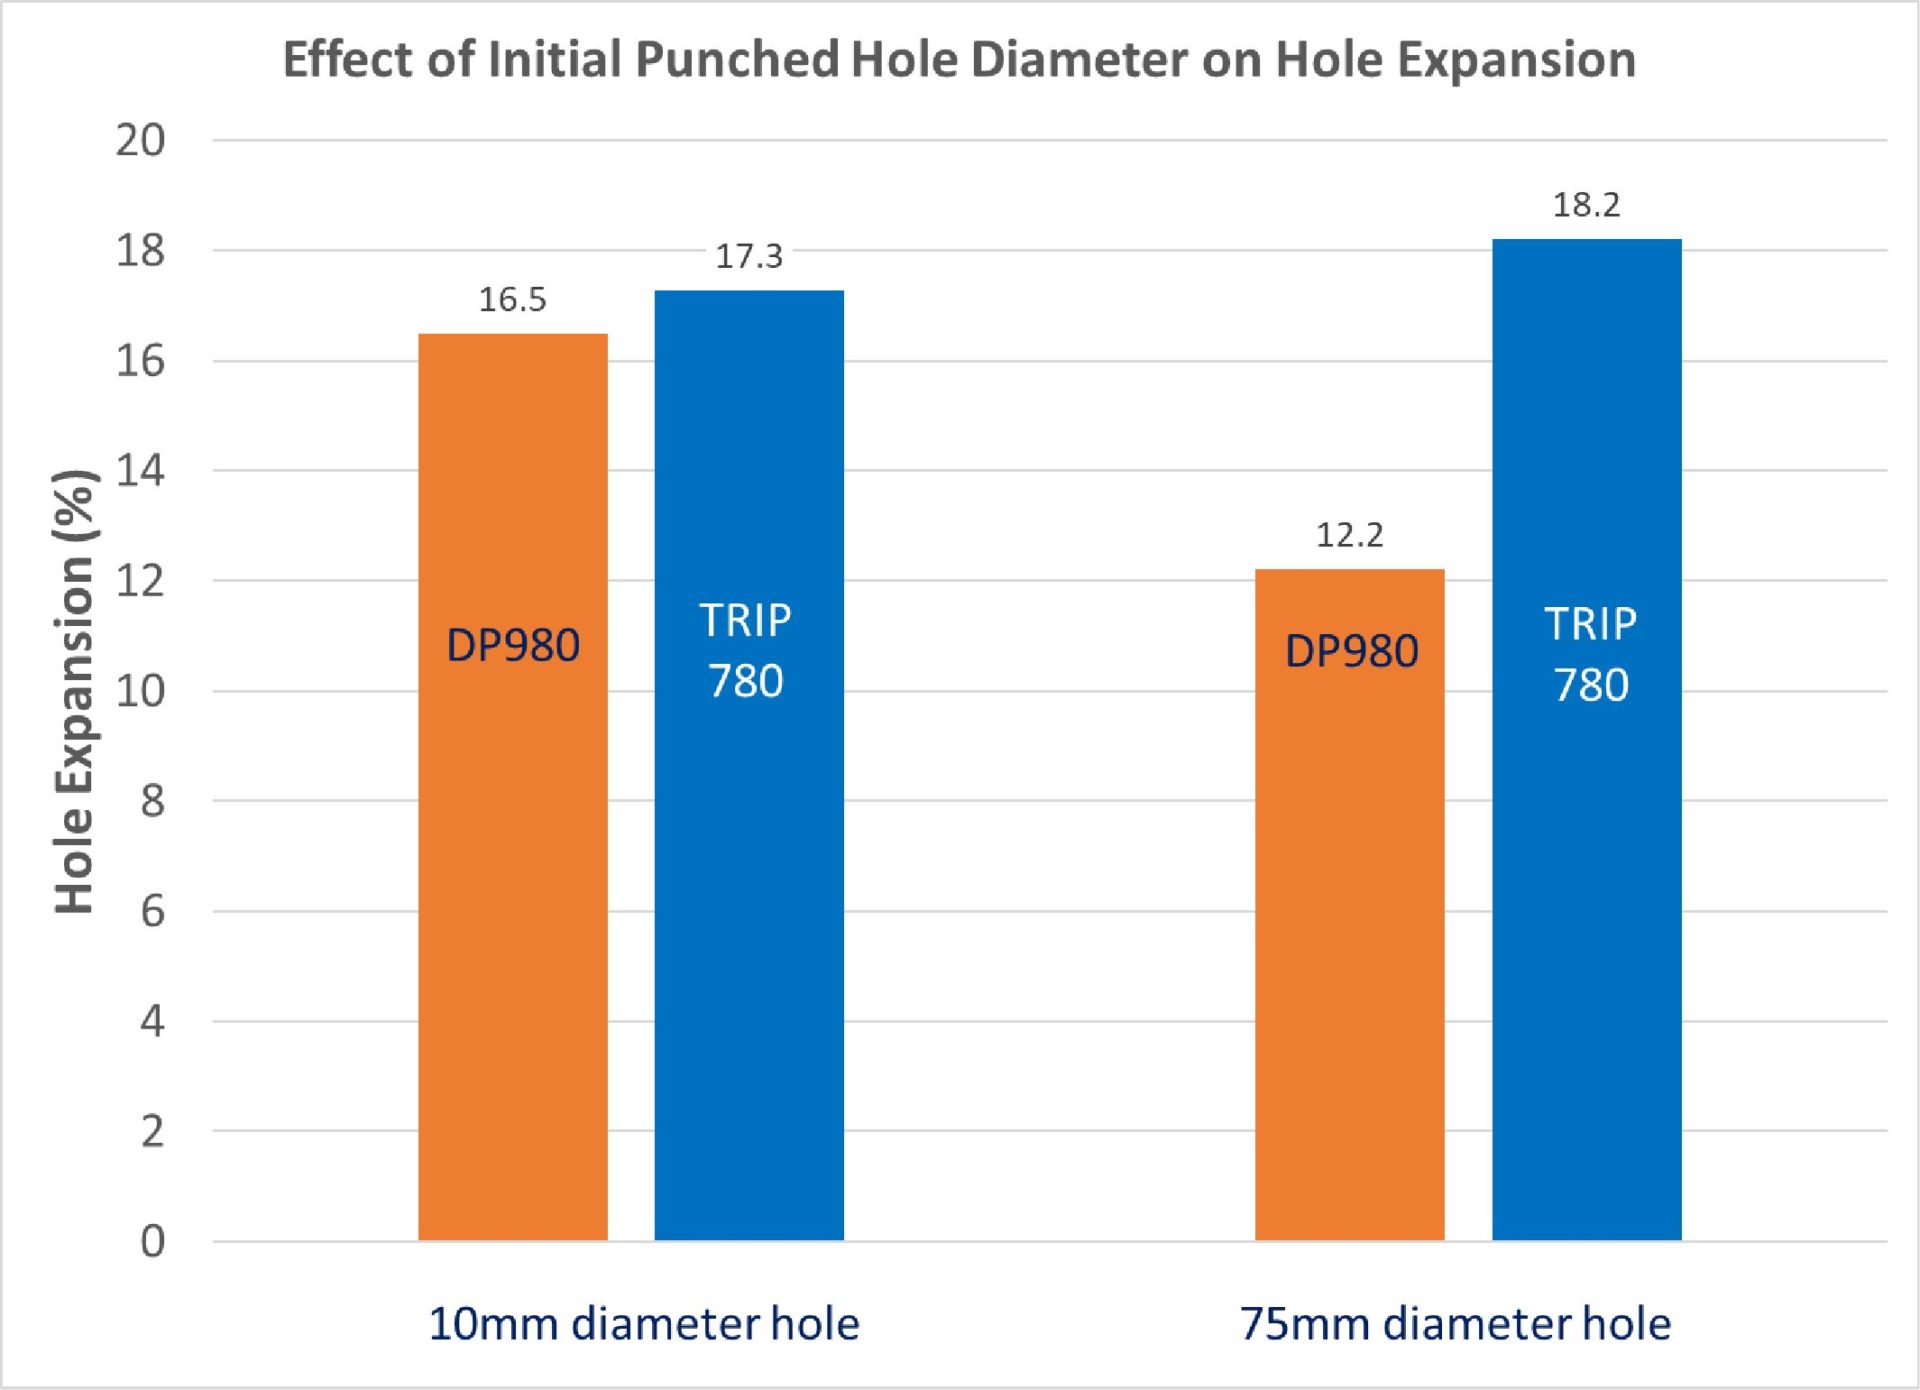
Figure 7: Effect of Initial Punched Hole Diameter on Hole Expansion. (Based on Data from Citation K-11.)
The position of the burr relative to the punch affects performance in a hole expansion test. Detrimental effects of an expanding edge are minimized If the burr is on the punch side. Having the burr on the punch side, rather than the freely expanding side, minimizes the detrimental effects of the expanding edge. The primary reason is the outer surface is in a greater degree of tension than the surface next to the punch.
Figure 8 examines the effect of edge condition and clearance on DP 590 expanded with a conical punch.K-10 The data suggests that there could be up to a 20% increase in sheared edge extension capability just related to the burr position on holes punched with conventional clearances. This should be considered in die processing materials and designs sensitive to edge expansion.
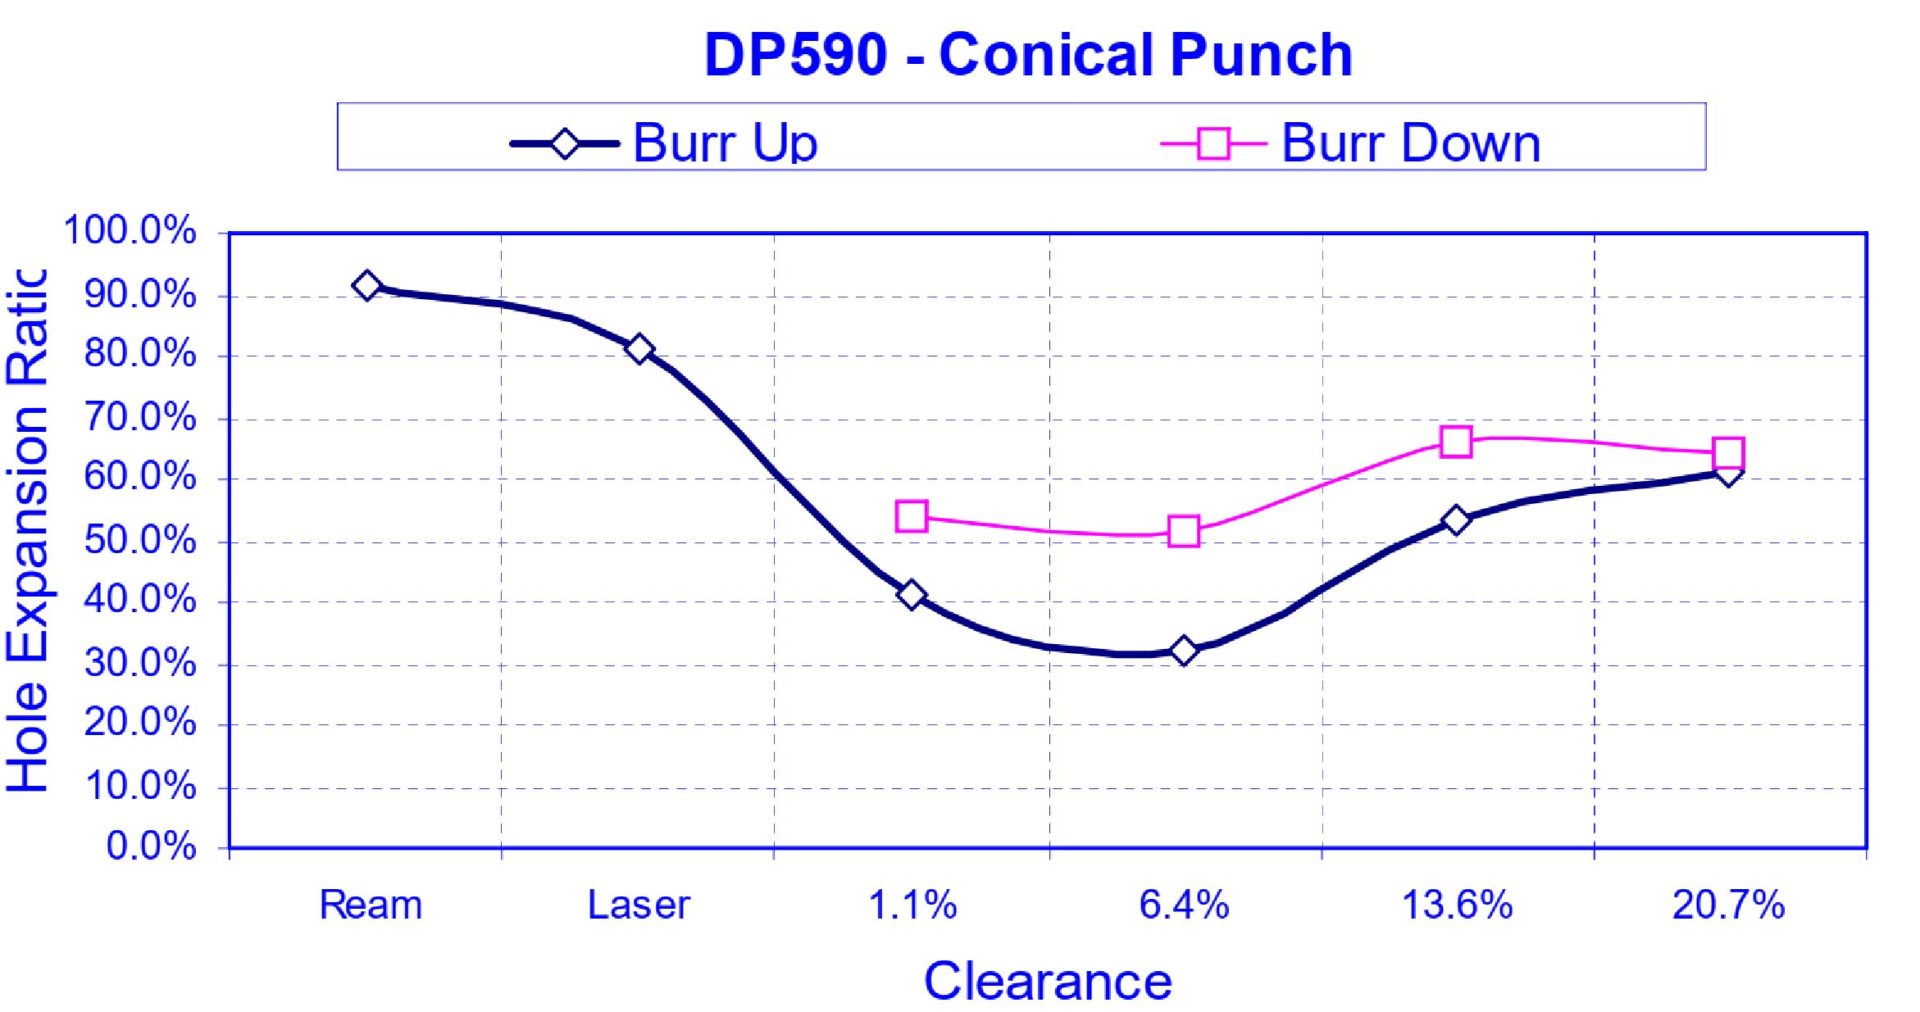
Figure 8: The Effect of Burr Orientation on Hole Expansion as a Function of Clearance on DP590. “Burr Up” means away from the punch; “Burr Down” means in contact with the punch.K-10
Shown in Figure 9 is the influence of burr orientation and material grade.K-10 The 50XK grade shown is HSLA 350Y/450T, where there is a significant improvement in the measured hole expansion related to the position of the burr relative to the punch. The magnitude of this difference decreases as strength increases, but persists for all grades tested.
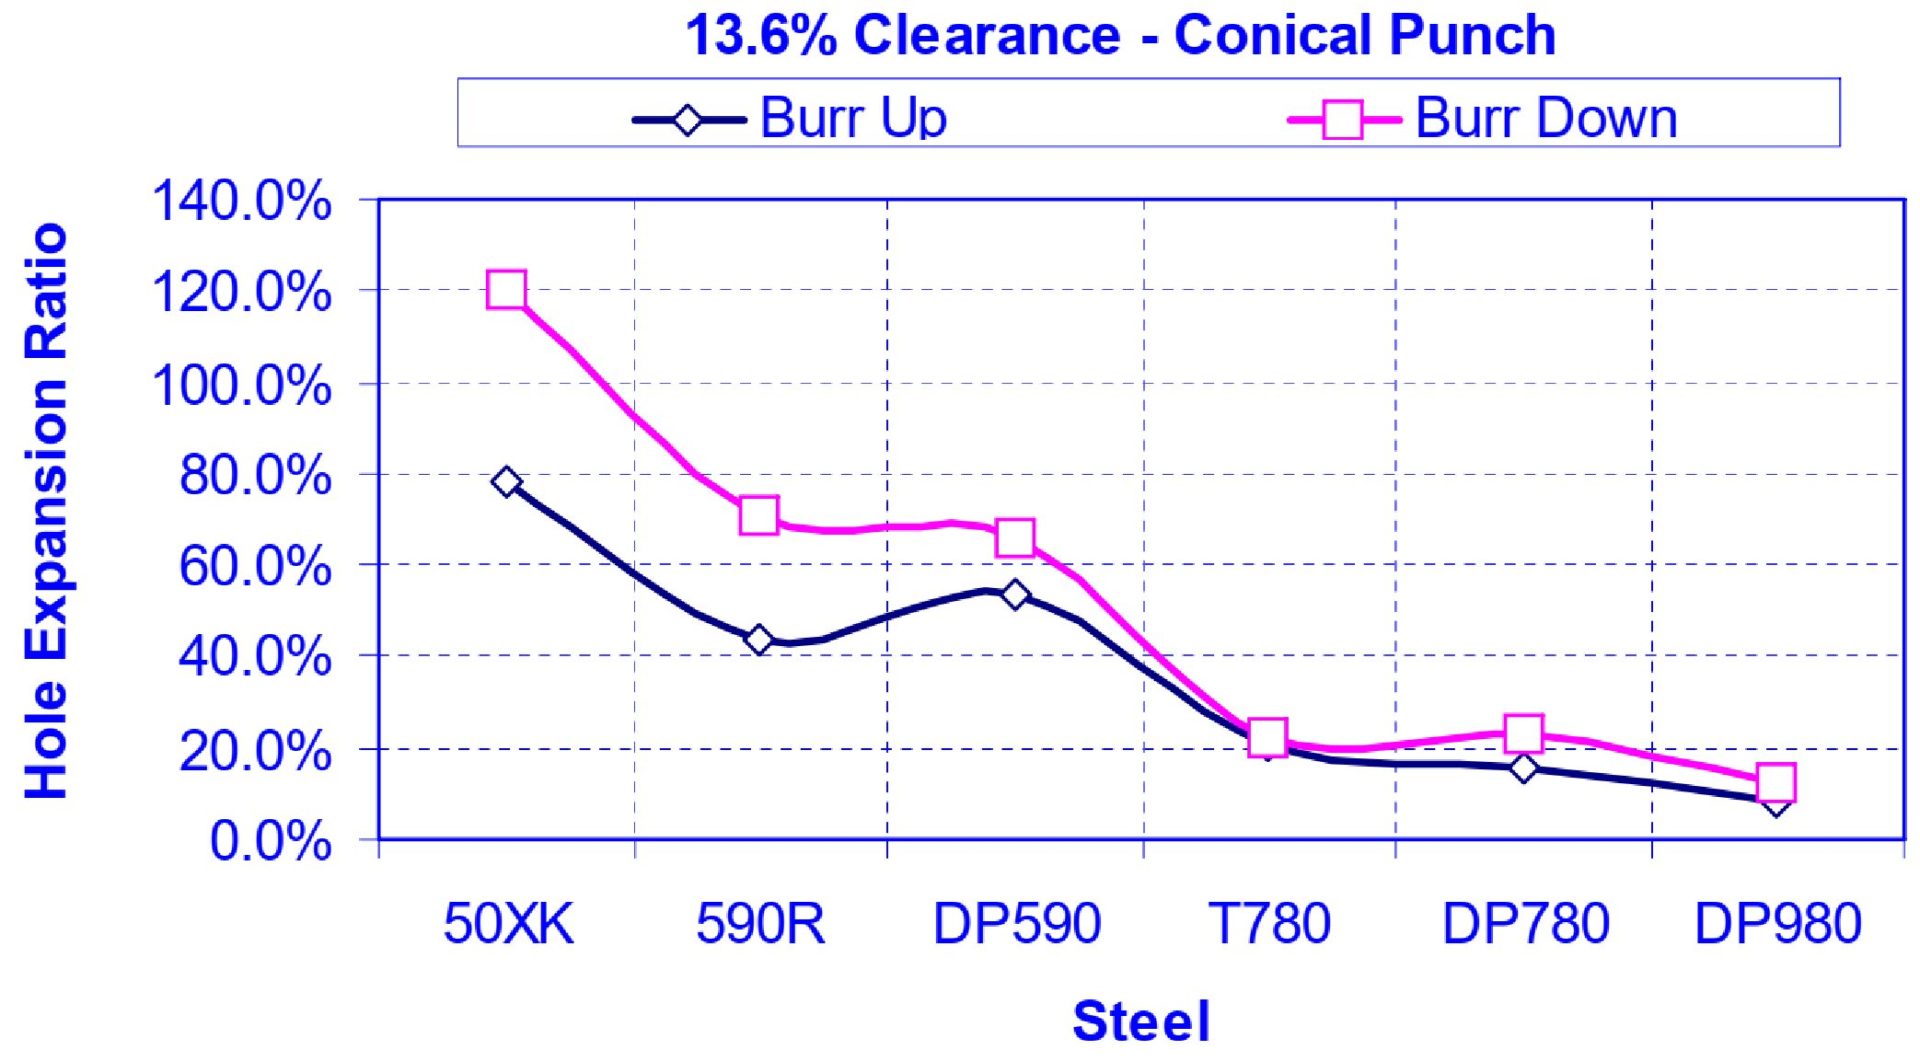
Figure 9: The Effect of Burr Orientation on Hole Expansion as a Function of Different High Strength Steel Grades “Burr Up” means away from the punch; “Burr Down” means in contact with the punch.K-10
The shape of the punch used to expand the hole impacts the degree to which it can be expanded. Figure 10 shows generalizations of the three most-common shapes: a conical punch, a flat punch, and a hemispherical punch.
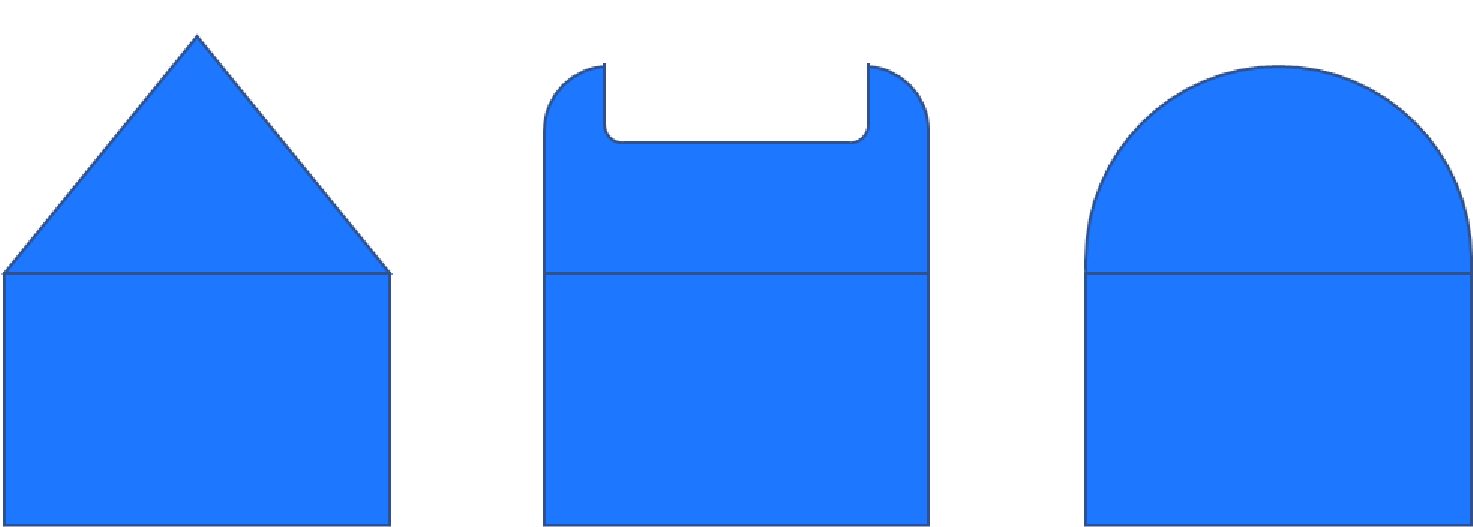
Figure 10: Sketches of Punches Used for Hole Expansion: Conical, Flat, and Hemispherical.
Metal motion and appearance changes depending on the type of punch used. Using a conical punch leads to the shape shown in Figure 11a, with a flat punch leading to the appearance shown in Figure 11b.S-3 The operations are sometimes described as hole expansion when accomplished with a conical punch, and hole extrusion with use of a flat punch.
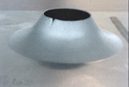
Figure 11a: Sample appearance after testing with conical punch.S-3
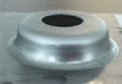
Figure 11b: Sample appearance after testing with flat punch.S-3
The ISO 16630 hole expansion test specifies the use of a conical punch with a 60 degree apex angle. Here, the free edge undergoes stretching and bending. Using a flat punch instead of a conical punch eliminates the bending component, and all deformation is from only edge stretching. These strain state differences lead to different sheared edge extension performance, with greater expansion prior to cracking achieved with holes expanded using a conical punch. This improved performance with conical rather than flat punches has been attributed to the presence of the bending component.N-10 Edge condition does not appear to influence hole expansion capability when a flat bottom punch is used.
Shown in Figures 12 to Figure 15 are the effects of burr orientation and punch type, which vary as a function of metal grade. Figure 16 compares the performance of reamed holes when expanded with either conical or flat punches. Where the tested grades perform similarly when expanded with a flat punch, the conical punch leads to exceptional performance of reamed holes of 3 of the 4 grades. The relatively poor performance of the DP780 grade may be due to the hardness differences between the ferrite and martensite components, noting that there is more martensite in DP780 than DP 600. In the study from which the data was taken, the complex phase steels had a yield/tensile ratio of approximately 87%, while for the dual phase grades the yield/tensile ratio was approximately 60%.P-13
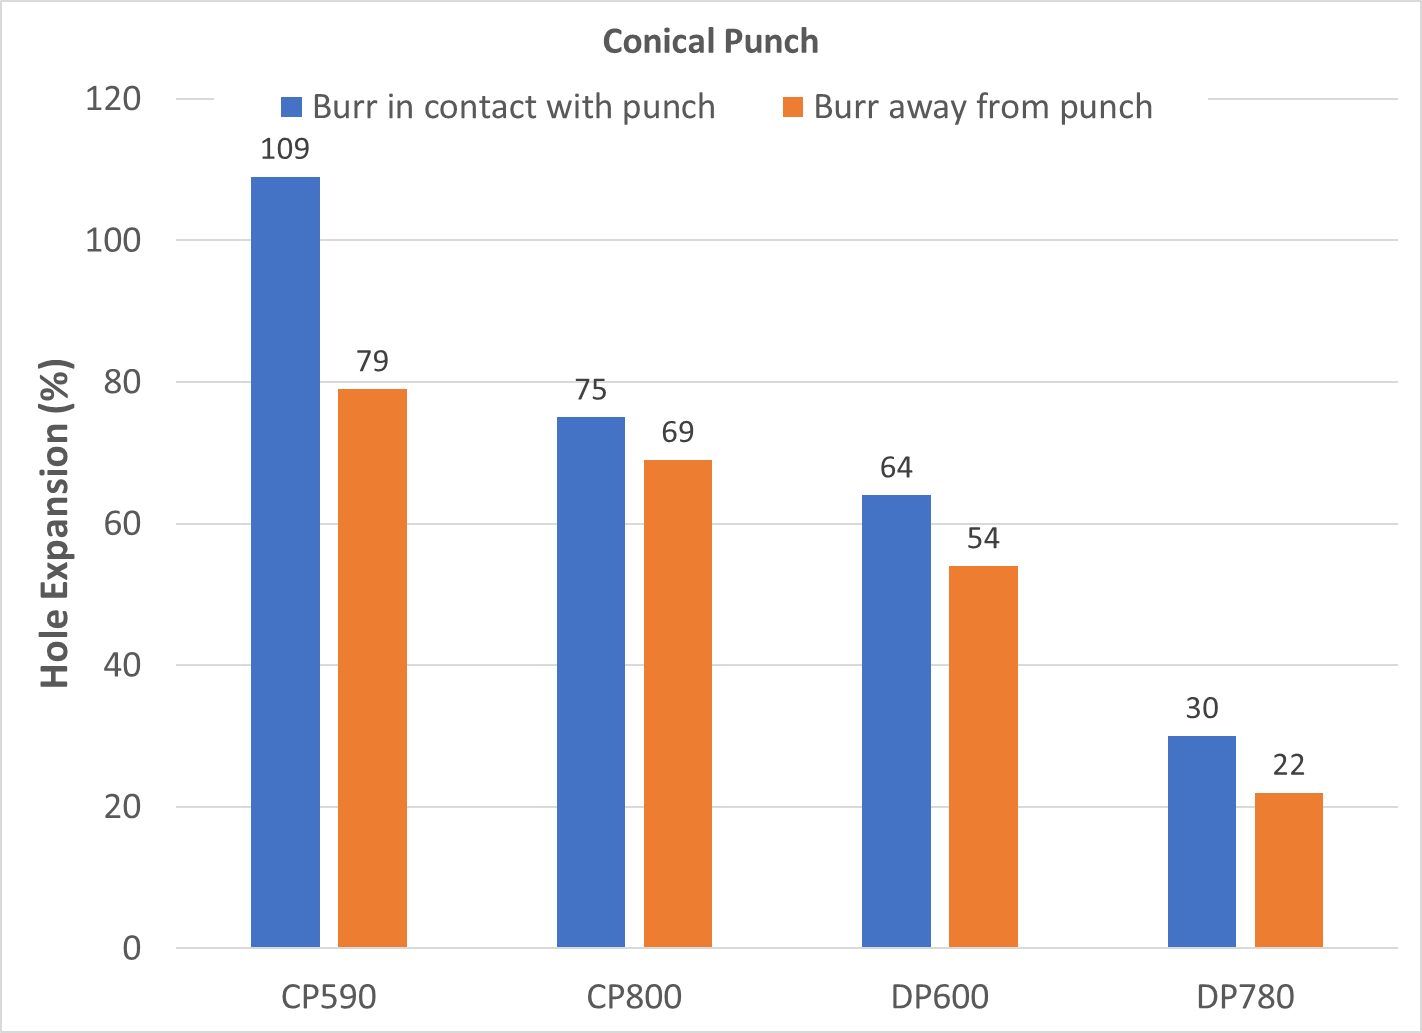
Figure 12: Effect of Burr Orientation on Hole Expansion from a Conical Punch. (Based on Data from Citation P-13.)
![Figure 13: Effect of Burr Orientation on Hole Expansion from a Flat Punch [Based on Data from Reference 11]](https://ahssinsights.org/wp-content/uploads/2020/07/Pasted-into-Hole-Expansion-Testing-Intro-31.jpg)
Figure 13: Effect of Burr Orientation on Hole Expansion from a Flat Punch. (Based on Data from Citation P-13.)
![Figure 14: Effect of Punch Type on Hole Expansion of Sheared Holes with Burr In Contact With The Punch [Based on Data from Reference 11]](https://ahssinsights.org/wp-content/uploads/2020/07/Pasted-into-Hole-Expansion-Testing-Intro-32.jpg)
Figure 14: Effect of Punch Type on Hole Expansion of Sheared Holes with Burr In Contact With The Punch. (Based on Data from Citation P-13.)
![Figure 15: Effect of Punch Type on Hole Expansion of Sheared Holes with Burr Facing Away From The Punch [Based on Data from Reference 11]](https://ahssinsights.org/wp-content/uploads/2020/07/Pasted-into-Hole-Expansion-Testing-Intro-33.jpg)
Figure 15: Effect of Punch Type on Hole Expansion of Sheared Holes with Burr Facing Away From The Punch. (Based on Data from Citation P-13.)
![Figure 16: Effect of Punch Type on Hole Expansion of Reamed Holes [Based on Data from Reference 11]](https://ahssinsights.org/wp-content/uploads/2020/07/Pasted-into-Hole-Expansion-Testing-Intro-34.jpg)
Figure 16: Effect of Punch Type on Hole Expansion of Reamed Holes. (Based on Data from Citation P-13.)
Figure 17 compares the simulation results from expanding a perfect edge (no burr, no strain) with a conical punch on the left and a spherical punch on the right.W-2 The color scale, based on a “damage” parameter, shows that a spherical punch results in a more uniform distribution of damage, especially at the edge. This suggests that the impact of burr orientation on hole expansion is less significant for this punch geometry.
Flanging with a conical punch causes high circumferential strain and high damage values at the outer edge. The inner edge of the sheet initially presses against the punch, and later stretches during flanging. Since cracks initiate at the fracture zone, using a conical punch with the burr facing the punch leads to a greater hole expansion capability than when having the burr in contact with a spherical punch.
Fracture initiates at the edge, and orienting the burr so that it is in contact with the punch leads to a greater hole expansion value.
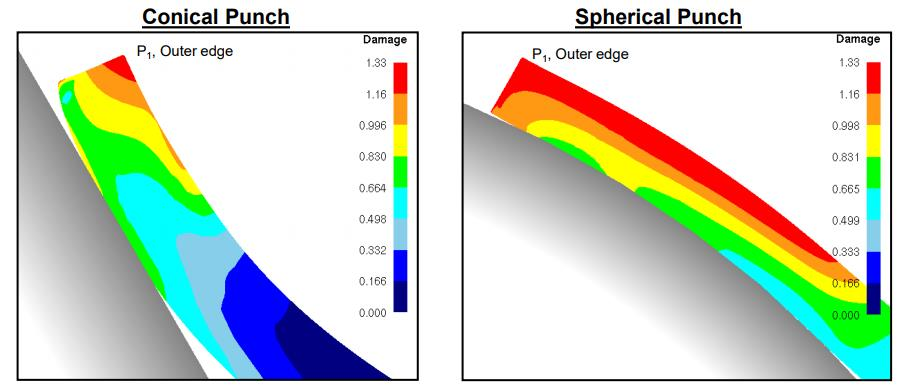
Figure 17: Distribution of damage values in simulated hole expansion tests conducted with a conical punch (left image) and a hemispherical punch (right image).W-2
Improving Hole Expansion with New Punch Shapes
As explained above, the degree to which a sheared edge can be stretched before fracture is a function of many parameters, including the shape of the punch. Also contributing is the hardness uniformity of the microstructural phases, where grades with components having high hardness differences are associated with relatively lower hole expansion capability.
Researchers evaluated the effects of punch design and clearance on hole expansion capability of dual phase and ferrite-bainite steels, each with a tensile strength of approximately 780 MPa.L-47
In addition to a conventional flat punch face, other punch types studied were those with a beveled face, a humped shape, and a newly designed punch which combines the benefits of the prior two types. A chamfered or beveled punch is known to reduce punch forces and reverse snap-through loads, while at the same time improve edge quality and hole expansion by minimizing the hardness increases found in the shear affected zone.
Use of the humped punch (Figure 18) led to hole expansion improvements of up to 10%, compared with a conventional flat punch when testing either the DP or FB products. When comparing the edge characteristics, the humped punch results in an increased rollover zone. The authors attributed this to the hump geometry imposing axial tension on the steel during punching, thereby increasing stress triaxiality. Increases in stress triaxiality results in a reduction in effective stress even at the same average stress. This in turn lowers the plastic deformation at the sheared edge which minimizes edge fracture. For these reasons, the increases in stress triaxiality associated with the humped punch promotes higher levels of hole expansion.
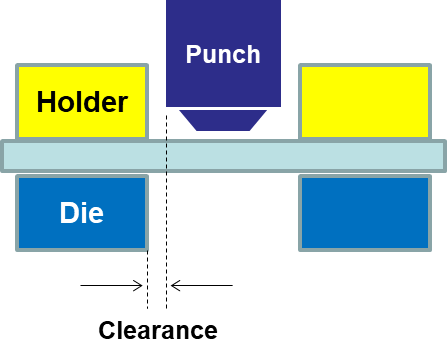
Figure 18: Humped punch design used in Citation L-47.
A newly designed punch which combines a beveled and humped design (Figure 19) increases hole expansion by more than 30% in both dual phase and ferrite-bainite steels (Figure 20). As explained above, the newly designed punch is effective in promoting stress triaxiality and minimizing the plastic deformation near the sheared edge. Furthermore, the beveled design improves the shear affected zone (SAZ) characteristics, leading to improved sheared edge expandability as measured in a hole expansion test.
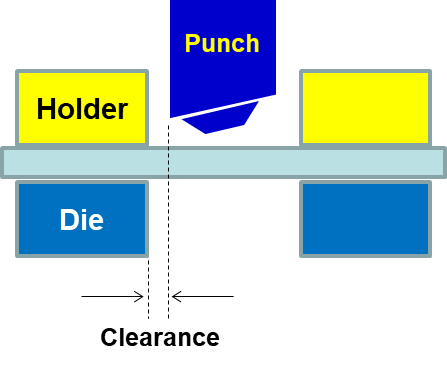
Figure 19: New punch design incorporating features of beveled and humped punches.L-47
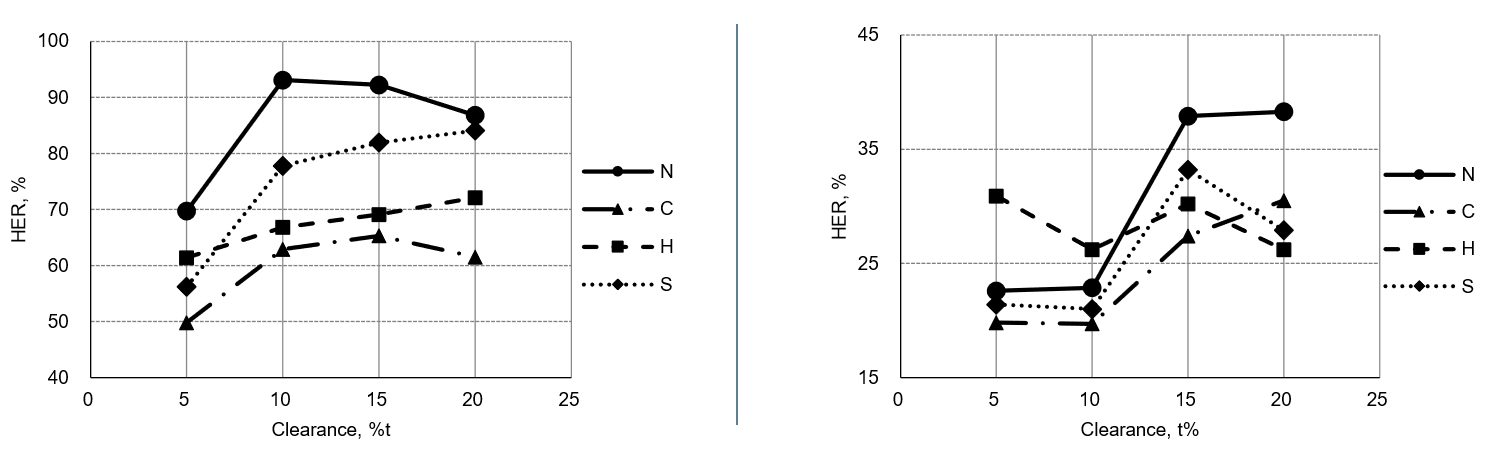
Figure 20: Effect of punch type and clearance on the hole expansion ratio of 780 MPa tensile strength steels. Left graph represents ferrite-bainite steel; right graph represents a dual phase steel. Legend: N=new punch design; C=conventional; H=humped; S=shear (beveled).L-47
Correlation of Hole Expansion Ratio with Tensile Properties
The complexities of hole expansion testing, as well as relatively few laboratories with the necessary test equipment and expertise, have led researchers to look for a correlation between the hole expansion ratio and conventionally measured properties obtained from a tensile test like the yield and tensile strength, uniform and total elongation, n-value, and r-value. Researchers even studied manipulations such as the yield-to-tensile ratio, tensile strength multiplied by uniform elongation, and n-value multiplied by r-value. Unfortunately, none of these properties or combinations have suitable correlation with the hole expansion ratio.
Recent work has shown a promising correlation between the hole expansion ratio and the true thinning strain at fracture. Our article on true fracture strain, describes this in greater detail.
![Springback]()
Forming, Springback
Decades ago, the major concern in sheet metal forming was elimination of necks and tears. These forming problems are a function of plastic strain, and addressing them involves maintaining strain levels in the part below specific critical strains. Forming limit diagrams, which combine the formability of the steel with the part shape and forming process, show where these critical areas fall out on the part. In-service structural requirements may result in additional limitations on allowable strains, since fatigue and durability issues may arise if too much thinning during forming occurs.
With the advances in simulation technology to predict the location of potential problems and address them before tool construction begins, the primary emphasis has shifted to accuracy and consistency of product dimensions. These dimensional problems are a function of the elastic stresses created during the forming of the part and the relief of these stresses, or lack thereof, during the unloading of part after each forming operation.
These dimensional problems or springback have always existed in sheet metal forming. However, the magnitude of springback increases as the yield strength of the steel increases. As Advanced High-Strength Steels (AHSS) usage expands due to the combination of higher strength and ductility (for enhanced formability characteristics), countering springback relative to final part dimension becomes critical. First, the design of many of the panels results in higher flow stresses, which are the combination of yield strength and work hardening during deformation. This creates higher elastic stresses in the part. Second, applying AHSS for weight reduction also requires the application of thinner sheet metal that is less capable of maintaining part shape. Third, until recently, most companies had little prior experience applying springback management procedures to their parts made from AHSS. Companies have attacked springback problems with proprietary in-house compensation procedures developed over years of trial and error in the production of various parts. An example would be specific over-crowning of a hood panel or over-bending a simple channel to allow the parts to springback to part print dimensions.
For a given part shape and sheet thickness, the springback occurring when using AHSS grades is greater than that experienced in mild or conventional HSLA steels. The magnitude of springback is a function of the as-formed flow stress, which is the strength of the sheet metal after forming. The as-formed flow stress is a function of the starting yield strength in the flat sheet as well as the work hardening which occurs from forming. Both of these are higher in AHSS grades compared with mild or conventional HSLA steels, and is the basis for the increased springback seen with AHSS.
Figure 1 shows an example of this difference, where two channels of different grades were formed sequentially in a draw die with a pad on the post. The draw die was developed to attain part print dimensions with HSLA 350/450 steel. Strain distributions and lengths of line were nearly identical between the two parts. However, steel property differences between DP and HSLA steels led to different stress distributions, resulting in different dimensional accuracy.
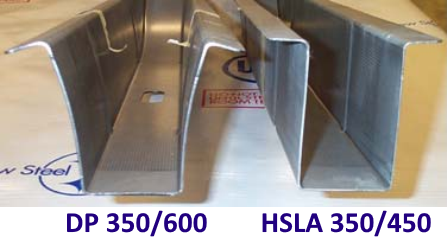
Figure 1: Two channels made sequentially in the same die, with different mechanical properties leading to different springback.
Origins of Springback
The shape of a formed part in its free unconstrained state always deviates somewhat from the shape of punch and die after removal from the tooling. This dimensional deviation between the constrained shape within the tools under full load and after elastic recovery occurs after removing the part from the tool is known as springback.
Stress-strain curves can illustrate how springback changes with material, yield strength, and work hardening. In addition to a tensile test, a stress-strain curve also shows the response of sheet metal as press load is applied to convert it from a flat blank to a formed part.
The blank starts off at the point labeled O in Figure 2, which is the origin with zero stress and zero strain. With a little loading, there is a linear stress-strain response. All deformation here is elastic, meaning that the blank will remain flat after removing the load. All deformation returns to zero providing the applied load stays below the yield strength. Once the yield strength is reached, plastic deformation begins, and the part begins to take shape. Work hardening takes over, with strength increasing as the strain in the part increases. The strength at any given strain is known as the flow stress at that strain.
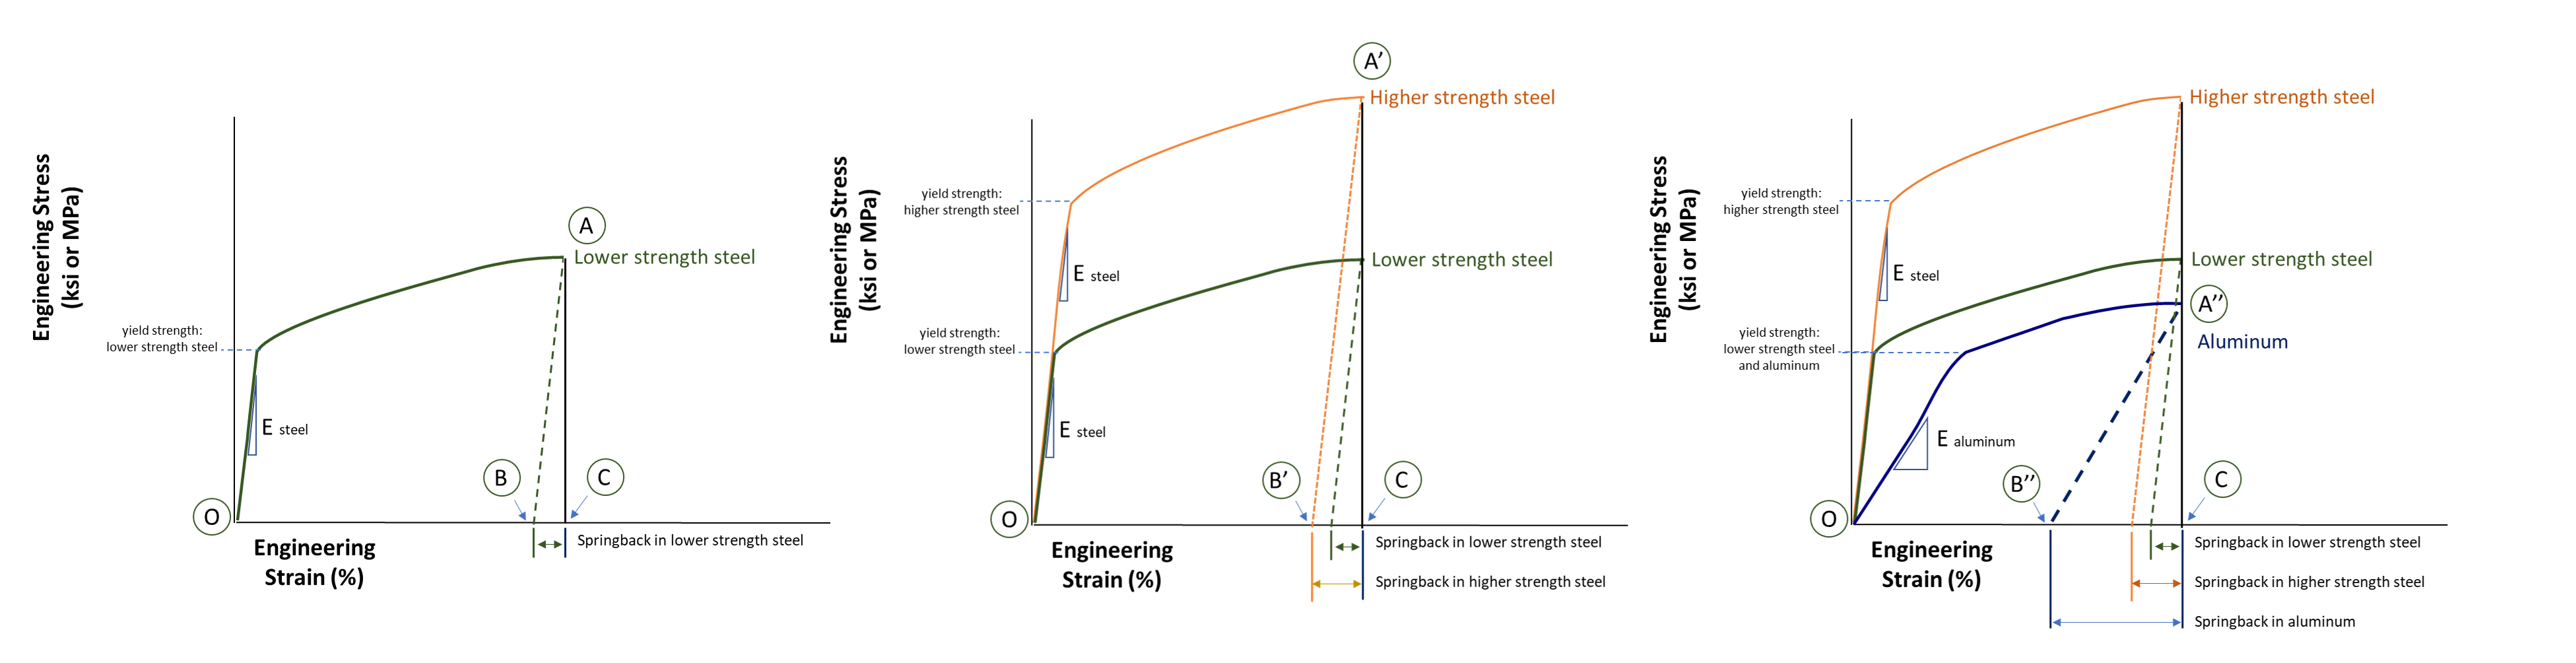
Figure 2: The magnitude of springback is proportional to the elastic modulus, yield strength and work hardening of the sheet metal, in addition to the part design.E-2
Refer to the left image in Figure 2. Achieving the desired part shape work hardens the part to strength A, occurring at Bottom Dead Center of the press stroke, and resulting in strain C. Removing the part from the constraints of the die under load allows the strains to relax to strain B, relieving the elastic strains. Note how the relaxation follows a path parallel to the initial linear portion of the stress strain curve. The magnitude of BC is a representation of the springback of that part formed to the targeted shape in that location from the selected sheet metal.
Compare that against a steel with higher yield strength and higher work hardening, shown in central image of Figure 2. Achieving the part shape work hardens this steel to strength A’, also reaching strain C since the part shape did not change. After removing this part from the tool, it is free to move to its unconstrained shape. Again, the relaxation follows a path parallel to the initial linear portion. In this case, the strains relax to strain B’. The higher yield strength and work hardening leads to B’C > BC, or a greater amount of springback.
The slope of the initial linear portion of stress-strain curves is known as Young’s Modulus, the Elastic Modulus, or the Modulus of Elasticity. For all steel grades, it is essentially constant at approximately 210 GPa, which is why the slope of that initial section is the same in the left and center images of Figure 2. However, the Elastic Modulus of automotive aluminum alloys is approximately 70 GPa, or ⅓ that of steel. The effect on the stress-strain curve is that the slope of the initial portion decreases by ⅓. This difference in modulus results in aluminum alloys having three times the springback of a similar strength steel, as shown by B’’C in the right image of Figure 2. If higher strength aluminum alloys capable of forming the chosen design exists, springback will be even greater in these parts without making other changes to the product and process.
Although the recovered elastic strains at a given location are relatively small relative to plastic strains in formed parts (on the order of 0.01 % elastic vs. 10 % plastic), they can cause significant shape changes due to its mechanical multiplying effect on other locations when bending deformation and/or curved surfaces are involved. Free edges lack the constraints of the central portion of panels, and therefore are most likely at risk for dimensional issues.
The tooling and component geometry also influence the magnitude of springback. When part geometry prevents complete unloading (relaxing) of the elastic stresses, residual stresses is the term for the constrained elastic stresses remaining in the part. The part takes whatever shape it can to minimize the total remaining residual stresses, either through twisting, bending, or other metal motion. Door panels present an example. The panel coming out of the draw die may have the desired dimensions, but challenges may arise after punching the window cutout and other access holes.
Methods for correcting springback are described here.
Types of Springback
Three modes of springback commonly found in channels and underbody components are angular change, sidewall curl, and twist.
Angular Change
Angular change, or springback, is the angle created when the bending edge line (the part) deviates from the line of the tool. The springback angle is measured as the deviation from the punch radius (Figure 3). If there is no sidewall curl, the angle is constant up the wall of the channel.
Angular change results from the stress difference in the sheet thickness direction when the sheet metal bends over a radius during forming. This stress difference in the sheet thickness direction creates a bending moment at the bending radius. Eliminating or minimizing the angular change requires elimination or minimization of this bending moment.
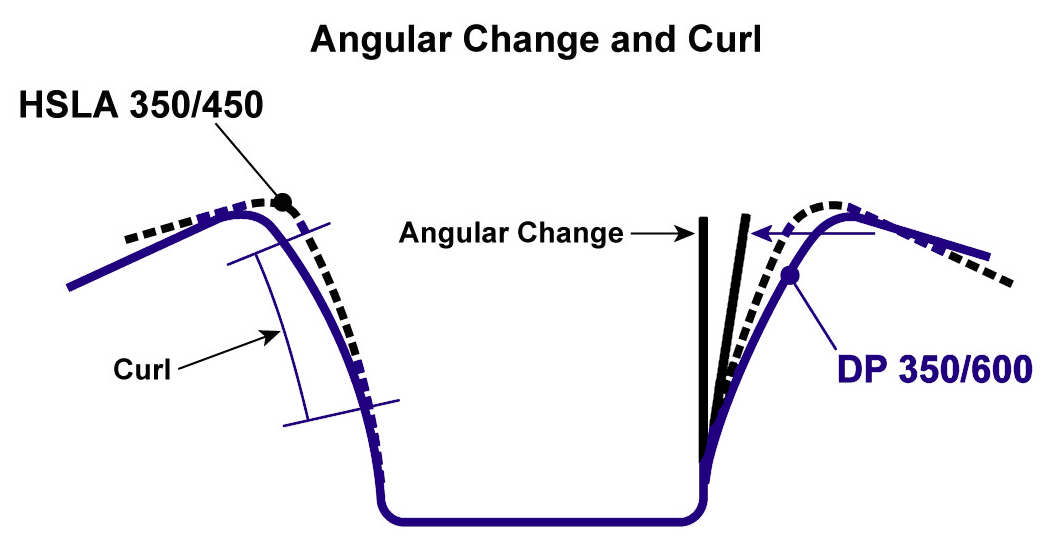
Figure 3: Schematic showing difference between angular change and sidewall curl.
Sidewall Curl
Sidewall curl is the curvature created in the side wall of a channel (Figures 1 and 3). This curvature occurs when a sheet of metal is drawn over a die/punch radius or through a draw bead. The primary cause of this curl is an uneven stress distribution or stress gradient through the thickness of the sheet metal generated during the bending and unbending process.
During the bending and unbending sequence, the deformation histories for both sides of the sheet are unlikely to be identical due to the differing degrees of tension and compression on each surface. This usually manifests itself by flaring of the flanges, which is an important area for joining to other parts. The resulting sidewall curl can cause assembly difficulties for rail or channel sections that require tight tolerance of mating faces during assembly. In the extreme, a gap resulting from the sidewall curl can be so large that welding is not possible.
Figure 4 illustrates in detail what happens when drawing a sheet metal over the die radius. This bending-unbending process on side A changes from tension (A1) during bending to compression (A2) during unbending. In contrast, the deformation on side B changes from compression (B1) to tension (B2) during bending and unbending. As the sheet enters the sidewall, side A is in compression and side B is in tension, although both sides may have similar amounts of strain. Once the punch is removed from the die cavity (unloading), side A tends to elongate and side B to contract due to the elastic recovery causing a curl in the sidewall.
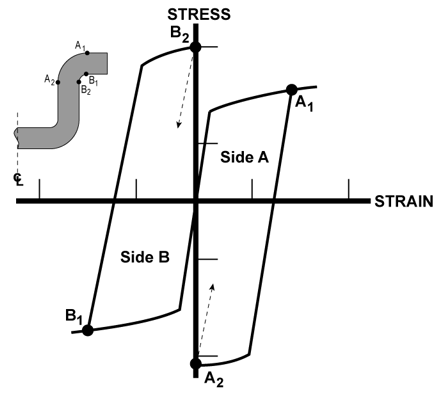
Figure 4: Origin and mechanism of sidewall curl.
The main source of variation in sidewall curl along the wall comes from the difference in elastic recovery on sides A and B. The higher the strength of the deformed metal, the greater the magnitude and difference in elastic recovery between sides A and B and the associated increase in sidewall curl. The strength of the deformed metal depends not only on the as-received yield strength, but also on the work hardening capacity. This is one of the key differences between conventional HSLA and AHSS. Minimizing the sidewall curl requires minimizing the stress gradient through the sheet thickness.
Strain hardening differences between conventional HSLA and AHSS explain how the relationship between angular change and sidewall curl can alter part behavior. Figure 5 shows the crossover of the true stress – true strain curves when comparing two steels of equal tensile strengths, noting the AHSS grade has a lower yield strength than the conventional HSLA grade.
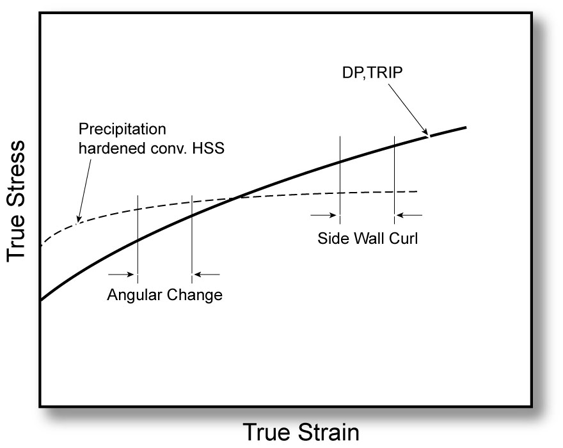
Figure 5: Schematic description of the effect of hardening properties on springback.K-4
At the lower strain levels usually encountered in angular change at the punch radius, AHSS grades have a lower level of stress and therefore less springback. The predominant trend is increasing angular change for increasing steel strength, as shown in Figure 6, which highlights a nearly linear relationship between tensile strength and angular change.
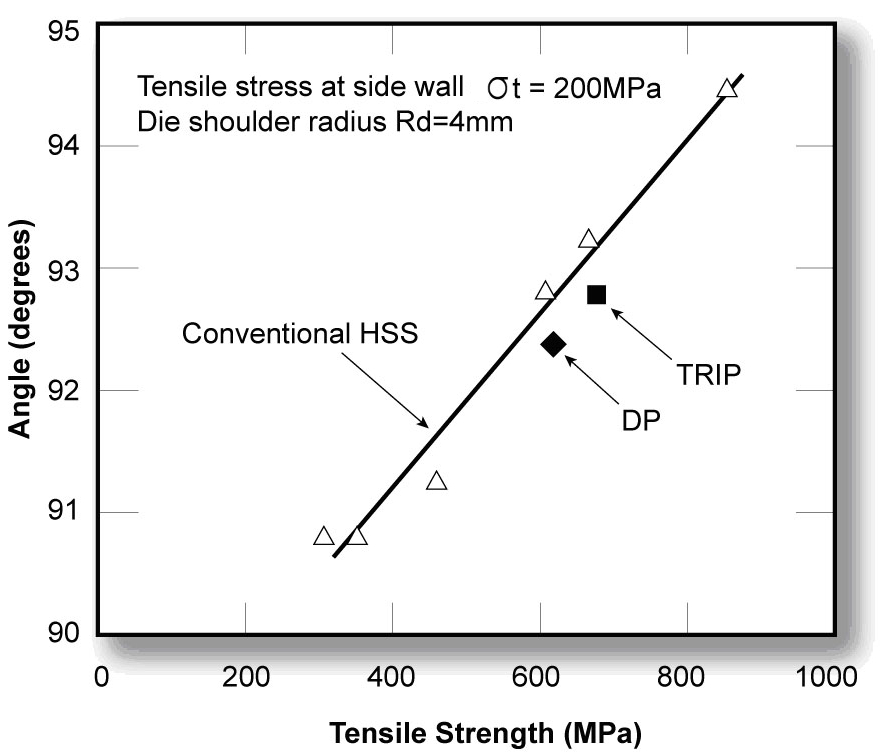
Figure 6: Angular change increases with tensile strength.K-4
Sidewall curl is a higher strain event because of the bending and unbending of the steel going over the die radius and any draw beads. For the portions of the two stress–strain curves shown in Figure 5, the AHSS grade now is at a higher stress level with increased elastic stresses. Therefore, the sidewall curl is greater for the AHSS grade, as indicated in Figure 7.
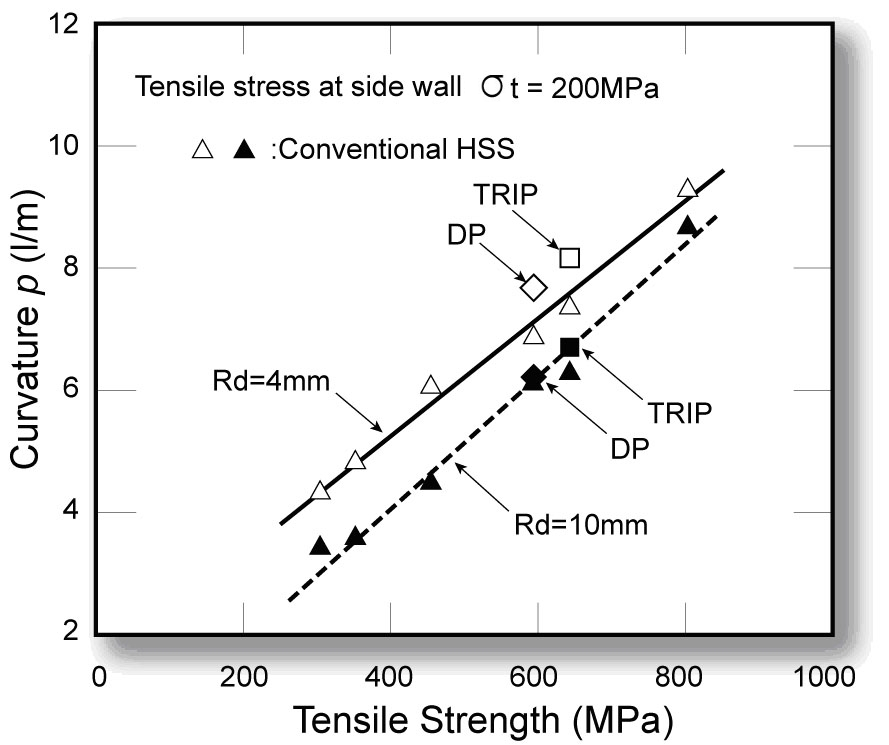
Figure 7: Sidewall curl increases with tensile strength.N-2
Remember that AHSS grades have lower yield strength at a given tensile strength. If Figure 5 compared instead a conventional high strength steel grade and an AHSS grade at the same yield strength rather than the same tensile strength, the stress strain curve for the AHSS grade would plot above that for the conventional HSLA grade. In this comparison, the AHSS channel will have greater springback for both angular change and sidewall curl compared to the HSLA channel, and would appear similar to Figure 1.
These phenomena are dependent on many factors, such as part geometry, tooling design, process parameter, lubrication, and material properties. However, higher work-hardening of DP and TRIP steels causes greater increases in the strength of the deformed steel for the same amount of strain.
Any differences in tool build, die and press deflection, location of pressure pins, and other inputs to the stamping can cause varying amounts of springback – even for what should be completely symmetrical parts.
Twist
Twist occurs when two cross sections within the same part rotate differently along their axis, and results from torsion moments in the cross section of the part. The torsional displacement (twist) develops because of unbalanced springback and residual stresses acting in the part to create a force couple, which tends to rotate one end of the part relative to another. As indicated in Figure 8, the torsional moment can come from the in-plane residual stresses in the flange, the sidewall, or both.
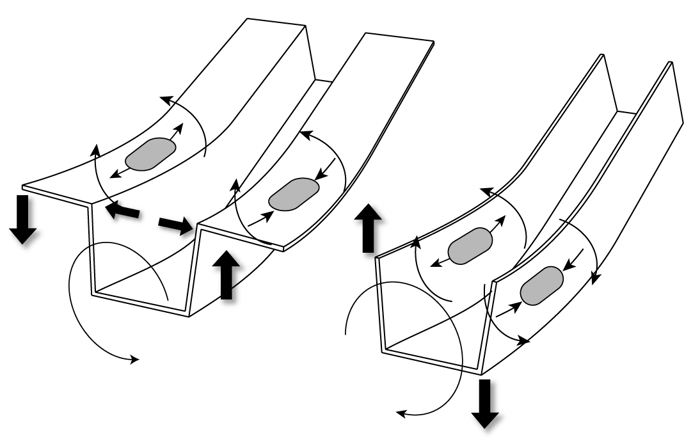
Figure 8: Torsion Moment created flange or sidewall residual stresses.Y-2
The actual magnitude of twist in a part is determined by the relationship between unbalanced stresses on the part and the stiffness of the part in the direction of the twist. Low torsional stiffness values in long, thin parts are the reason high aspect ratio parts have significantly higher tendencies to twist. There is also a lever effect, whereby the same amount of twist will result in a larger displacement in a long part than would be the case in a shorter part with a similar twist angle. Twisting is more prone to occur in a thin sheet metal component with large differences in sectional dimensions, such as rails and shallow panels with nearly flat surfaces.
Overcoming the tendency for parts to twist requires reducing the imbalance in the residual stresses forming the force couple that creates the torsional movement. Unbalanced forces are more likely in unsymmetrical parts, parts with wide flanges or high sidewalls, and in parts with sudden changes in cross section. Parts with unequal flange lengths or non-symmetric cut outs are susceptible to twist due to unbalanced springback forces generated by these non-symmetrical features.
Even in geometrically symmetrical parts, unbalanced forces can be generated if the strain gradients in the parts are non-symmetrical. Some common causes of non-symmetrical strains in symmetrical parts are improper blank placement, uneven lubrication, uneven die polishing, uneven blankholder pressure, misaligned presses, or broken/worn draw beads. These problems will result in uneven material draw-in with higher strains and higher elastic recoveries on one side of the part compared to the other, thereby generating a force couple and inducing twist.
Twist can also be controlled by maximizing the torsional stiffness of the part – by adding ribs or other geometrical stiffeners or by redesigning or combining parts to avoid long, thin sections that will have limited torsional stiffness. Minimize twisting potential by:
- Avoiding sudden changes of cross section shape.
- Equalizing the forming depth where possible.
- Optimizing the blank shape to balance deformation.
- Minimizing the flange length normal to the part.
- Incorporating geometric stiffeners like beads or additional flanges.
- Modifying the trim process and sequence to balance stresses.
Global Shape Change
Global shape changes, such as reduced curvature when unloading Class-A surface panel in the die, are usually corrected by the springback management measures described below. The key problem is minimizing springback variation during the run of the part and during die transition. One study showed that the greatest global shape (dimensional) changes initiated from inconsistent die setting practices.A-40
Surface Disturbances
Surface disturbances on Class-A surface panels develop from the reaction to local residual stress patterns within the body of the part. Common examples are high and low spots, oil canning, and other local deformations that form to balance total residual stresses to their lowest value.
Case Study in Springback PredictionO-4
Accurately modeling springback requires knowledge of the yield strength and the hardening behavior during the non-linear strain path followed by each element of the part as the flat blank deforms to the final shape. Part of the challenge stems from the bending-unbending sequence as the sheet metal passes over beads and die radii, leading to what is known as the Bauschinger effect. The Bauschinger effect causes the yield strength to decrease each time the sheet undergoes the tension-compression associated with each bend-unbend, explained graphically in Figure 9.
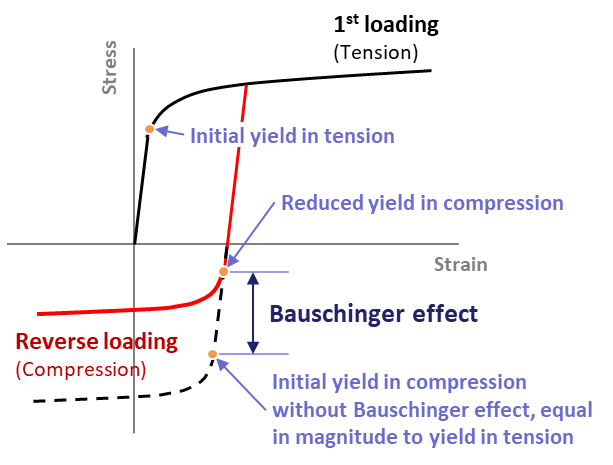
Figure 9: Graphical explanation of Bauschinger Effect.
In addition to the reduced yield strength from each bend-unbend, the Chord Modulus also decreases each time due to dislocation density evolution, which increases very quickly at the beginning of the plastic deformation. This reduction can be as much as 20% from the value determined in the as-produced steel, as shown in Figure 10.
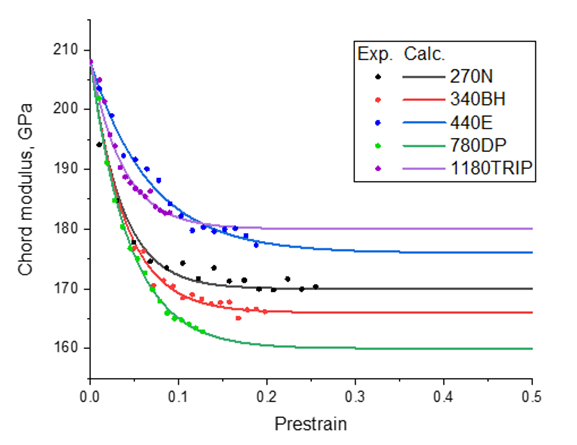
Figure 10: Chord Modulus decreases after bending-unbending.
The basic mechanism of the Bauschinger Effect is related to the dislocation restructuring during nonlinear deformation, which means it is a function of the steel grade, part shape, and forming process design. These variables make it impossible to have one generic interpretation applicable for all grades and parts. Instead, detailed testing is needed for accurate application of the information.
Modeling these effects accurately is critical in achieving satisfactory springback predictions. A basic isotropic hardening model is insufficient for most stampings, since it assumes that strength is the same in tension and compression – in other words, that there is no Bauschinger Effect. This approach is certainly simpler, but cannot predict springback since it does not reflect physical reality.
Kinematic hardening models, such as the Yoshida‐Uemori (YU) model, do account for the Bauschinger Effect, but this type of model is best applied in linear sections where there is a simple reversal in strain path.Y-7,Y-8
However, many challenging parts have stretch flange sections and curved walls, like seen in the B-Pillar of Figure 11. In this figure, using the YU model for the areas in green leads to inaccuracies due to the multi-directional metal flow.
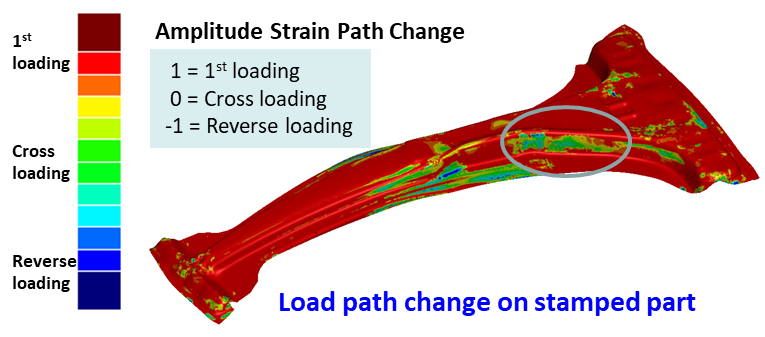
Figure 11: Using the YU model for the cross loading seen in circled area leads to inaccurate springback predictions.
To account for this cross-loading seen in curved walls, a Homogeneous Anisotropic Hardening (HAH) model was developed.B-10, L-19 Although the specific details of these models are beyond the scope of this article, the yield surface of the YU model consists of three surfaces translated dependently, where instead the yield surface of the HAH model is homogeneous and distorted.
The models were benchmarked against S-Rail test samples made from 1.4mm thick martensitic steel with a tensile strength of 1500 MPa, indicated in Figure 12.
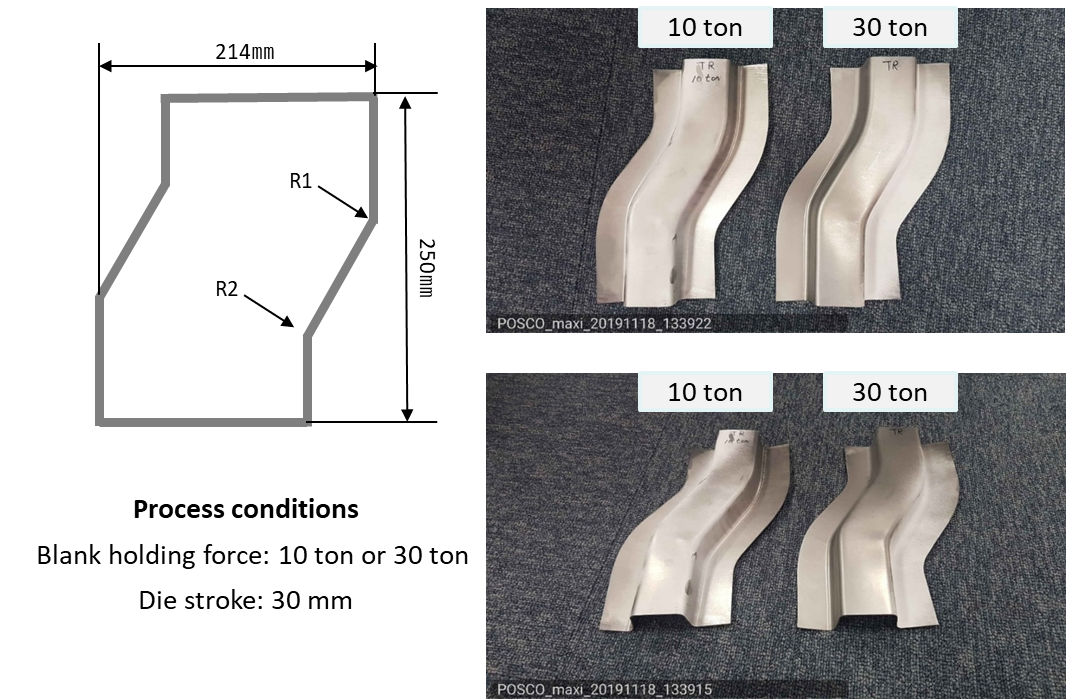
Figure 12: Benchmarked samples made from 1.4 mm martensitic steel with 1500MPa tensile strength.
Material parameters for the YU model and the HAH model were identified and optimized with tension-compression-tension experiments. As shown in Figure 13, the HAH Model provided a better dimensional match to the physical samples.
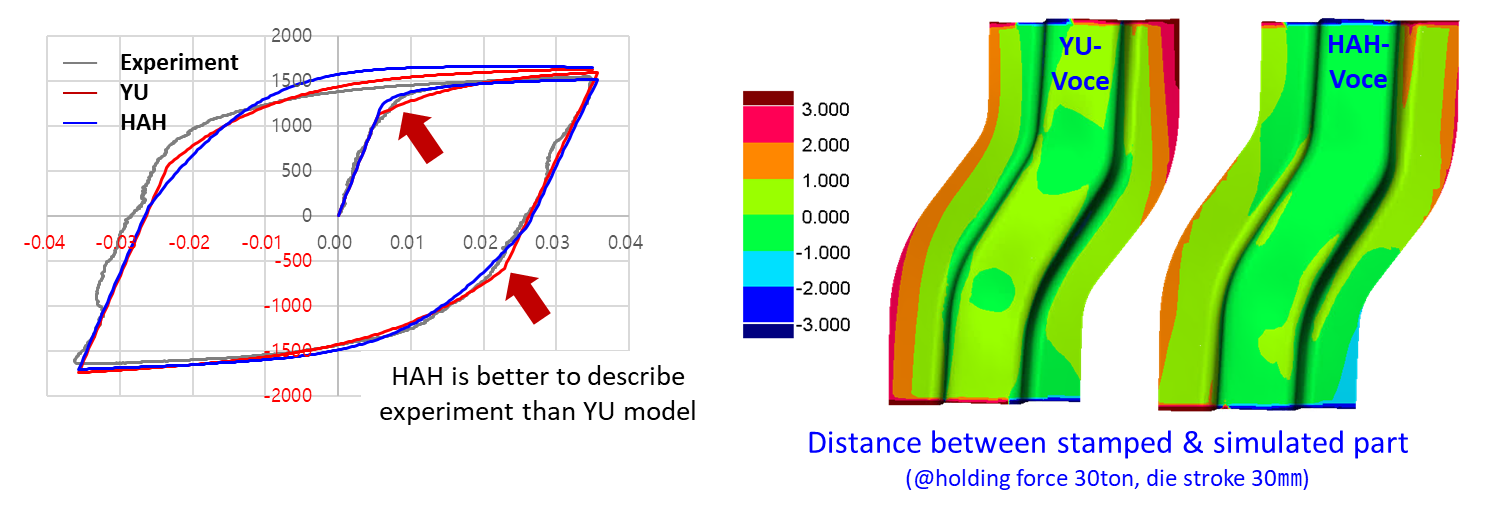
Figure 13: Homogeneous Anisotropic Hardening (HAH) model matches physical test samples better than the YU model.
Key Points
The potential for springback (angular change, sidewall curl, and twist) increases as the flow stress (the strength after forming) increases. AHSS parts are at greater risk of springback, since parts made from AHSS have high flow stresses arising from their higher strength as produced at the steel mill combined with higher work hardening characteristics compared with conventional HSLA grades.
Sharp bend radii, tight die clearance, and higher binder pressure minimize springback and springback variation. However, formability characteristics of AHSS grades make simultaneously achieving these design features more challenging. Press capability must be sufficient to apply the higher binder pressure, and well as satisfying the necessary forming load and energy requirements.
Drawing or stretching over a radius increases springback. A forming die with an upper pad minimizes drawing over a radius in channel shaped parts, but the risk of sidewall curl exists. When draw forming, ensure sufficient restraining force in the binder with the use of higher blank holding force or draw/lock beads which increase sidewall tension. Stretch-forming produces a stiffer panel with less springback than drawing.
Asymmetric parts and part design promote the conditions for a part to twist by increasing the torsion moment associated with the residual stress in the flange and sidewall. Twisting potential increases with AHSS grades.
Achieving dimensional precision may require multiple stage forming processes or secondary operations. A crown existing in the first step of a channel section may need a second die for flattening and eliminating sidewall springback. Remember that each step work hardens the steel to higher strength levels, reducing the formability and increasing press load and energy requirements.
Methods for correcting springback are described here. The testing needed to calibrate advanced material models for improved springback simulation are described here.
Back To Top
![Springback]()
Mechanical Properties
Elastic Modulus (Young’s Modulus)
When a punch initially contacts a sheet metal blank, the forces produced move the sheet metal atoms away from their neutral state and the blank begins to deform. At the atomic level, these forces are called elastic stresses and the deformation is called elastic strain. Forces within the atomic cell are extremely strong: high values of elastic stress results in only small magnitudes of elastic strain. If the force is removed while causing only elastic strain, atoms return to their original lattice position, with no permanent or plastic deformation. The stresses and strains are now at zero.
A stress-strain curve plots stress on the vertical axis, while strain is shown on the horizontal axis (see Figure 2 in Mechanical Properties). At the beginning of this curve, all metals have a characteristic linear relationship between stress and strain. In this linear region, the slope of elastic stress plotted against elastic strain is called the Elastic Modulus or Young’s Modulus or the Modulus of Elasticity, and is typically abbreviated as E. There is a proportional relationship between stress and strain in this section of the stress-strain curve; the strain becomes non-proportional with the onset of plastic (permanent) deformation (see Figure 1).
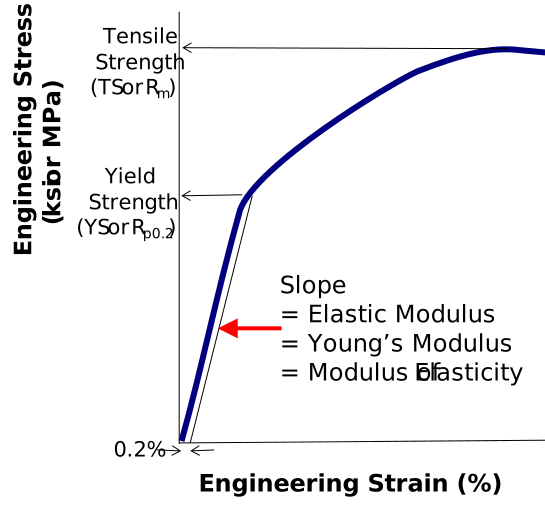
Figure 1: The Elastic Modulus is the Slope of the Stress-Strain Curve before plastic deformation begins.
The slope of the modulus line depends on the atomic structure of the metal. Most steels have an atomic unit cell of nine iron atoms – one on each corner of the cube and one in the center of the cube. This is described as a Body Centered Cubic (BCC) structure. The common value for the slope of steel is 210 GPa (30 million psi). In contrast, aluminum and many other non-ferrous metals have 14 atoms as part of the atomic unit cell – one on each corner of the cube and one on each face of the cube. This is referred to as a Face Centered Cubic (FCC) atomic structure. Many aluminum alloys have an elastic modulus of approximately 70 GPa (10 million psi).
Under full press load at bottom dead center, the deformed panel shape is the result of the combination of elastic stress and strain and plastic stress and strain. Removing the forming forces allows the elastic stress and strain to return to zero. The permanent deformation of the sheet metal blank is the formed part coming out of the press, with the release of the elastic stress and strain being the root cause of the detrimental shape phenomenon known as springback. Minimizing or eliminating springback is critical to achieve consistent stamping shape and dimensions.
Depending on panel and process design, some elastic stresses may not be eliminated when the draw panel is removed from the draw press. The elastic stress remaining in the stamping is called residual stress or trapped stress. Any additional change to the stamped panel condition (like trimming, hole punching, bracket welding, reshaping, or other plastic deformation) may change the amount and distribution of residual stresses and therefore potentially change the stamping shape and dimensions.
The amount of springback is inversely proportional to the modulus of elasticity. Therefore, for the same yield stress, steel with three times the modulus of aluminum will have one-third the amount of springback.
Elastic Modulus Variation and Degradation
Analysts often treat the Elastic Modulus as a constant. However, Elastic Modulus varies as a function of orientation relative to the rolling direction (Figure 2). Complicating matters is that this effect changes based on the selected metal grade.
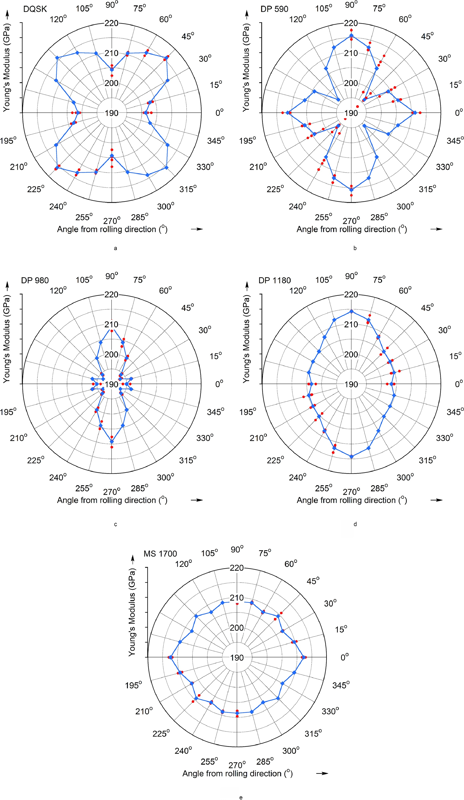
Figure 2: Modulus of Elasticity as a Function of Orientation for Several Grades (Drawing Steel, DP 590, DP 980, DP 1180, and MS 1700) D-11
It is well known that the Bauschinger Effect leads to changes in the Elastic Modulus, and therefore impacts springback. Elastic Modulus determined in the loading portion of the stress-strain curve differs from that determined in the unloading portion. In addition, increasing prestrain lowers the Elastic Modulus, with significant implications for forming and springback simulation accuracy. In DP780, 11% strain resulted in a 28% decrease in the Elastic Modulus, as shown in Figure 3.K-7
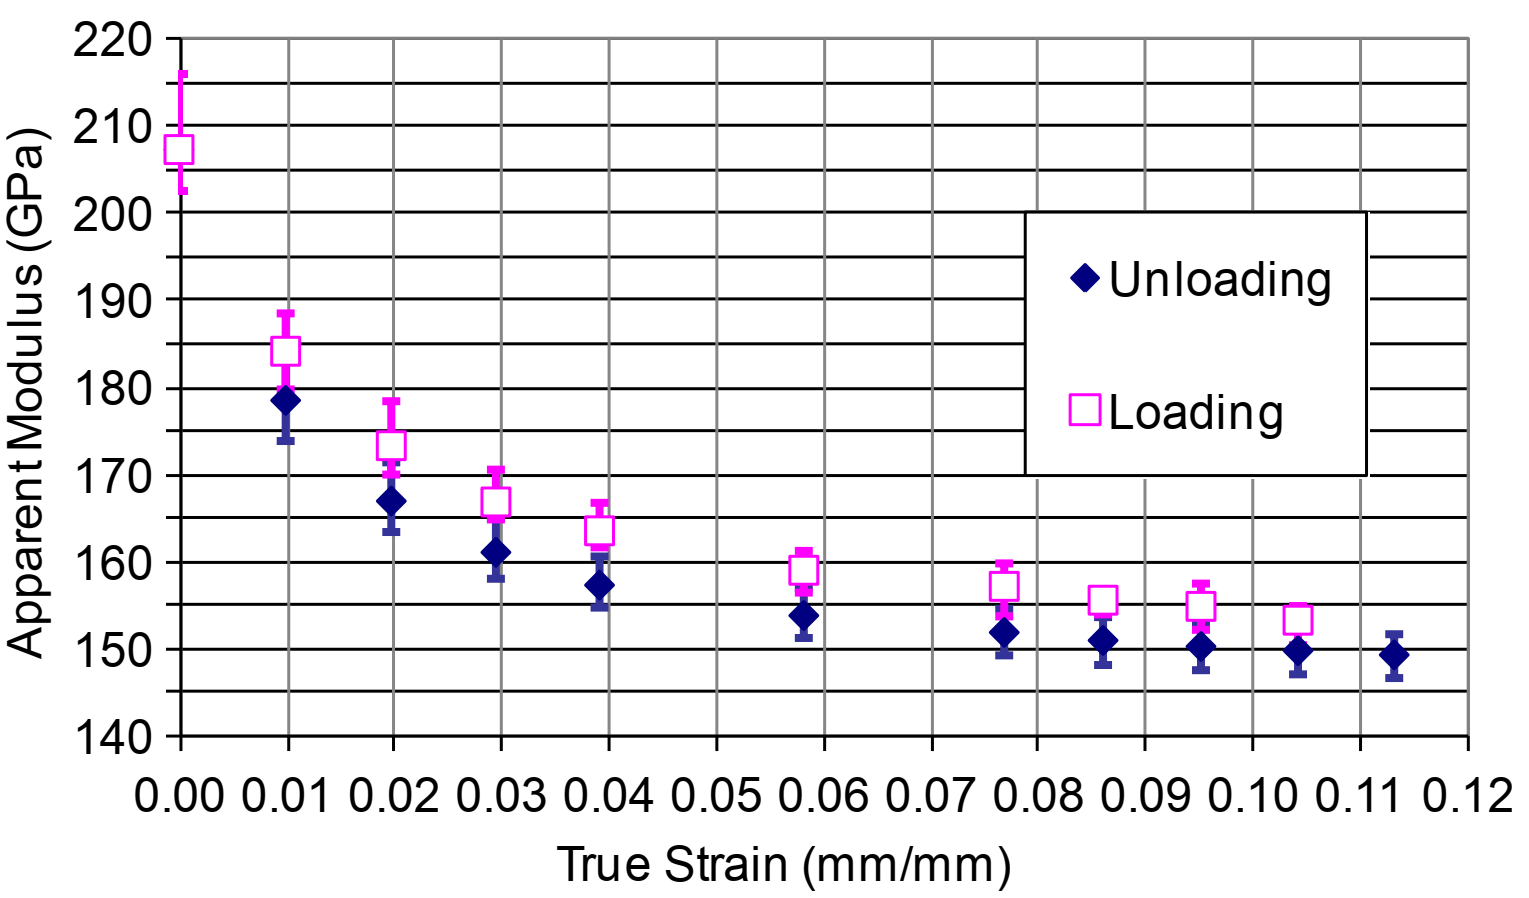
Figure 3: Variation of the loading and unloading apparent modulus with strain for DP780K-7
Another study documented the modulus degradation for many steel grades, including mild steel, conventional high strength steels, and several AHSS products.W-10 Data in some of the grades is limited to small plastic strains, since valid data can be obtained from uniaxial tensile testing only through uniform elongation.
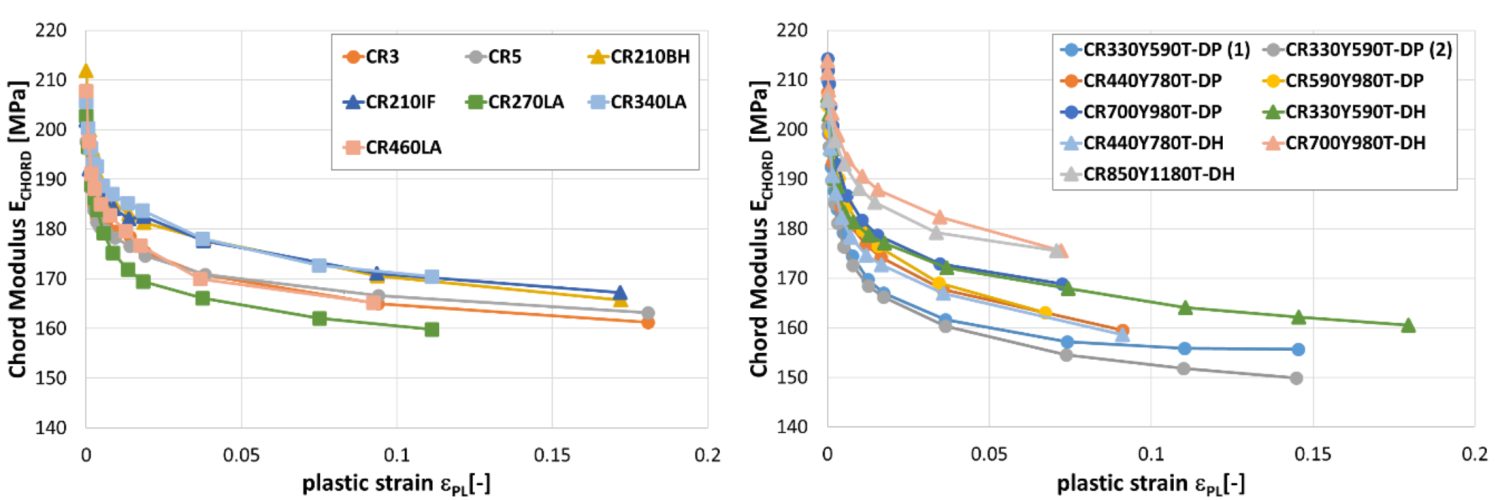
Reduction in chord modulus for mild steels and conventional high strength steels (left) and for DP and DH steels (right).W-10
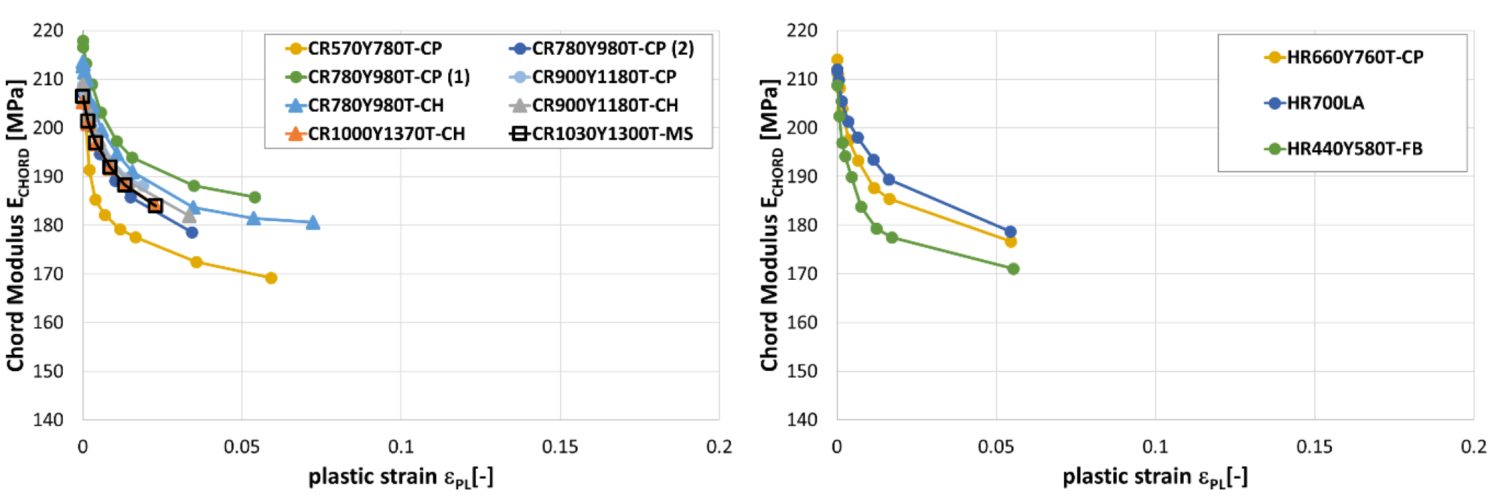
Reduction in chord modulus for CP, CH and MS steels (left) and for a selected of hot rolled steels (right).W-10
Citations
Citation:
K-45. T. Kondo, “The highest strength (1.5GPa) steel application for cold stamping parts” presented at Materials in Car Body Engineering 2021, June 9, 2021.
