During a tensile test, the elongating sample leads to a reduction in the cross-sectional width and thickness. The shape of the engineering stress-strain curve showing a peak at the load maximum (Figure 1) results from the balance of the work hardening which occurs as metals deform and the reduction in cross-sectional width and thickness which occurs as the sample dogbone is pulled in tension. In the upward sloping region at the beginning of the curve, the effects of work hardening dominate over the cross-sectional reduction. Starting at the load maximum (ultimate tensile strength), the reduction in cross-sectional area of the test sample overpowers the work hardening and the slope of the engineering stress-strain curve decreases. Also beginning at the load maximum, a diffuse neck forms usually in the middle of the sample.
Figure 1: Engineering stress-strain curve from which mechanical properties are derived.
The elongation at which the load maximum occurs is known as Uniform Elongation. In a tensile test, uniform elongation is the percentage the gauge length elongated at peak load relative to the initial gauge length. For example, if the gauge length at peak load measures 61 mm and the initial gauge length was 50mm, uniform elongation is (61-50)/50 = 22%.
Schematics of tensile bar shapes are shown within Figure 1. Note the gauge region highlighted in blue. Up though uniform elongation, the cross-section has a rectangular shape. Necking begins at uniform elongation, and the cross section is no longer rectangular.
Theory and experiments have shown that uniform elongation expressed in true strain units is numerically equivalent to the instantaneous n-value.
Deformation Prior to Uniform Elongation is Not Uniformly Distributed
Conventional wisdom for decades held that there is a uniform distribution of strains within the gauge region of a tensile bar prior to strains reaching uniform elongation. Traditional extensometers calibrated for 50-mm or 80-mm gauge lengths determine elongation from deformation measured relative to this initial length. This approach averages results over these spans.
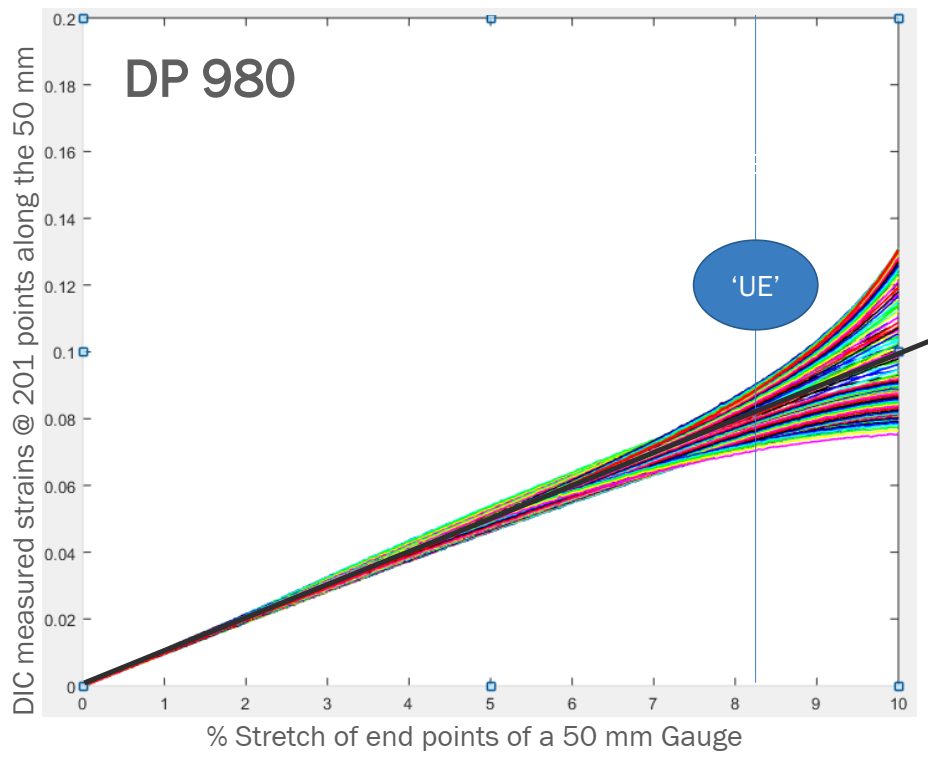
The advent of Digital Image Correlation (DIC) and advanced processing techniques allowed for a closer look. A studyS-113 released in 2021 clearly showed that each of the 201 data points monitored within a 50 mm gauge length (virtual gauge length of 0.5-mm) experiences a unique strain evolution, with differences starting before uniform elongation.
Figure 2: Strain evolution of the 201 points on the DP980 tensile-test specimen exhibits divergence beginning before uniform elongation—counter to conventional thinking.S-113
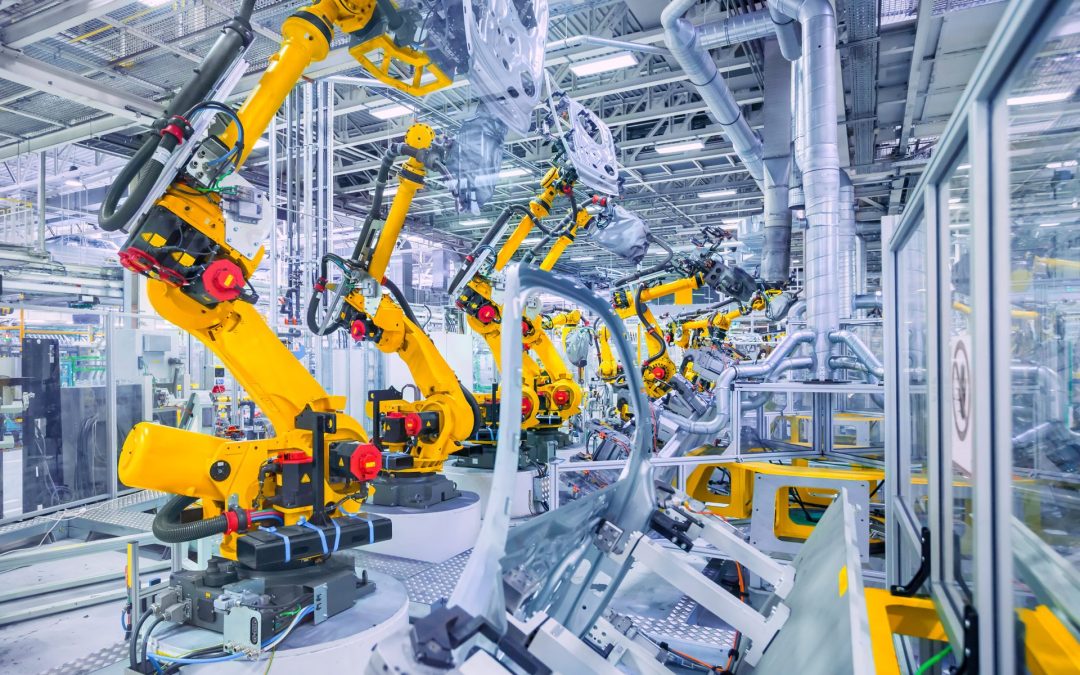
As more companies aim to reduce their product’s time to market, research and design engineers have begun integrating predictive modeling into their process. These models, whether finite element based or artificial intelligence based, all rely on quality mechanical testing results. Companies within the automotive industry have seen that accurately predicting large scale tests such as crashworthiness trials can greatly expedite the time it takes to get their products to market. One of the more important details in predicting these expensive and time-consuming tests is to understand how the materials within the design are affected by the higher rates of deformation or their strain rates.
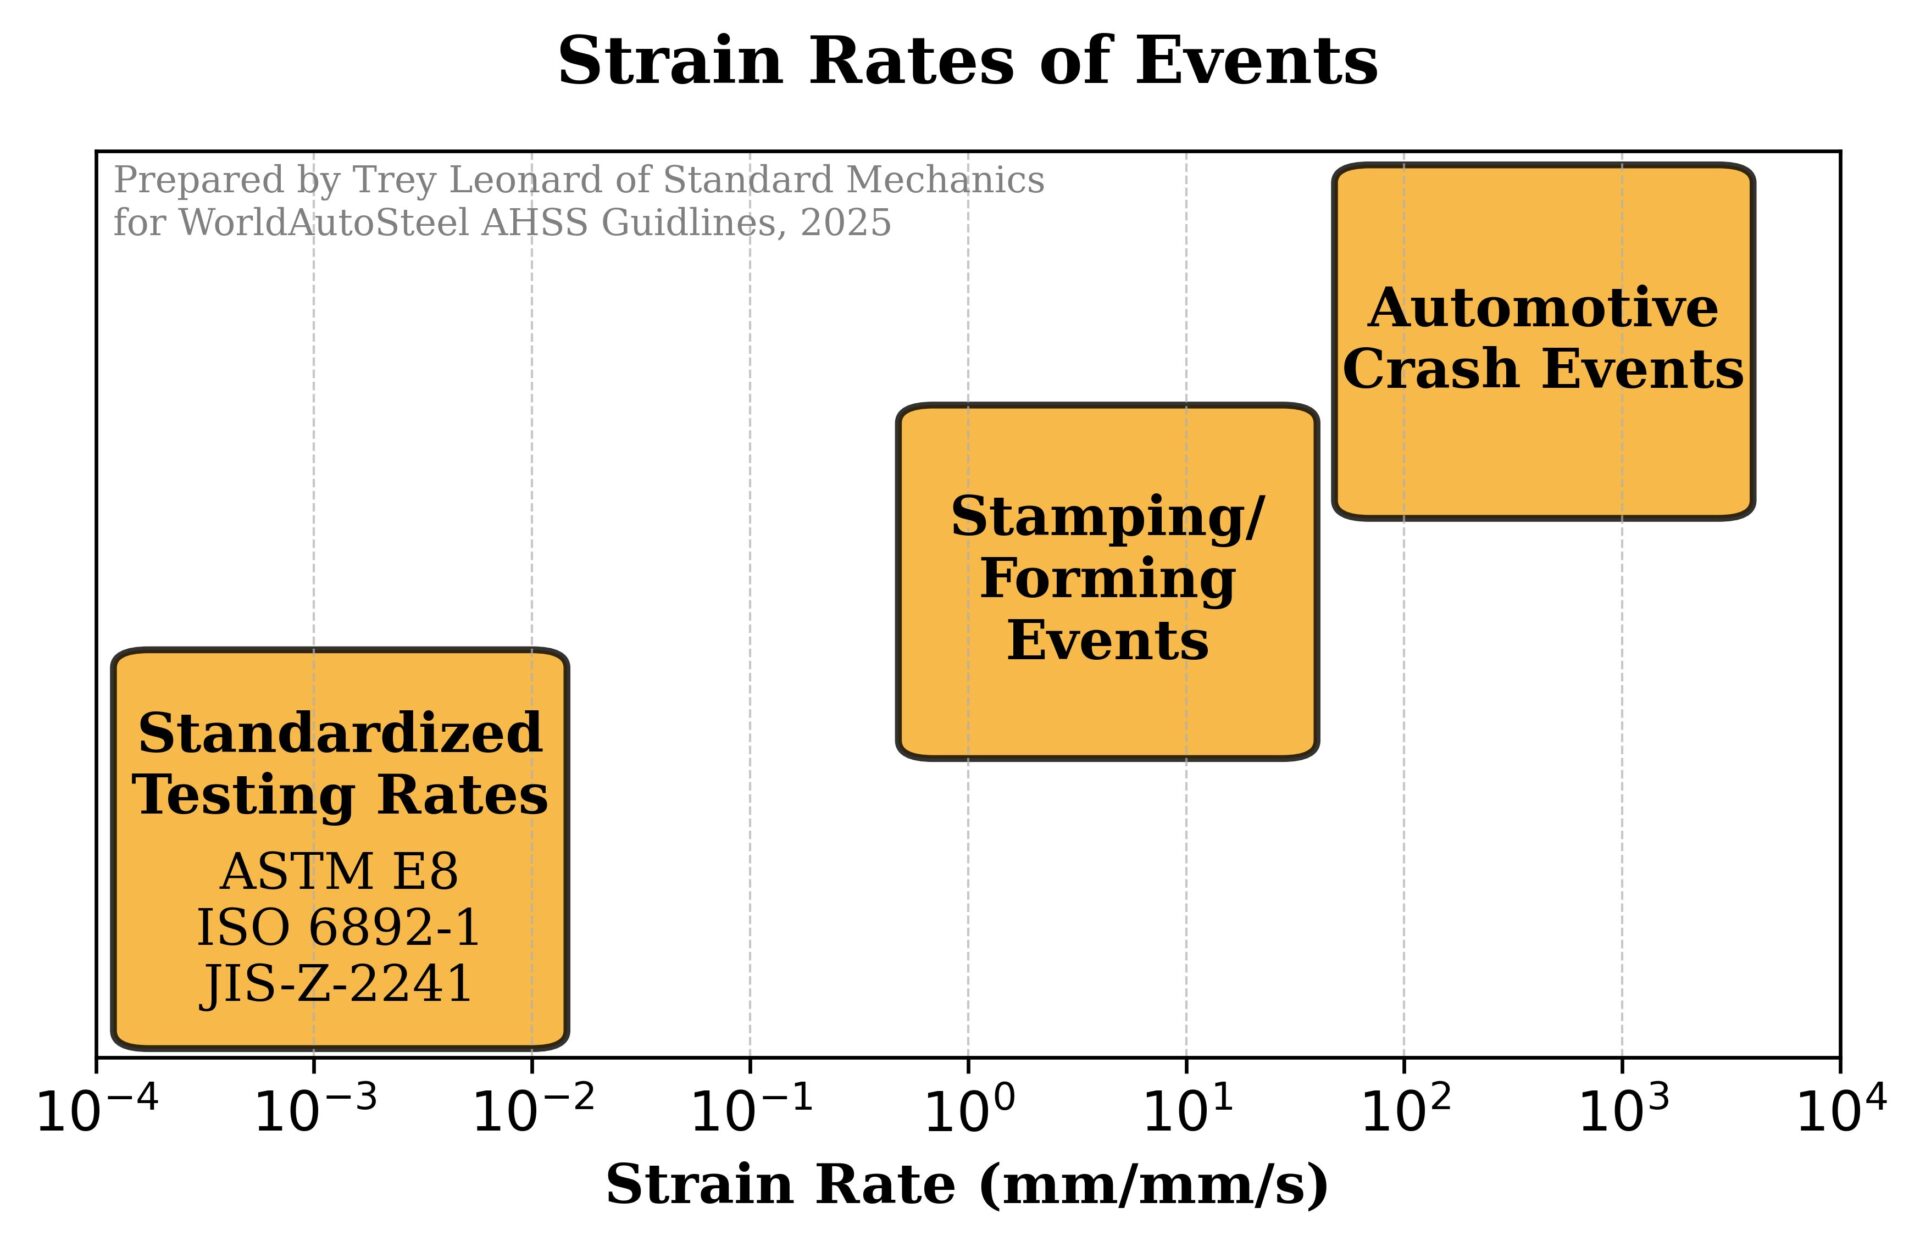
Traditional standardized tensile tests have been used for over a century – ASTM E8 was first approved in 1924. Testing laboratories using standards like ASTM E8, ISO 6892-1, and JIS Z-2241 produce repeatable and reproducible mechanical properties for metals undergoing tensile deformation, but each of these standards requires the test to be run at a speed orders of magnitude lower than those occurring during events like sheet metal forming and automotive crash. A tensile test run according to ASTM E8 to obtain the yield properties of a metal is run at a strain rate of 0.00035 strain per second (0.00035/s). For comparison, a stamping process has strain rates on the order of 1 to 10 strain per second, and an automotive crash can have strain rates up to 1,000 strain per second (Figure 1).
Figure 1. Strain rates of different events.
Historically, no guidelines have been available as to the testing method to obtain high strain rate mechanical properties. Decisions on specimen dimensions, measurement devices, and other important issues which are critical to the quality of testing results were made within each individual laboratory. As a result, data from different laboratories were often not directly comparable. A WorldAutoSteel committee evaluated various procedures, conducted several round-robins, and developed a recommended procedure, which evolved into what are now the first two parts of ISO 26203, linked below.
Published standards addressing tensile testing at high strain rates include:
Steel alloys typically possess positive strain rate sensitivity, or m-value when tested at ambient temperature, meaning that strength increases with strain rate. This has benefits related to improved crash energy absorption.
The specific response as a function of strain rate is grade dependent. Some grades get stronger and more ductile as the strain rate increases (left image in Figure 2), while other grades see primarily a strength increase (right image in Figure 2). Increases are not linear or consistent with strain rate, so simply scaling the response from conventional quasi-static testing does not work well. Strain hardening (n-value) also changes with speed in some grades, as suggested by the different slopes in the right image of Figure 2. Accurate crash models must also consider how strain rate sensitivity impacts bake hardenability and the magnitude of the TRIP effect, both of which are further complicated by the strain levels in the part from stamping.
Figure 2: Two steels with different strength/ductility response to increasing strain rate.A-7
Importance of Proper Testing Equipment
Knowing that the strain rate directly affects mechanical properties, many research test laboratories have run tensile tests using the same specimen geometry and machine as standardized but have increased the speed the machine runs during the test. This typically allows for tests to be performed at strain rates of up to 0.1 strain per second. From this data, an extrapolated curve can be fit to approximate the properties of the materials at higher strain rates. One model used to predict the increase in strength of a material deformed at a higher strain rate is the Cowper-Symonds model:
Equation 1
where σd is the strength of the material at a strain rate έ, σs is the strength of the material at a theoretical strain rate of zero strain per second, and C and p are model parameters.
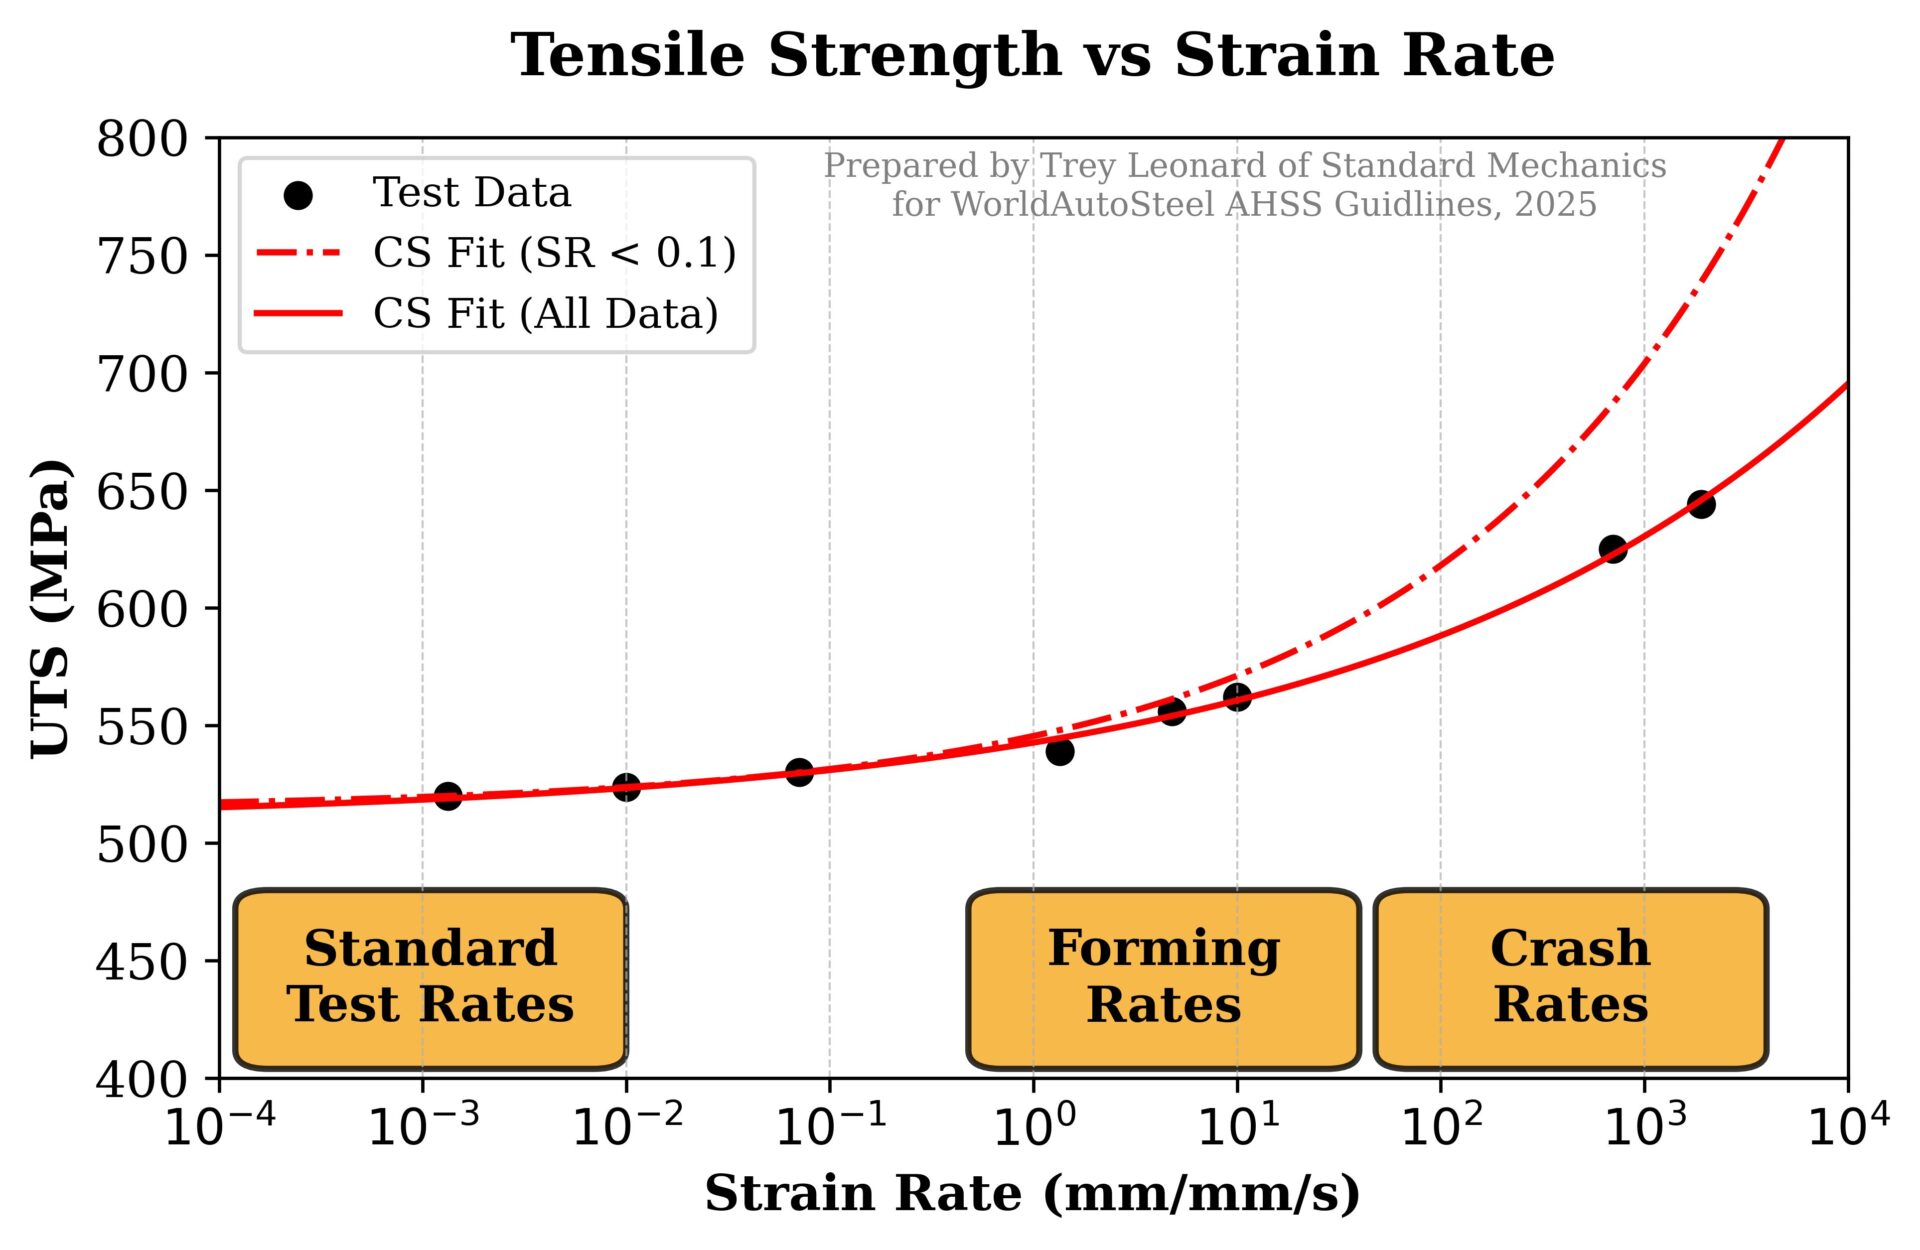
Figure 3 shows two best fit curves for this Cowper-Symonds model to the tensile strengths of a cold rolled steel across a range of strain rates. The first considers only data that can be obtained using traditional tensile testing machines (strain rates less than 0.1 strain per second) while the second uses data up to 2,000 strain per second. Both models have minimal errors at strain rates below 0.1 strain per second, but as the limited model begins to extrapolate data beyond this strain rate regime, the associated error begins to grow exponentially causing large errors at the strain rates typical in crashes.
Figure 3. Example of extrapolation of tensile strength vs strain rate data using a Cowper-Symonds model. The dashed curve is an extrapolation based only on data acquired using traditional tensile testing machines, where strain rates are less than 0.1 strain per second. The solid curve is the extrapolation when considering data from equipment capable of achieving 2,000 strain per second.
Testing Methods and Equipment
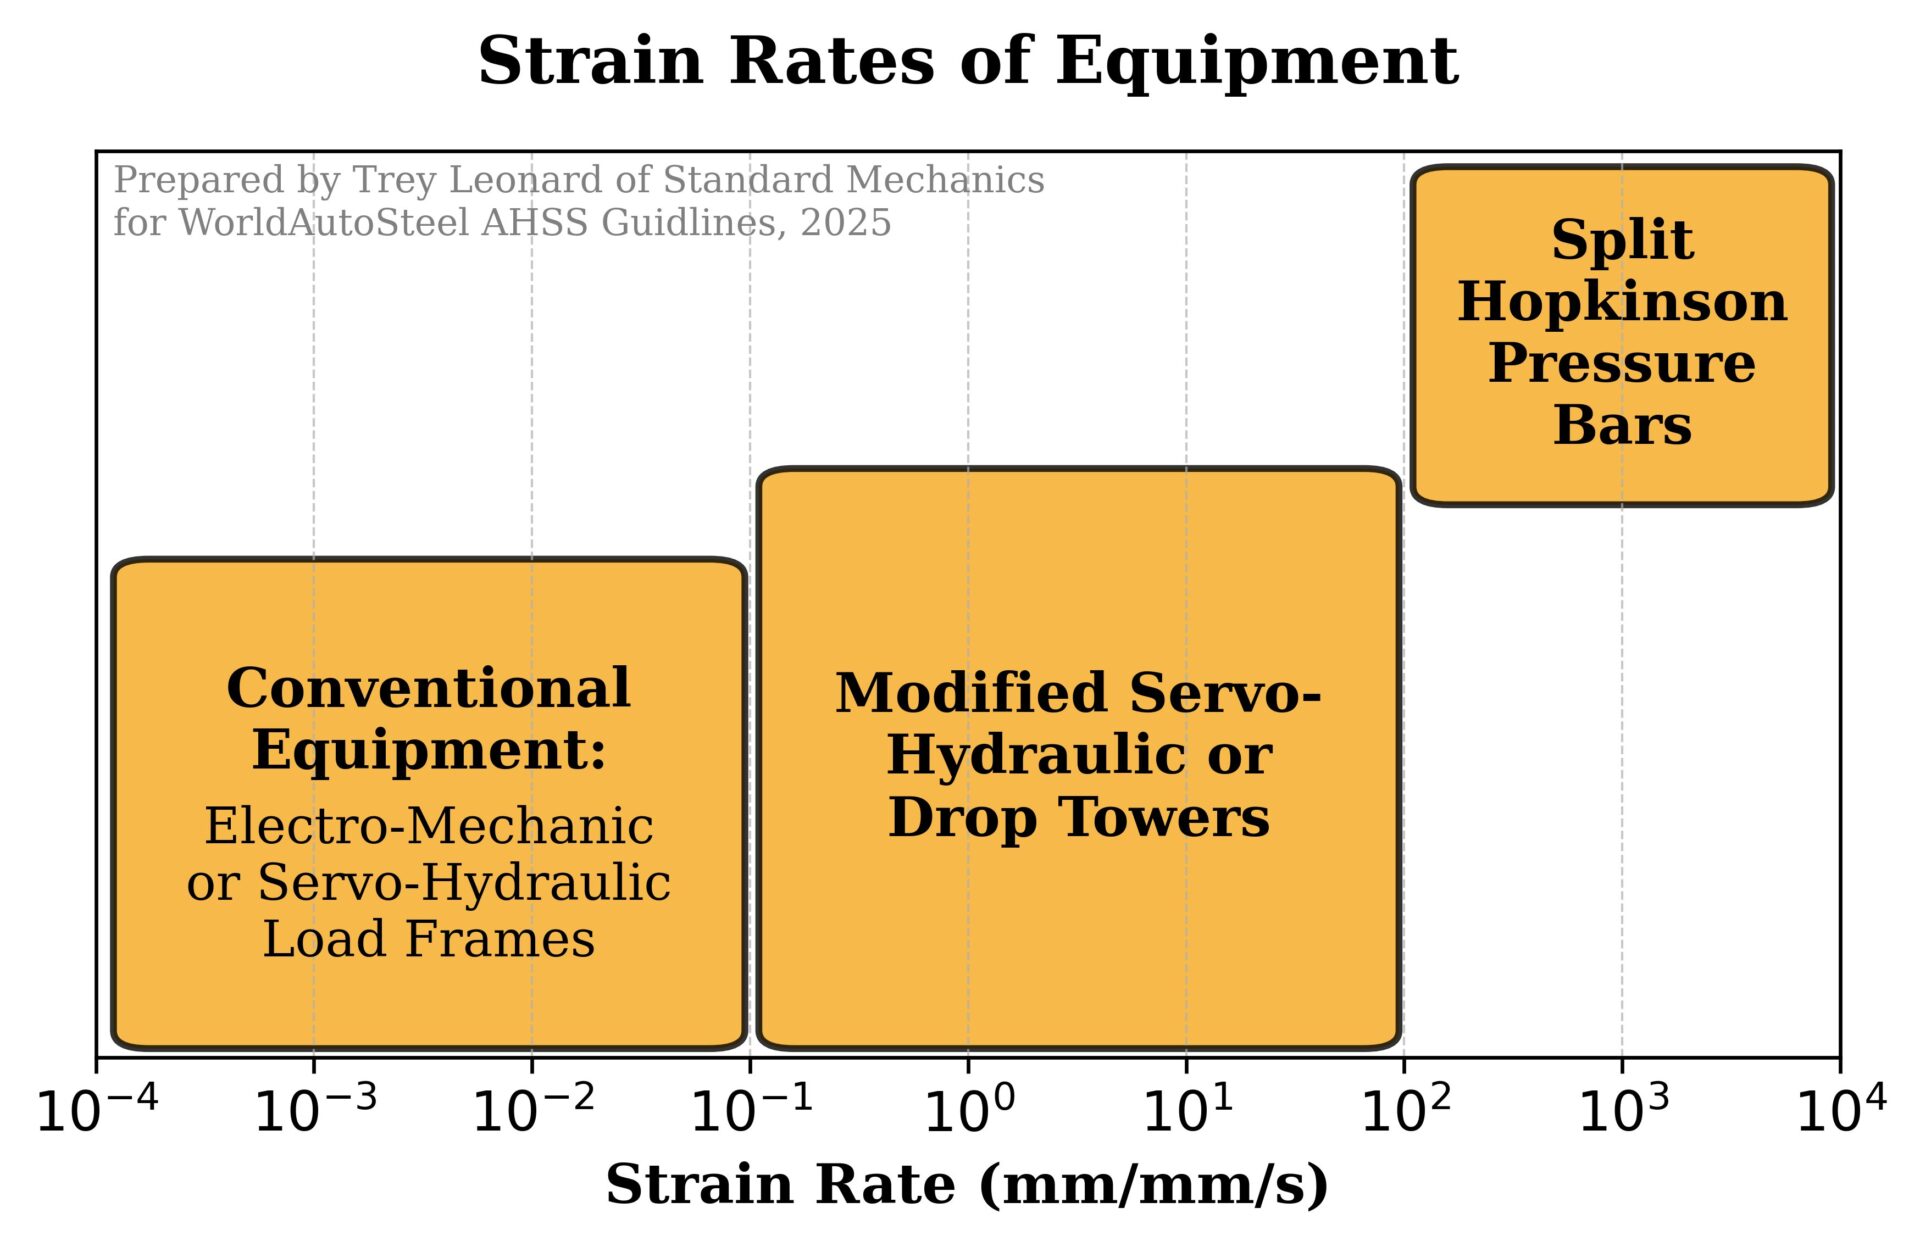
The biggest obstacle to measuring how a material responds to different strain rates is that it requires several different types of equipment. This is due to the need to run tests at up to six or seven different orders of magnitude to fully characterize the material. Figure 4 shows which mechanical testing equipment is most used to perform tensile tests based on the strain rate of the test. A broader range of testing methods for more strain rates can be found in the ASM Handbook, Volume 8: Mechanical Testing and Evaluation.A-88 The limits for the strain rate range that each type of test equipment can achieve varies based on the design and attributes of each specific machine as well as the specimen geometry used in testing. In tensile and compression testing, going from a longer specimen to a shorter specimen allows for a specific machine to increase its upper limit on strain rates.
Figure 4. Testing equipment most used to test materials at strain rates between 0.0001 strain per second and 10,000 strain per second in uniaxial tension.
Modified Servo-Hydraulic Machines
Modified servo-hydraulic testing machines are specifically engineered to characterize the dynamic mechanical properties of materials at high strain rates, often reaching strain rates up to 500 strain per second. Unlike conventional servo-hydraulic machines, which used closed-loop control for precise lower-speed testing, these modified systems incorporate design features that overcome the limitations of standard hydraulic controls at higher speeds. Many of these machines utilize extreme high flow valves along with slack adapters. The higher flow valves allow for higher accelerations while the slack adapters decouple the actuator from the specimen while the actuator accelerates to a desired test speed.
Split Hopkinson Pressure Bars
A split Hopkinson pressure bar (sometimes referred to as Kolsky bar or simply SHPB) is an impact-based device that is designed to characterize the dynamic mechanical properties of materials at strain rates above 100/s. The SHPB system uses a striker rod to generate a stress wave which induces plastic deformation in a specimen placed between two elastic bars. The stress wave generated by the striker bar in the first elastic bar (called the incident bar) is measured by a strain gauge fixed at the midpoint of the incident bar. When the stress wave reaches the specimen, part of the stress wave is transmitted through the specimen into the second elastic bar (called the transmitted bar) where it is measured by a second strain gauge. The rest of the stress wave is reflected off the specimen and returns down the incident bar to be re-measured by the strain gauge. Figure 5 shows how the stress waves propagate through a SHPB system during a compression test. There are various options to modify the compression SHPB setup to run a tensile test, but the most common is to replace the striker bar with a tube that slides on the incident bar where it impacts a flange on the end of the incident bar causing a tensile stress wave to propagate towards the specimen instead of a compression wave.
Figure 5. Animation showing how a stress wave propagates through a
split Hopkinson pressure bar system during a high strain rate compression test.
High Strain Rate Testing Challenges
Many other challenges complicate testing materials at higher strain rates. Three of the major challenges are
Challenges of measuring strain at high speeds
Challenges of accounting for inertial effects
Challenges of accounting for adiabatic heating
Strain Measurements in High Strain Rate Testing
During standardized mechanical testing, clip-on extensometers and deflectometers provide excellent extension measurements. As the speed of the test increases, the mass of the extensometer inhibits its use due to slippage of the contact points or interference with the specimen, both of which lead to erroneous test results and potential damage to the device. During high strain rate tests, the simplest means of measuring specimen displacements is to derive them based on the stress waves from the test. A detailed derivation of this method can be found here. This method works well for compression testing, but during tensile testing, events such as slippage of the specimen within the grips or deformation of the radius section of the specimen add to the displacements of the test. These additional displacements overshoot the tensile strain of a specimen during the test. This has led to the nearly universal adoption of optical strain measurements for high strain rate tension tests.
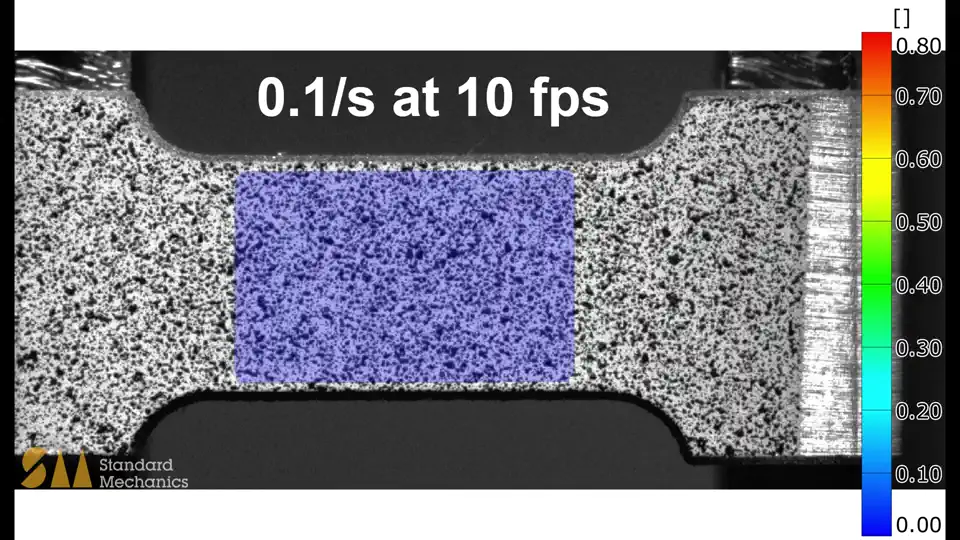
The most common optical method is digital image correlation (DIC). DIC correlates a series of images taken during the deformation of a specimen and calculates the corresponding strains of the specimen. It does this by tracking a black-and-white speckle pattern painted on the specimen’s surface which creates a series of high-contrast features as shown in Figure 6.
Figure 6. Two examples of 2D digital image correlation (DIC) showing the true equivalent strain fields during tensile tests performed at 0.1 strain per second and 1000 strain per second.
When testing round or more complex specimens, two cameras are required to track the surface of the specimen in three-dimensional space. This is referred to as 3D DIC, and it often requires more rigorous calibration for use in testing due to its multi-camera complexity. Alternatively, there are a series of one-dimensional options for strain measurements. The simplest utilizes a high-speed line scan camera to measure the displacement of a specimen along the test direction. While the two- and three-dimensional approaches bring in more data, the one-dimensional approach has been shown to provide excellent resolution at a lower adoption cost.Z-16
Accounting for Inertia in High Strain Rate Testing
At strain rates around one to ten strain per second, inertial effects can begin to complicate the interpretation of test results. These effects can be broken into two varieties: inertia of the specimen being tested and inertia of the equipment being used. Both directly affect the load values measured during a given test. In a modified servo-hydraulic load frame, large grips can create a large difference in stiffness (known more specifically as mechanical impedance) between each grip and the specimen. This difference causes more of any generated stress wave to be reflected at the interface as opposed to transmitting through; thus, as the wave travels back-and-forth through the specimen, the load it experiences “rings up”. This is sometimes referred to as “load ringing”. During this transient period of ring-up, the wave is amplifying or changing shape each time it reaches an end of the specimen. From this, the specimen experiences a load gradient across its gauge section depending on where the wave is at that point. After a certain number of reflections have occurred, the stress wave within the specimen becomes uniform and the specimen is determined to be in stress equilibrium. The number of oscillations it takes for this to occur is greatly dependent on the maximum frequency of the stress wave that enters the specimen and the ratio of mechanical impedances between the specimen and its grips. The lower the difference in impedances, the lower the energy that is reflected back into the specimen. The overall time of this period is not affected by the strain rate of the test being performed. This is because the phenomenon is based more so on the number of times the wave traverses the specimen which is solely dependent on the wave speed and length of the specimen. The wave speed of a material (assuming one—dimensional wave propagation) is calculated by:
Equation 2
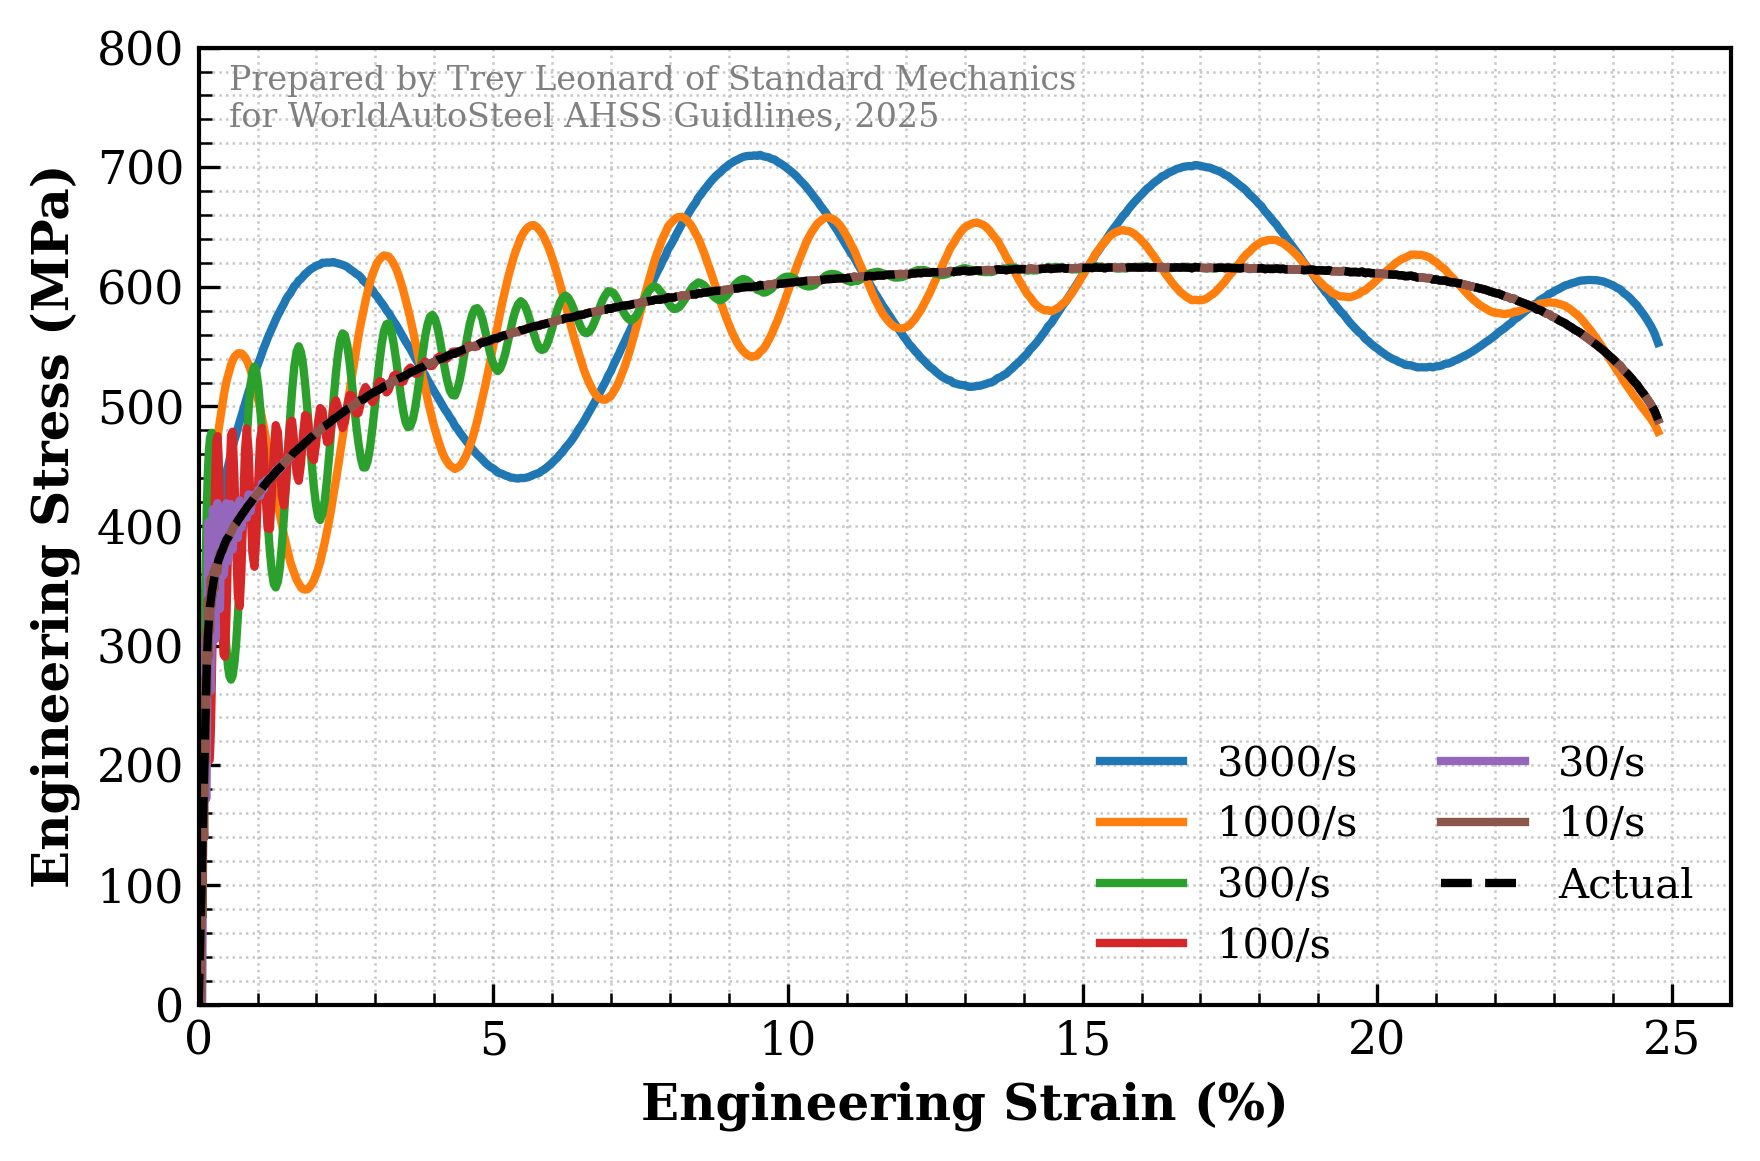
Where c is the wave speed of the material, E is the Young’s modulus of the material, and ρ is its density. When viewing test results, the load ringing can be seen as a decaying sinusoidal that begins when the specimen is first loaded. Figure 7 shows an example of how this could look across various strain rates. Each data set shares the same decay time constant, frequency, and magnitude of oscillations. Holding these three as constant simulates running tensile tests using the same specimen geometry, machine, and grips but varying the strain rate of the test. In the data set at lower strain rates, the effect of load ringing is minor with no notable difference between the actual response and the measured response at 10 strain per second. At 30 and 100 strain per second, the yield portions of the stress-strain curves are noisy, but the overall hardening profile is still clean. At 300 strain per second, the oscillations affect most of the hardening potion of the stress-strain curve. At 1000 strain per second, the overall profile of the stress-strain curve can be made out including strain to failure, but no details regarding hardening, uniform elongation, or tensile strength can be stated without large error bands. At 3000 strain per second, very little can be discerned from the data.
Figure 7. Illustration of theoretical frequency responses of dynamic tensile tests performed at various strain rates. All tests share the same decaying time constant, frequency, and magnitude of oscillations.
Some laboratories have adopted an inverse method that takes data with excessive load ringing and derives a stress-strain model. This is done by simulating the equipment used to perform the test along with the specimen tested in a finite element model. Then, repeated iterations of the stress-strain profile are sequentially optimized until the simulation best fits the data read from the test which includes the load oscillations. While this method has shown great potential, it is often too time intensive and expensive to justify in most industrial applications.
Adiabatic Heating in High Strain Rate Testing
The final challenge when testing materials at high strain rates comes from a by-product of plastic deformation of materials: adiabatic heating. Quasi-static tests allow for iso-thermal testing where the rate of heat being generated from plastically deforming the specimen is exceeded by the rate that heat is lost to the surrounding environment. As the strain rate of the test is increased, so too does the rate of plastic work and heat generation within the specimen. This internal heating is also compounded with the need for high intensity lighting to illuminate any high-speed optical methods for measuring strain of specimens. Because of these heat sources without equivalent cooling, the material response as measured by a high strain rate test is jointly affected by the higher strain rate as well as the elevated temperature of the specimen. These two effects have been shown experimentally to not be independent of one another, further complicating the analysis and interpretation of these tests. More complex multi-physics material models are often employed to account for these coupled effects in finite element model simulations.
Thanks are given to Trey Leonard, for his contributions to this page. Trey is the founder and CEO of Standard Mechanics, LLC, where he delivers advanced mechanical testing services and solutions across a wide range of applications, from automotive design to consumer electronics. His expertise spans formability, fatigue, and strain rate sensitivity testing. Beyond conducting tests, he partners with customers to ensure the development of high-quality, calibrated material cards and models for accurate finite element simulations. Dr. Leonard earned his Ph.D. in Mechanical Engineering from Mississippi State University, where he pioneered and licensed technologies in dynamic material testing and characterization. Building on this foundation, he continues to develop innovative testing methods and technologies that advance the field of dynamic mechanical testing. He also contributes to the broader engineering community through his work with ASTM International, where he serves on the E28 Committee on Mechanical Testing, regularly reviewing and improving industry standards.
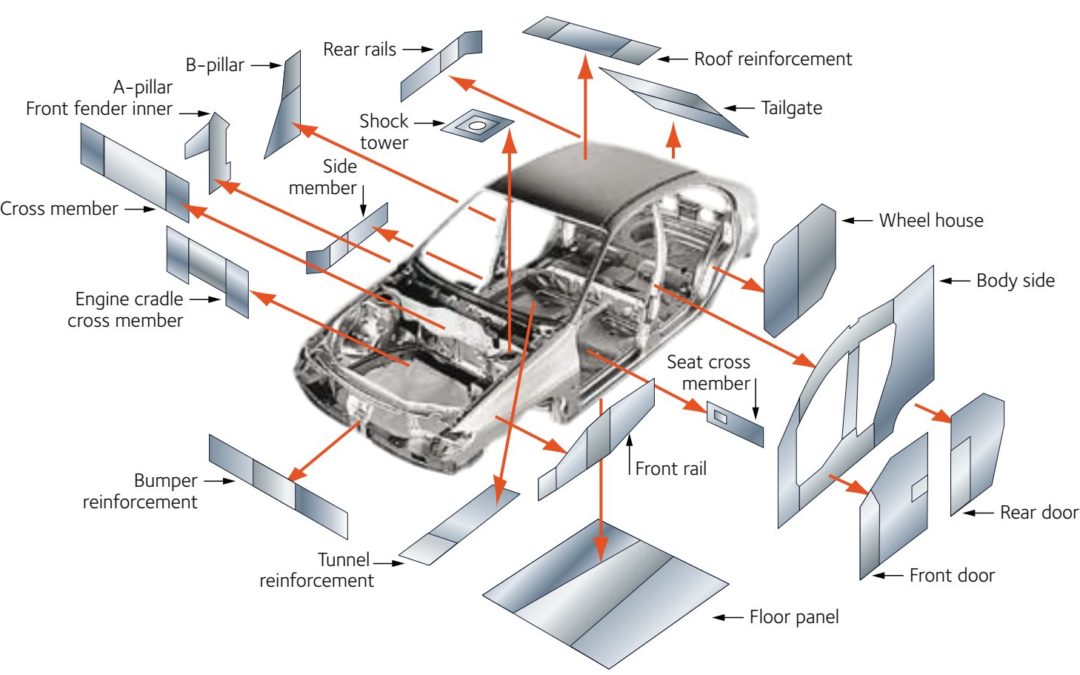
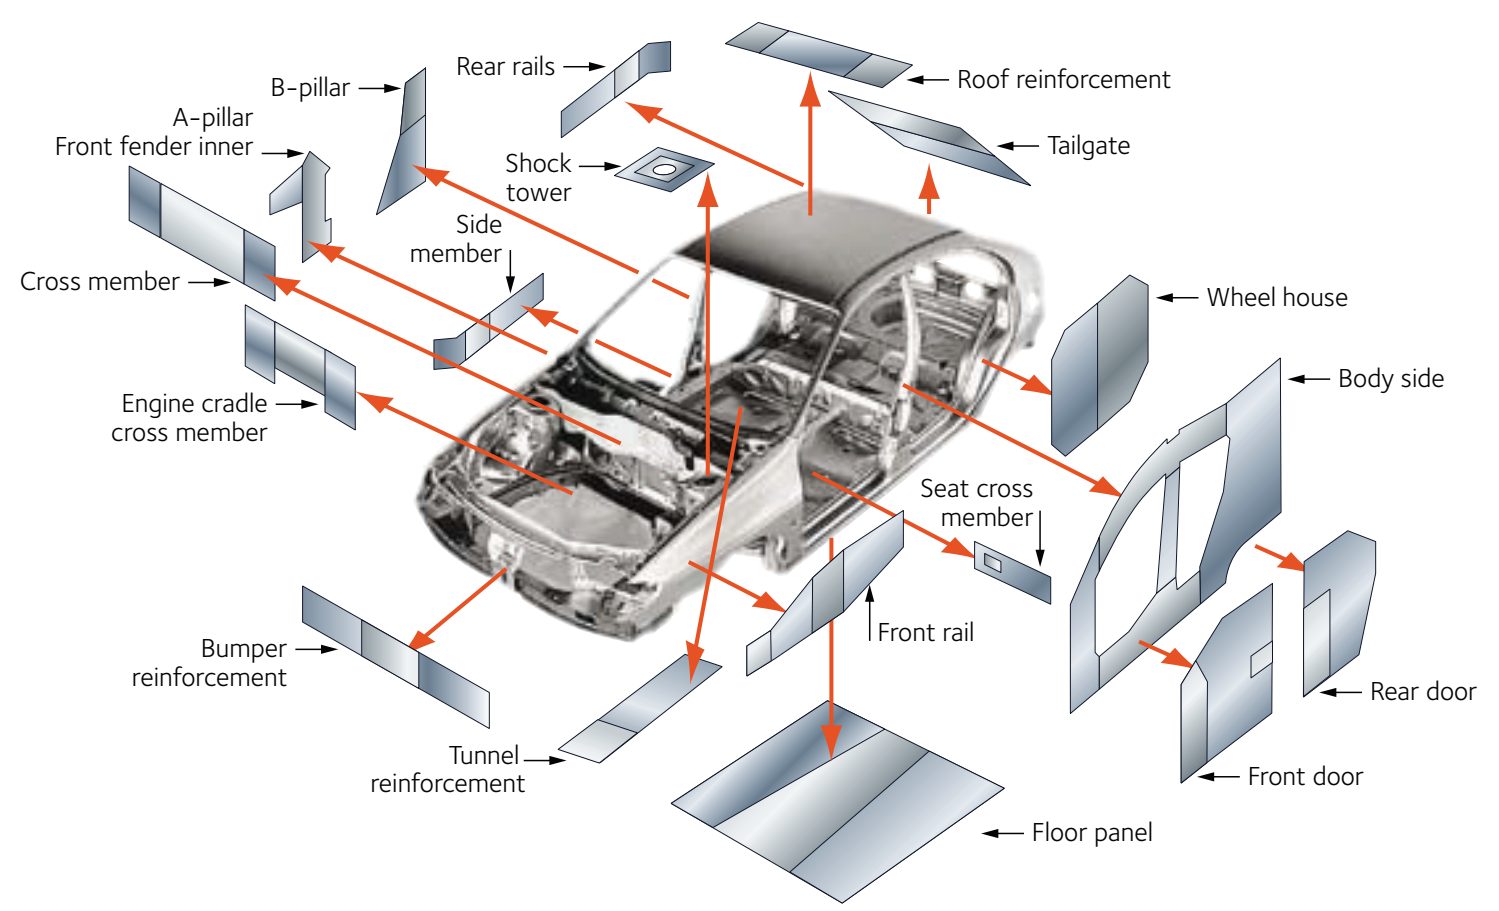
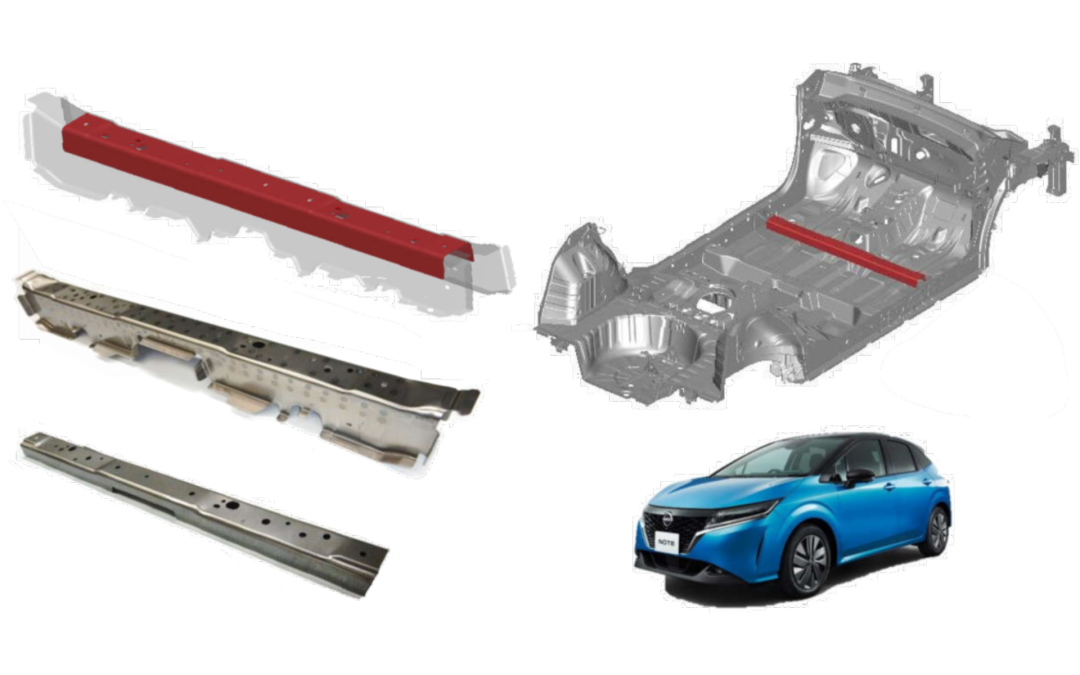
Key materials characteristics for formed parts include strength, thickness, and corrosion protection. Tailored products provide opportunities to place these attributes where they are most needed for part function, and remove weight that does not contribute to part performance.
Figure 1 highlights some of the areas within the body structure where companies have considered transitioning to welded tailored blanks. Other tailored products may be suitable in other areas.
Figure 1: Applications suited for welded tailored blanks.A-31
Tailored products offer numerous advantages over the conventional approach involving the stamping and assembly of individual monolithic blanks which have a single grade, thickness, and coating, including:
Improved materials utilization
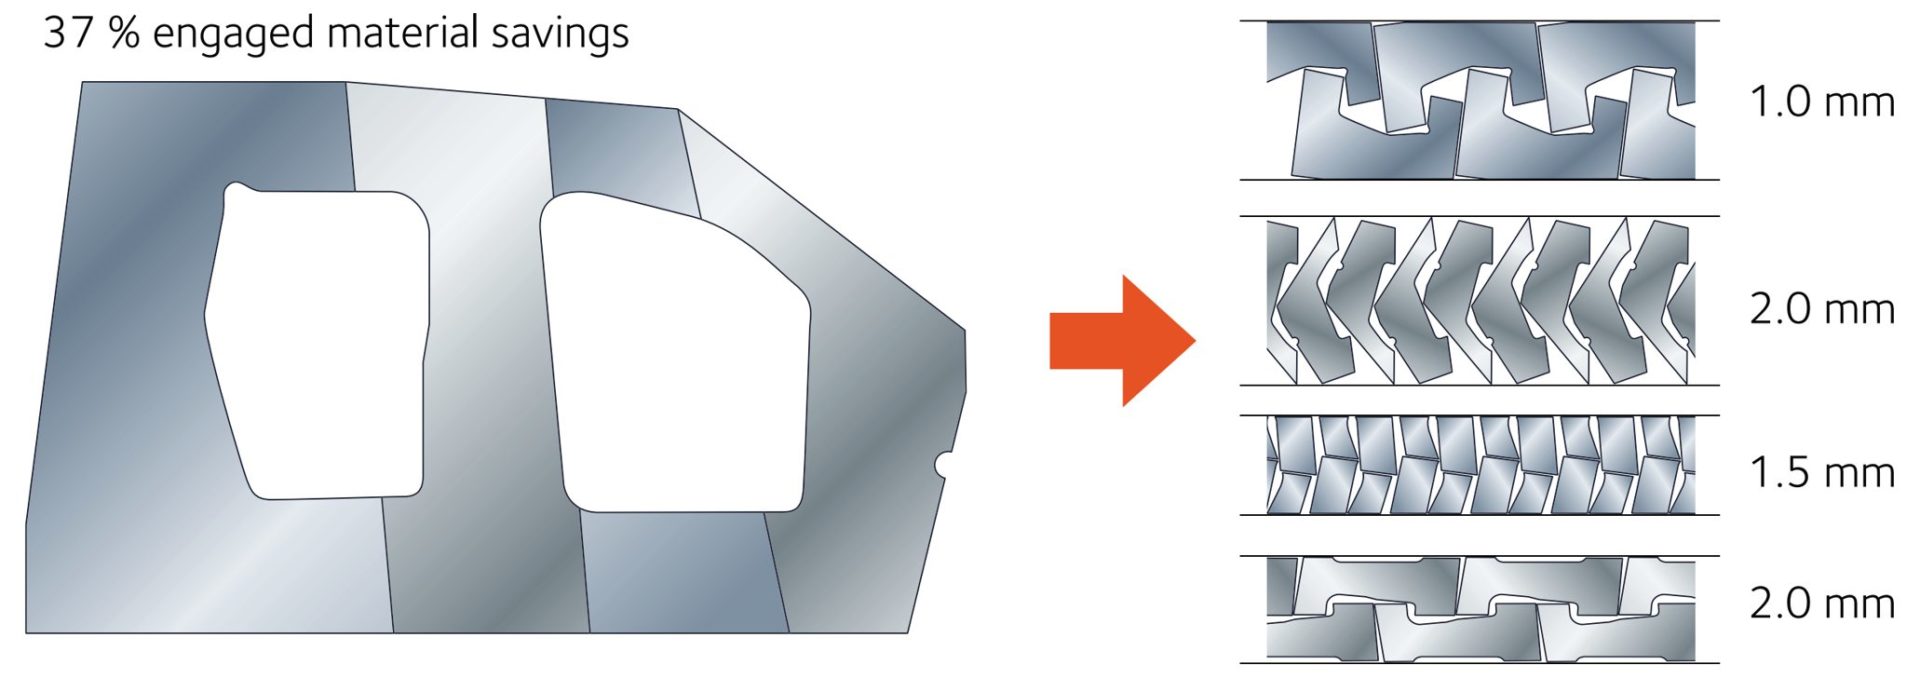
Certain parts, like door rings, window frames, and door inner panels, have large cutout areas contributing to engineered scrap. Converting these to welded tailored blanks allows for optimized nesting of the individual components. Figure 2 presents an example of optimized nesting associated with body side aperture designs using a tailor welded blank. Reduced blank width requirements may allow for additional suppliers or use of master coils yielding slit mults. In the other extreme, blank dimensions larger than rolling mill capabilities are now feasible.
Elimination of reinforcement parts and reduced manufacturing infrastructure requirements
In areas needing additional thickness for stiffness or crash performance, conventional approaches require stamping both the primary part and an additional smaller reinforcement and then spot welding the two parts together. The tailored product directly incorporates the required strength and thickness. Compared with a tailored product, the conventional approach requires twice the stamping time and dunnage, creates inventory, and adds the spot welding operation. Tolerance and fit-up issues appear when joining two formed parts, since their individual springback characteristics must be accommodated.
Part consolidation
Similar to the benefits of eliminating reinforcements, tailored products may combine the function of what would otherwise be multiple distinct parts which would need to be joined.
Weight savings
Conventional approaches to body-in-white construction requires individual parts to have flat weld flanges to facilitate spot welding. Combining multiple parts into a tailored product removes the need for weld flanges, and their associated weight.
Improved NVH, safety, and build quality
Joining formed parts is more challenging than joining flat blanks first and then stamping. Tailored products have better dimensional integrity. Elimination of spot welds leads to a reduction in Noise, Vibration, and Harshness (NVH). A continuous weld line in tailored products means a more efficient load path.
Enhanced engineering flexibility
Using tailored products provides the ability to add sectional strength in precise locations to optimize body structure performance.
Easily integrated with advanced manufacturing technologies for additional savings
Tailored products incorporated into hot stamping or hydroforming applications magnify the advantages described here, and open up additional benefits.
TEASER!: A future post will highlight how these tailored products are applied to press hardening steels to create a single component having strength levels tuned to the needs of each segment of the body structure. Stay tuned!
WorldAutoSteel has a 30-year legacy of steel demonstration all the way back to the Ultra-Light Steel Auto Body (ULSAB), whose engineering report is still being downloaded from our worldautosteel.org site today. The one you may remember best is the FutureSteelVehicle (FSV), results of which we launched in 2011. FSV demonstrated steel innovation for not only Battery Electric vehicles (BEV) but also Fuel Cell vehicles (FCV). Steel E-Motive is the sixth of our global steel industry programs.
So Why Mobility as a Service?
The Automotive sector is undergoing the most rapid change in 40 years. This transformation shifts our thinking – from the movement of vehicles to the efficient movement of people and goods. Over the past eight years, we have conducted extensive research into global trends such as urbanization, transport emissions reduction, as well as the waning interest in vehicle ownership among the young and old. This is especially prevalent in megacities characterized by pollution, congestion, limited parking and enormous ownership costs. Our research concluded that mobility as a service (MaaS) will grow exponentially in high population areas and would place a significant challenge on vehicle design and manufacturing. Therefore, we needed to make sure we as an industry were active and visible in providing STEEL solutions in this new market place.
Steel E-Motive will demonstrate the benefits of steel, linking the properties of the material to the required architectures and attributes for MaaS vehicles.
This program will demonstrate the benefits of steel, linking the properties of the material to the required architectures and attributes for MaaS vehicles. It connects us with original equipment manufacturers (OEMs) and future mobility providers (FMPs), reinforcing steel’s advantages in strength, durability, sustainability and affordability.
An autonomous BEV structure aligns perfectly with steel’s best attributes, however most new concepts trial alternative materials. The global steel industry is investing significantly in product and fabrication development to continually prepare for the next challenge. High Strength and Advanced High-Strength Steel (AHSS) portfolios have grown from the 11 highlighted in the ULSAB program, to more than 60 grades available for use in designing and optimizing Steel E-Motive’s autonomous BEV architecture. Third Generation AHSS (3rd Gen AHSS) will have a prominent role in Steel E-Motive’s body-in-white, taking strength levels ever higher while improving manufacturability. And our industry continues to evolve Press Hardened Steels (PHS) with strength levels upwards of 2000 MPa.
Finally, efficient fabrication processes such as roll stamping, press hardening, and hydroforming use less steel and therefore contribute lower vehicle production emissions. These are the details being highlighted in Steel E-Motive, where we hope to demonstrate that only Steel can make it Real.
Steel E-Motive: A game changing, world first?
Many OEM’s and mobility service providers follow the typical vehicle development process where they adapt an existing vehicle structure to the new vehicle requirements. We don’t have that in Steel E-Motive We believe Steel E-Motive is one of the world’s firsts.
The first for a Level 5 autonomous vehicle that is compliant with global high-speed crash requirements.
The first autonomous vehicle to be a conventional high-volume stamped steel body construction, creating an affordable platform for the mobility service provider.
First to offer a competitive, robust, and sustainable MaaS solution.
For engineers, being first is very exciting but a little nerve wracking – there are no benchmarks out there. There is less to “hang on to.” We’re on our own. Target setting is more challenging; we are the benchmark. Time will tell if we make it to the automotive hall of fame.
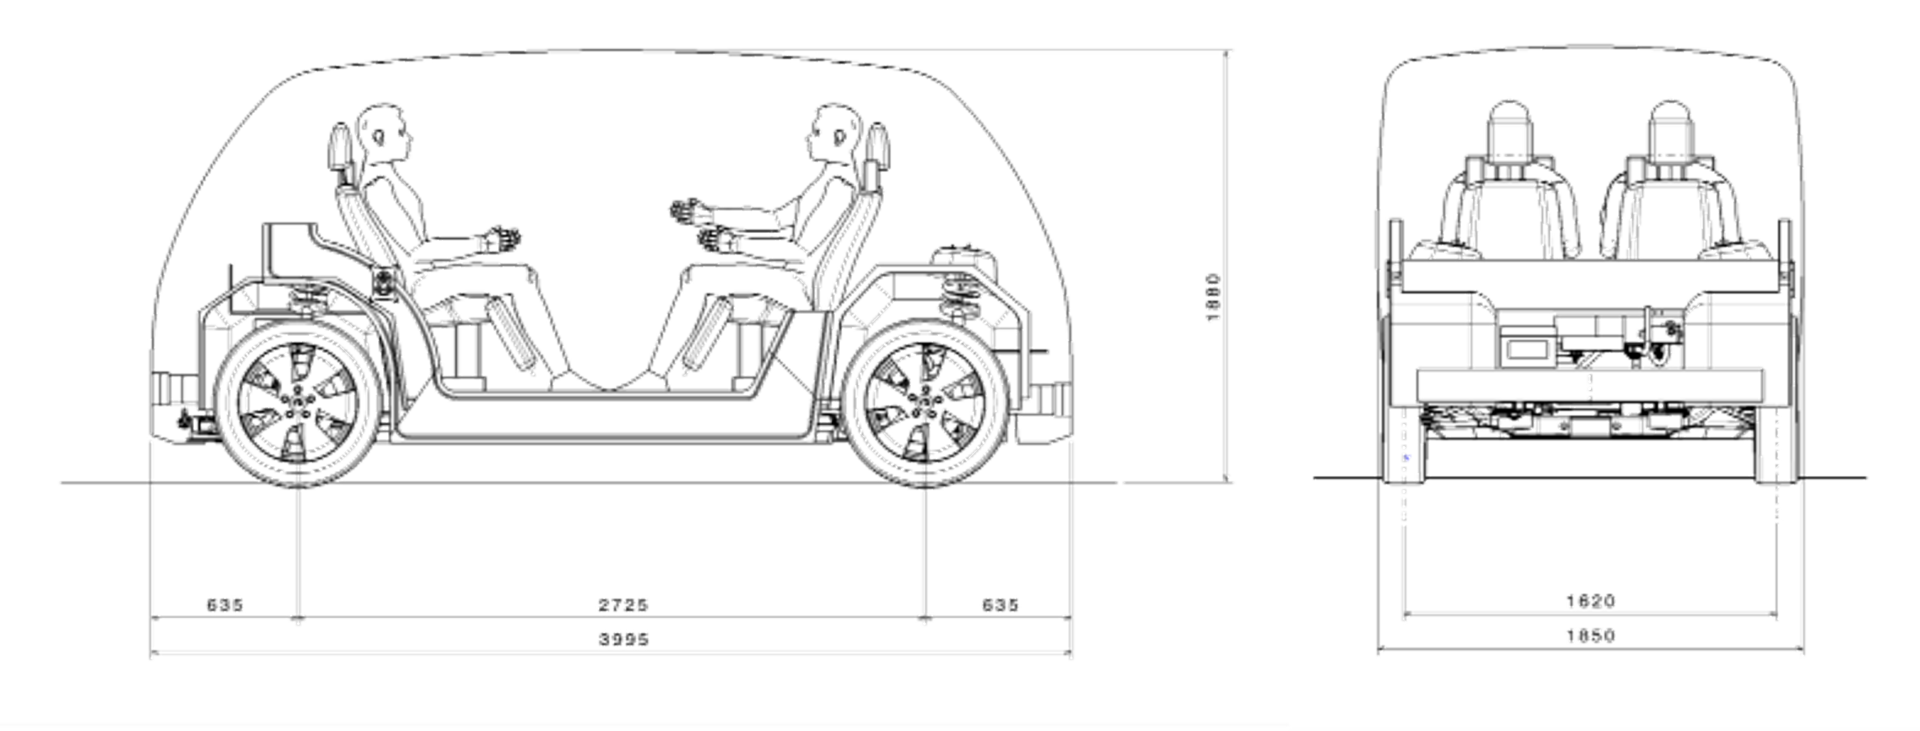
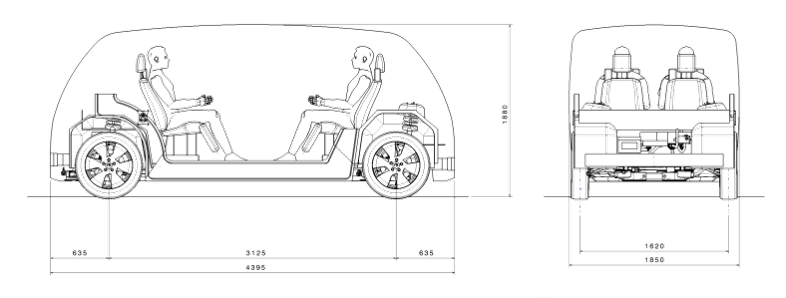
We are producing concepts for two BEVs based on a single modular platform. SEM1 (Figure 1) is a front-wheel drive short wheelbase urban version for inter-city travel for four passengers. It has a compact design and vehicle footprint, comparable in footprint to a European B/C segment size. SEM2 (Figure 2) is an all-wheel drive, long wheelbase extra urban version designed to carry up to six passengers. It has an adaptable interior volume that can result in additional luggage capacity compared to SEM1.
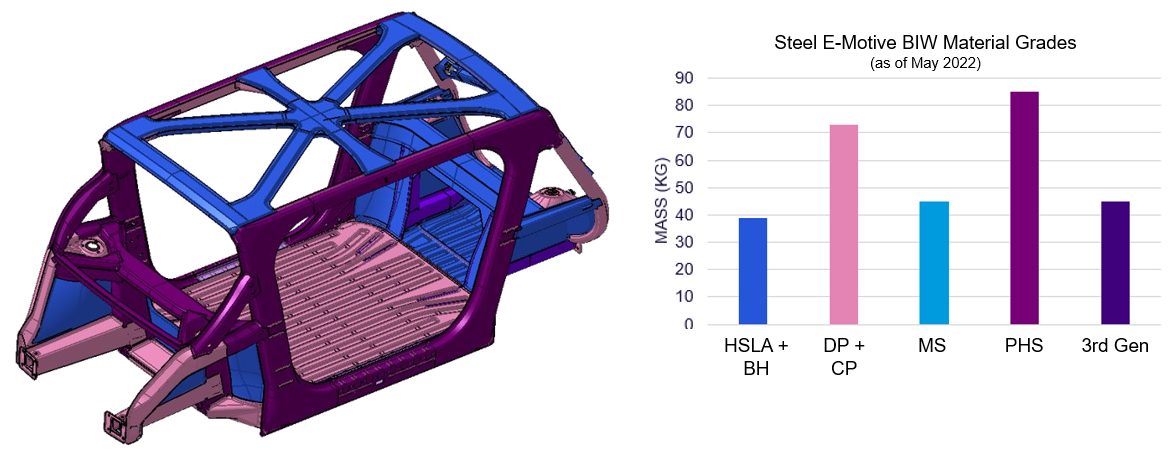
Steel E-Motive benefits from a broad portfolio of steel grades and fabrication process, as identified by our member steel experts. The design is nearly finalized, and material selections are being evaluated against various performance targets with the representative structure shown in Figure 3 with high PHS usage at this stage in the design (as of May 2022). This is mainly driven by the safety requirements. Steel E-Motive BIW steel and steel technologies include:
Right steel grade in the right place
Significant proportion of >1500MPa grades, primarily for occupant and battery intrusion zones
Mixture of stamped, roll formed, roll stamped, press hardened steel and hydroformed parts
Battery modules and cooling plates are mounted to an AHSS carrier frame (off-line).
The carrier frame is mounted to the body structure (in general assembly).
The BIW floor acts as the top cover and provides sealing.
The AHSS bottom cover plate provides impact protection.
This design provides significant cost and weight savings, as well as improved NVH. This extremely efficient package does not compromise safety and enables a flat floor with a lower step-in height.
Competitive Body Stiffness with an Open B-Pillarless Body Structure
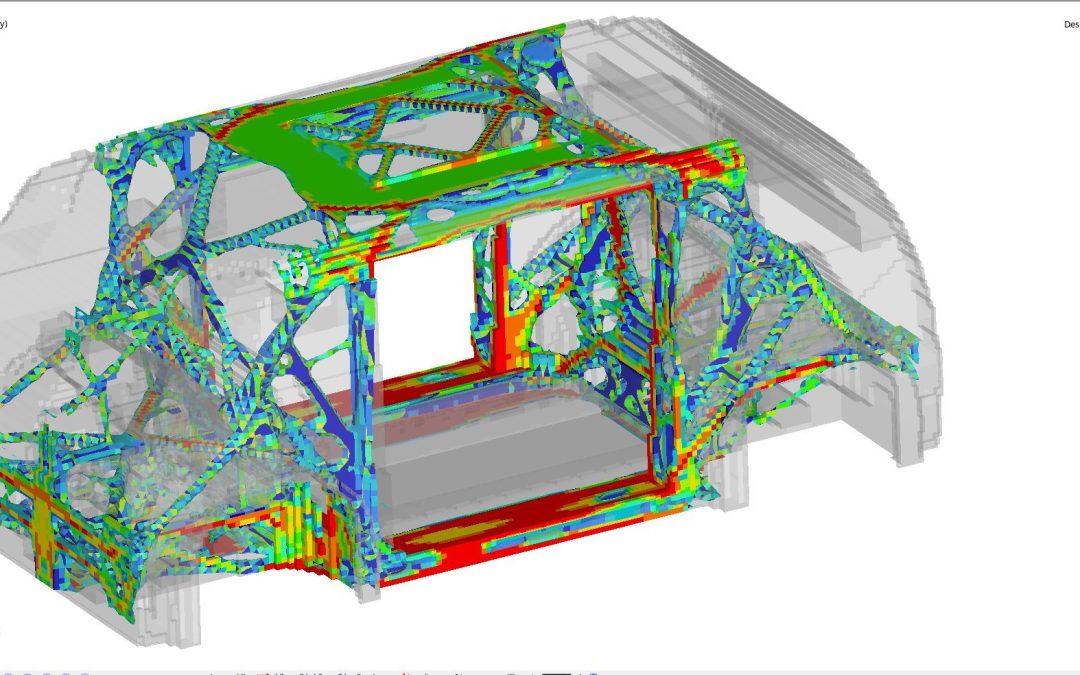
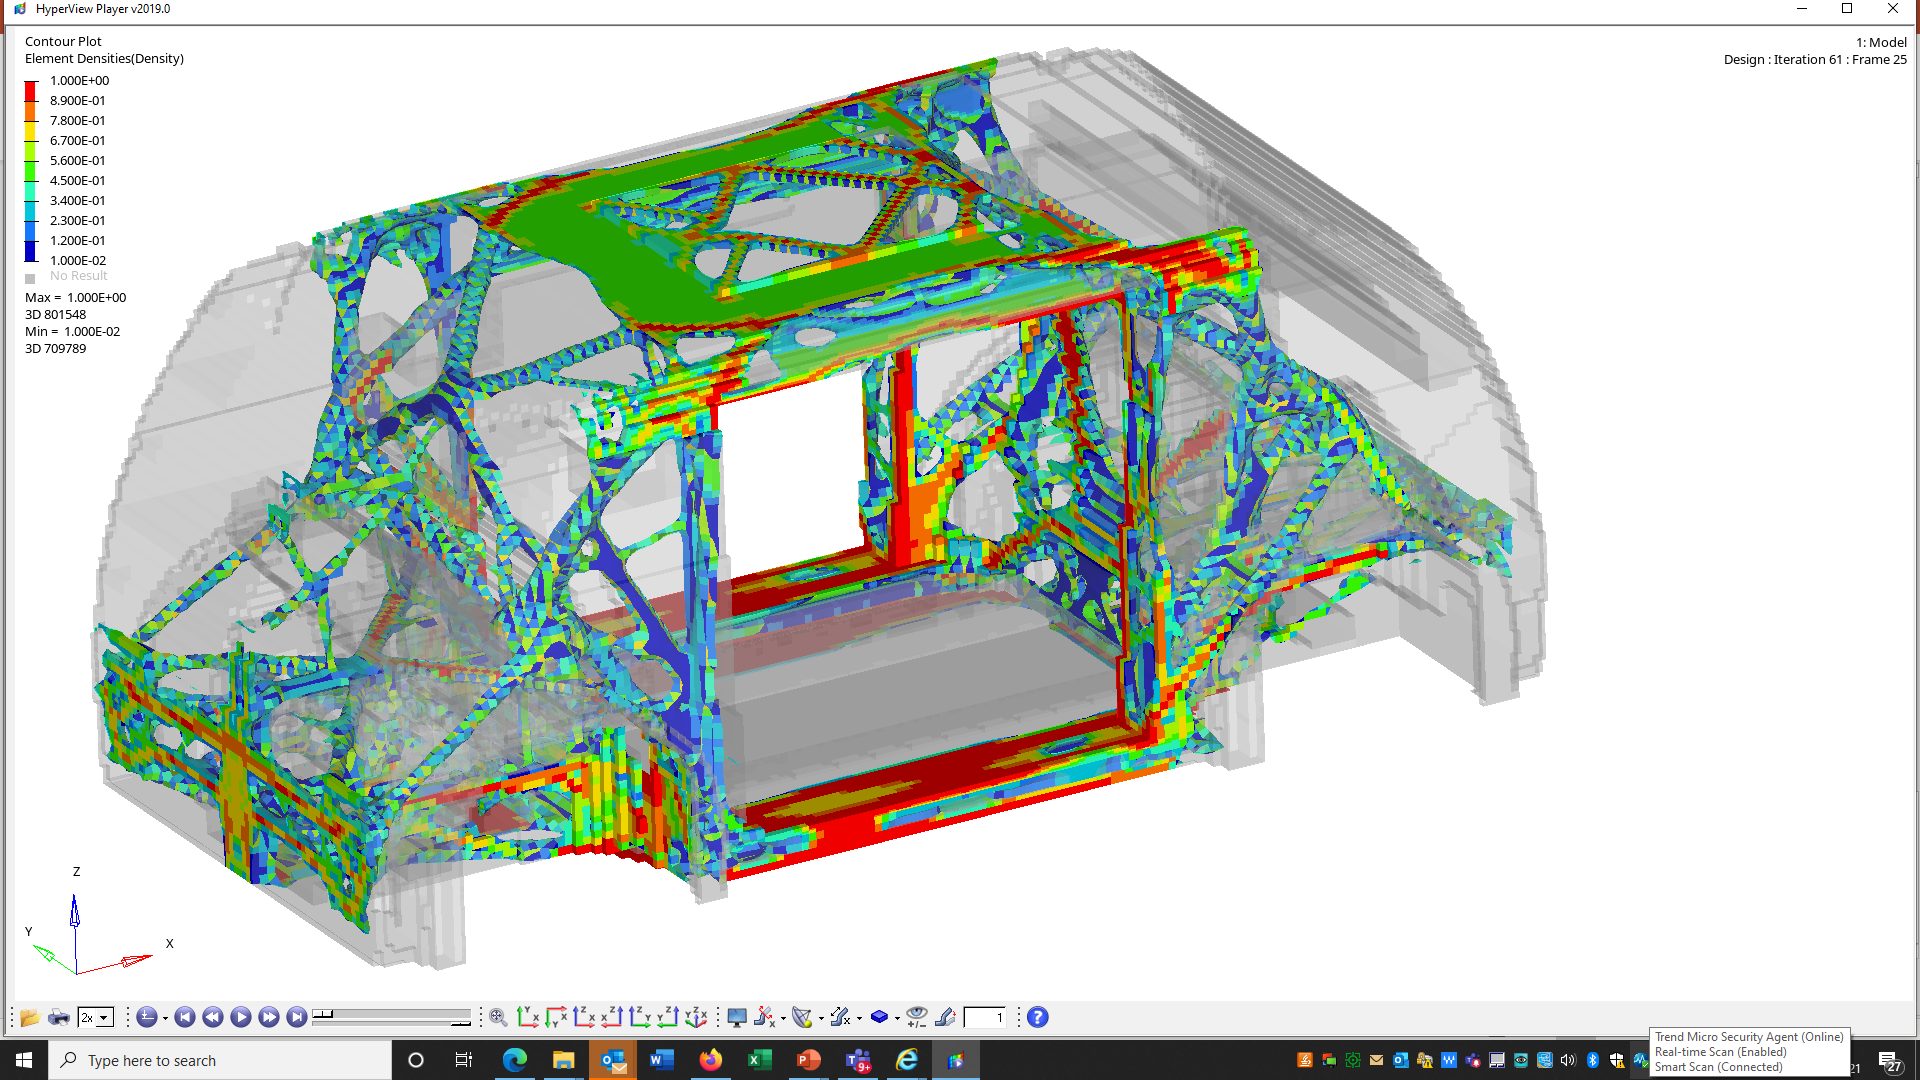
With clean sheet design, and generally less package constraints in a Level 5 vehicle, our design teams have had more freedom to engineer and optimize the crash and stiffness structural loadpaths. We used topology, optimization, and Virtual Reality tools to determine the most efficient structural loadpaths (Figure 5). The results informed the joint designs and enabled optimization of the joining and structural adhesives. These steps and the advantage of steel’s high modulus resulted in impressive performance.
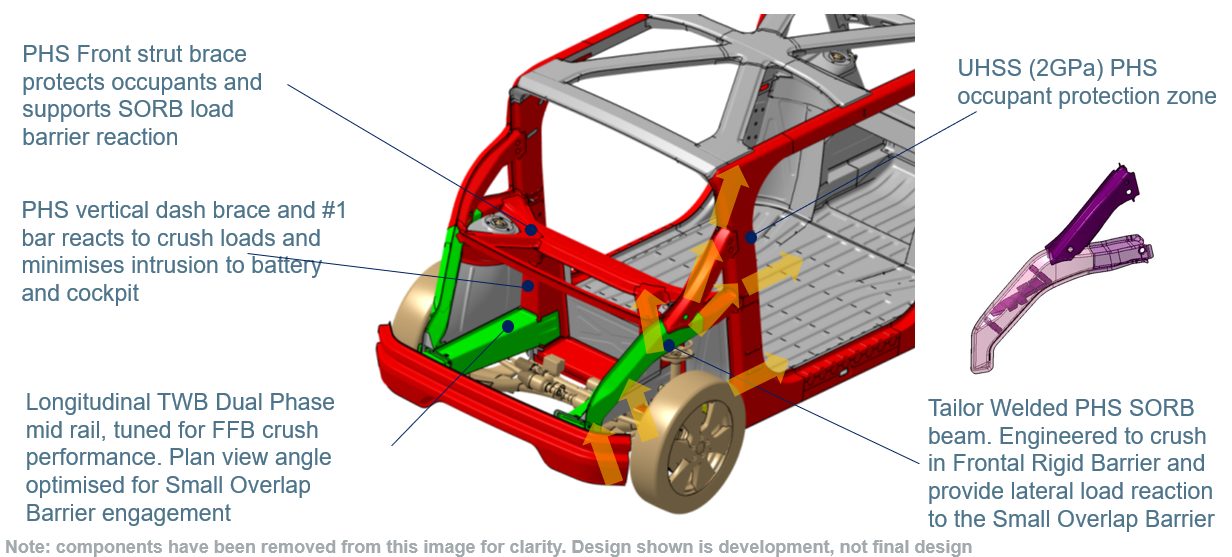
Front Crash Structure Engineered to Balance the Requirements of 56kph USNCAP FFB, IIHS ODB, IIHS SORB and EuroNCAP MPDB Load cases
One of the most challenging aspects of the Steel E-Motive program has been achieving the front crash performance that minimizes occupant injury. The challenge has been compounded by the overall compact size of the vehicle and the short front overhang dimensions, meaning less space to manage and balance the required crush energy with intrusion resistance.
For the IIHS 25% Small Overlap test, we worked from the outset to achieve a barrier “glance off.” The goal is to deflect the vehicle off the barrier by the time the barrier reaches the hinge pillar. This results in a reduced amount of vehicle kinetic energy converted to crush energy. The vehicle continues after the impact with some onward velocity and kinetic energy. This strategy results in reduced intrusion to the passenger compartment and a much lower vehicle pulse (below 20g), which translates into lower occupant injury. We are very excited by this outcome, as in our benchmarking we have not seen many (if any) vehicles of this size managing to achieve a glance off for this test. Figures 7 and the bullets following provide a look at the results.
IIHS “good” rating achieved (based on predicted intrusions).
Our strategy for IIHS Small Overlap test was to achieve a “glance off” the barrier, which is a significant challenge given the vehicle’s short front overhang.
Front suspension engineered to detach on impact. This is important for achieving glance off.
Glance off results in some continued onward vehicle velocity after the impact.
This results in reduced crush energy, lower vehicle pulse and intrusions = enhanced occupant protection
Figure 8 points out features of the front crash structure. Most of the crush energy in FFB and ODB is absorbed by conventional longitudinal mid-rails, which are made of cold stamped, tailor welded blank Dual Phase steels. The plan view angle of the longitudinals has been optimized to provide load reaction early in the SORB event while remaining largely inside of the SORB barrier.
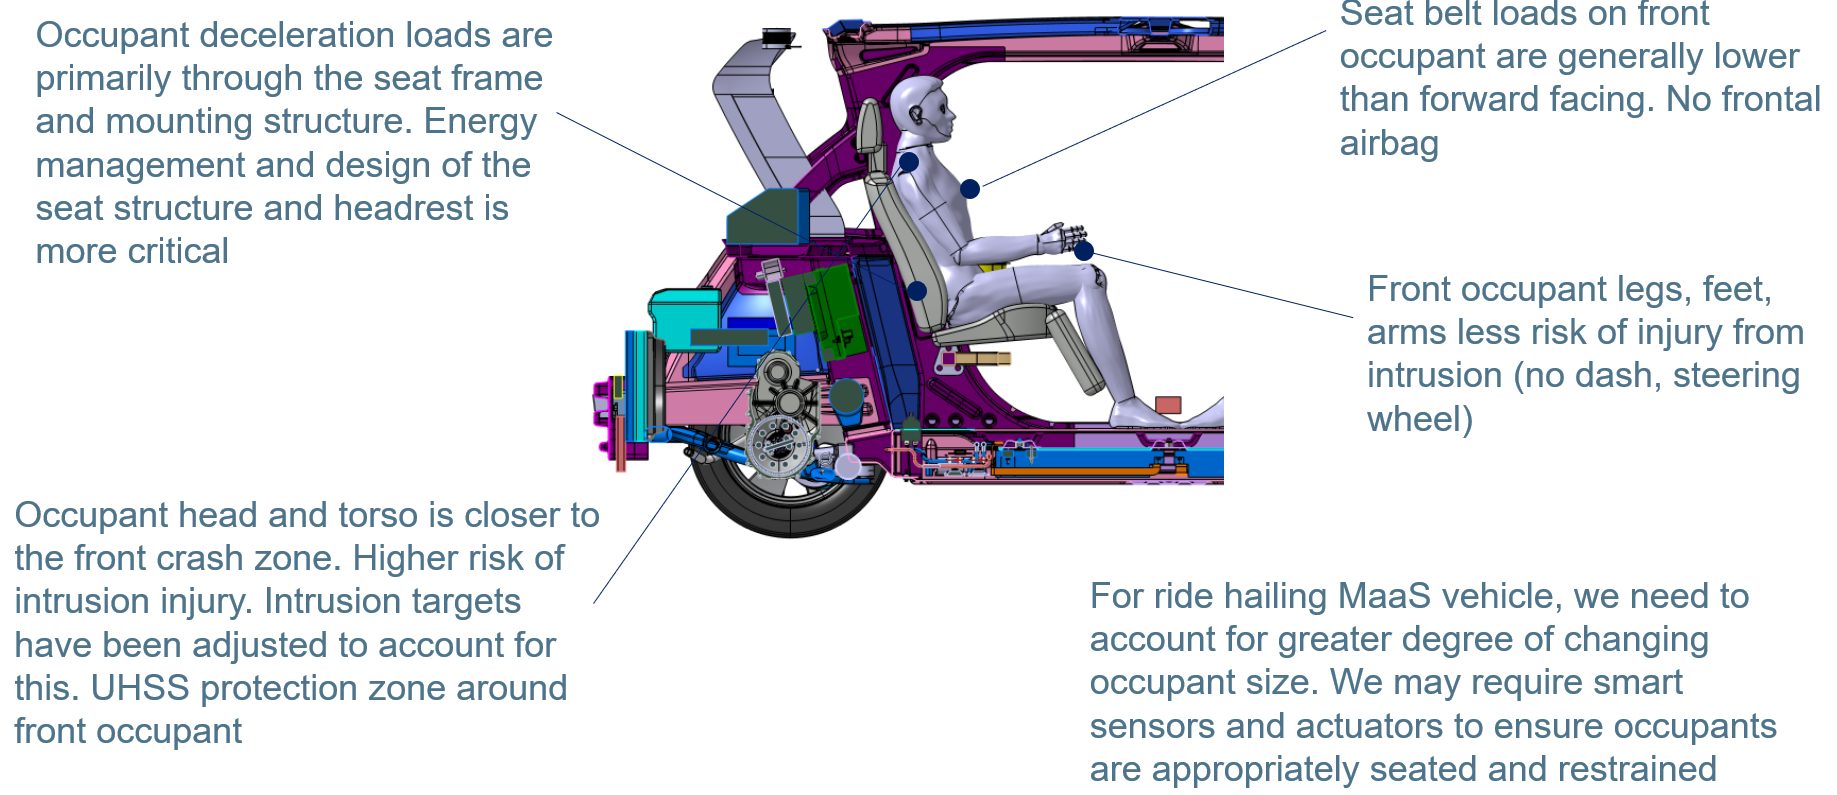
MaaS vehicles will need to accommodate quick ingress and egress as well as provide comfort and safety for the occupants. Consequently, we have flipped the front occupant around to a rear facing configuration and provided a B-Pillarless wide door aperture to enable comfortable and quick access for passengers. This changes the approach required for occupant protection in a front crash. Effectively we are dealing with a high-speed rear impact situation for the occupant. Current rear impact tests cover lower speed rear end shunts. Figure 11 notes the key points and challenges that Steel E-Motive is designed to meet.
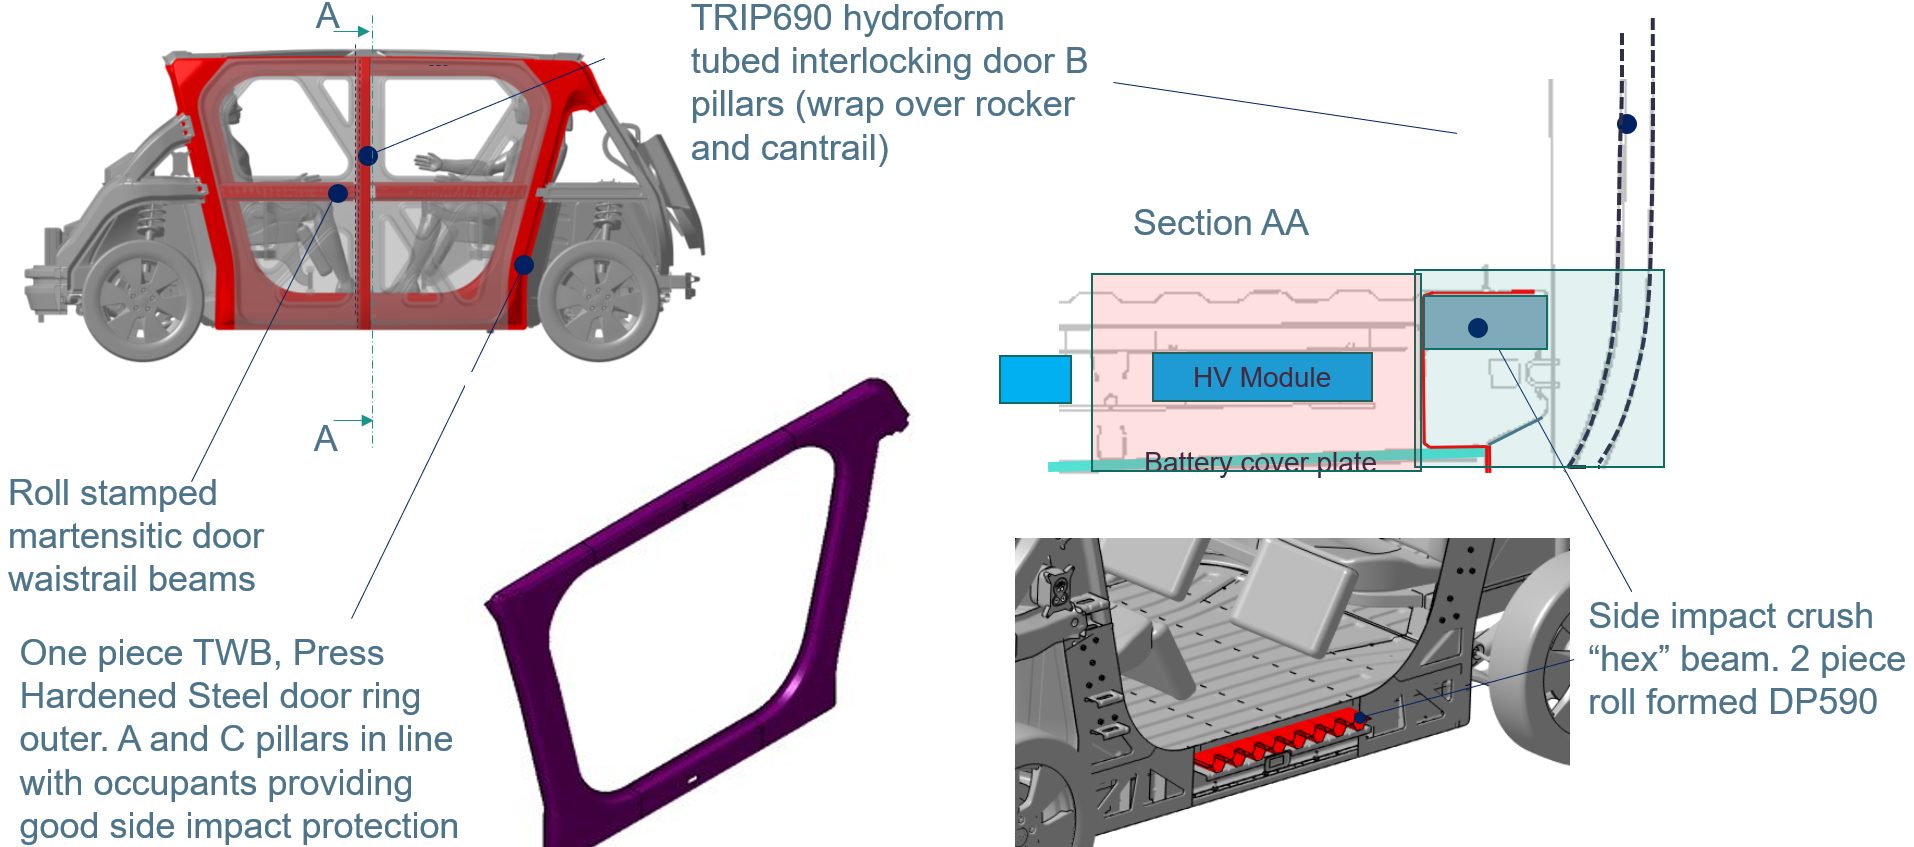
Side Crash Structure Consists of Absorption and Intrusion Prevention Zones, Compensating for Large Body Aperture
The side structure includes roll-stamped martensitic door waist rail beams and a one-piece Tailor Welded Blank, Press Hardened Steel door ring outer. A- and C-pillars in line with occupants provide good side impact protection. (You can learn more about the door design in our May blog).
In the section AA schematic in Figure 12 the TRIP690hydroformed tube interlocking door B-pillar is shown (wrapped over the rocker and cantrail). The load travels through the side impact crush “hex” beam, which is a two-piece roll formed DP590 component.
Steel E-Motive Design Demonstrates Good Side Crashworthiness and Good Levels of Occupant and Battery Protection
In addition to occupant protection tests, additional side impact load cases have been simulated to ensure optimal battery protection. The design maintains a less than 30 mm clearance to the battery.
In reviewing the design according to IIHS standards and based on the predicted intrusions, we are confident this vehicle would achieve an IIHS “good” rating. See Figures 13 and 14 following:
Total Cost of Ownership: Vehicle and Body Is Designed for Conventional Fabrication and Assembly Processes
The Steel E-Motive body has been designed with low cost in mind to provide the foundation for a lower total cost of ownership for fleet owners. The steel body design is optimized to maximize material utilization and minimize scrap rate. Steel E-Motive is suitable for >250,000 units/year production and is compatible with existing global automotive manufacturing facilities using conventional press and fabrication tools. We are also using Life Cycle Assessment as an integral part of the engineering process to ensure that Steel E-Motive is responsible for the lowest possible emissions throughout its entire life cycle. We will report on environmental performance and sustainability as a part of our final results.
Steel E-Motive Key Outcomes
The Steel E-Motive program is delivering an exciting futuristic vehicle, optimized from the ground up for autonomous MaaS application. We are addressing key challenges through careful design, application of simulation tools and efficient use of the latest Advanced High-Strength Steels and fabrication processes. Steel’s inherent characteristics of low production emissions, lightweighting capabilities for mass efficiency, infinite recyclability and product durability underscores its suitability as an integral part of stakeholder strategies to offer sustainable mobility solutions, today and in the future.
Be sure to follow us on our journey as we enter our final months of design, engineering and reporting by subscribing at the Steel E-Motive website. We welcome your questions about this program using the Comment box below.
Our colleagues at JFE Steel recently provided us with a new case study based on laboratory evaluations they conducted in Japan. The article is part of our Martensite article, but we this month, we want to highlight it in our AHSS Insights blog.
Martensitic steel grades provide a cold formed alternative to hot formed press hardening steels. Not all product shapes can be cold formed. For those shapes where forming at ambient temperatures is possible, design and process strategies must address the springback which comes with the high strength levels, as well as eliminate the risk of delayed fracture. The potential benefits associated with cold forming include lower energy costs, reduced carbon footprint, and improved cycle times compared with hot forming processes.
Highlighting product forms achievable in cold stamping, an automotive steel Product Applications Laboratory formed a Roof Center Reinforcement from 1.4 mm CR1200Y1470T-MS using conventional cold stamping rather than roll forming, Figure 6. Using cold stamping allows for the flexibility of considering different strategies when die processing which may result in reduced springback or incorporating part features not achievable with roll forming.
Figure 6: Roof Center Reinforcement cold stamped from CR1200Y1470T-MS martensitic steel.U-1
Cold stamping of martensitic steels is not limited to simpler shapes with gentle curvature. Shown in Figure 7 is a Center Pillar Outer, cold stamped using a tailor welded blank containing CR1200Y1470T-MS and CR320Y590T-DP as the upper and lower portion steels.U-1
Figure 7: Center Pillar Outer stamped at ambient temperature from a tailor welded blank containing 1470 MPa tensile strength martensitic steel.U-1
Another characteristic of martensitic steels is their high yield strength, which is associated with improved crash performance. In a laboratory environment, crash behavior is assessed with 3-point bending moments. A studyS-8 determined there was a correlation between sheet steel yield strength and the 3-point bending deformation of hat shaped parts. Based on a comparison of yield strength, Figure 8 shows that CR1200Y1470T-MS has similar performance to hot stamped PHS-CR1800T-MB and PHS-CR1900T-MB at the same thickness and exceeds the frequently used PHS-CR1500T-MB. For this reason, there may be the potential to reduce costs and even weight with a cold stamping approach, providing appropriate press, process, and die designs are used.
Figure 8: Effect of Yield Strength on Bending Moment. The right image shows the typical yield strength range of CR1030Y1300T-MS and CR1200Y1470T-MS as well as typical yield strength values of several Press Hardened Steels.S-8


 Thanks are given to