Forming Modes
Stamping and die designers are interested in the forming capabilities of the steels they specify. Complex stampings are created from several different basic forming modes, which are sensitive to different mechanical properties. For this reason, steel formability, especially for AHSS grades, cannot be characterized by a single number, but instead must be done for each basic forming mode.
Forming modes and key points include:
Stretching
- Stretching is the sheet metal forming process where the punch which creates the part shape forces the sheet metal to thin since lock beads prevent metal flow inward from the flange area.
- The steel property that improves stretching is the strain hardening exponent, or n-value.
- Dome testing characterizes stretchability.
- Higher n-values flatten strain gradients, reduce localized thinning that leads to early failure, and allows the forming of more complex parts.
Bending
- Tensile testing cannot be used to determine bendability, since these are different failure modes. Different bend tests characterize bendability.
- The failure strain in the bend is related to the total elongation of conventional steel, but are limited by other issues in AHSS grades.
- For equal strengths, most AHSS grades have higher total elongations than conventional HSLA steels. However, several AHSS grades have limited local formability based on their microstructure, and may be at risk for cracking during edge expansion. AHSS grades with multiphase microstructures such as DP and TRIP experience shear fracture that severely reduces the bendability before failure occurs.
Drawing
- Drawing is the sheet metal forming process where the punch that creates the part shape forces the sheet metal to pull in from the flange area.
- The steel property that improves cup drawing or radial drawing is the normal anisotropy or rm value.
- The Limiting Draw Ratio (LDR) characterizes cup drawability.
- Higher r-value increases the LDR, but the absolute value of the LDR also depends on the lubrication, blank holder load, die radius and other system inputs.
![Tensile Testing]()
Testing and Characterization
topofpage
Tensile testing characterizes the forming and structural behavior of sheet metals. The test involves loading a sample with a well-defined shape along the axis in tension, generally to fracture, and recording the resultant load and displacement to calculate several mechanical properties. Global standardsI-7, A-24, D-19, J-15 prescribe the conditions under which tests must occur.
Sample Size and Shape
Full-size samples for tensile testing of metal sheets have a rectangular section at the edges for gripping by the test machine. Reducing the width in the central area promotes fracture in the monitored region. These geometrical features result in a sample shape which resembles a dogbone, leading to a descriptive term applied to test samples.
Dimensions of the dogbone samples are associated with tensile test standard from which they apply. ISO I, II, and III (described in Citation I-7) corresponds to the ASTMA-24, DIND-19, and JISJ-15 shapes, respectively. Figure 1 shows the dogbone shapes, highlighting the critical dimensions of width and gauge length. Refer to the Test Standards for other dimensions, tolerances, and other requirements.

Figure 1: Full-size tensile sample shapes for ISO I (ASTM), ISO II (DIN), and ISO III (JIS) standards.I-7, A-24, D-19, J-15
Significant differences exist in the width and gauge length of these tensile bar shapes. Although the ASTM and JIS bars have similar gauge length, the width of the JIS bar is twice that the ASTM bar. The ASTM and DIN bars have a 4:1 ratio of gauge length to width, where the JIS bar has a 2:1 ratio.
These shape differences mean that the calculated elongation changes depending on the test-sample standard used, even when testing identical material. With the combination of the shortest gauge length and widest sample, elongation from JIS bars typically are higher than what would be generated from the other shapes.
Yield strength and tensile strength are not a function of the shape of the tensile bar. Strength is defined as the load divided by the cross-sectional area. Even though each of the bars specify a different sample width (and therefore different cross-section), the load is normalized by this value, which negates differences from sample shape.
Shearing or punching during sample preparation may work-harden the edges of the tensile bar, which may lead to generating an inaccurate representation of the mechanical properties of the sheet metal. Test Standards require subsequent machining or other methods to remove edge damage created during sample preparation. Milling or grinding the dogbone samples minimizes the effects sample preparation may have on the results.
Tensile Test Procedure
The gauge length is the reference length used in the elongation calculations. Depending on the test standard, the gauge length is either 2 inches, 80 mm, or 50 mm. Multiplying the width and thickness within the gauge length determines the initial cross-sectional area before testing.
Grips tightly clamp the edges of the sample at opposite ends. As the test progresses, the grips move away from each other at a prescribed rate or in response to the restraining load. A load cell within the grips or load frame monitors force. An extensometer tracks displacement within the gauge length. Samples are typically tested until fracture.
During the tensile test, the sample width and thickness shrink as the length of the test sample increases. However, these dimensional changes are not considered in determining the engineering stress, which is determined by dividing the load at any time during the test by the starting cross-sectional area. Engineering strain is the increase in length within the gauge length relative to the starting gauge length. (Incorporating the dimensional changes occurring during testing requires calculating true stress and strain. The differences between engineering and true stress/strain are covered elsewhere (hyperlink to 2.3.2.1-Engineering/True)
A graph showing stress on the vertical axis and strain on the horizontal axis is the familiar engineering stress-strain curve, Figure 2. From the stress-strain curve, numerous parameters important for sheet metal forming appear, including:

Figure 2: Engineering stress-strain curve from which mechanical properties are derived.
Influence of Test Speed
Conventional tensile testing is done at strain rates slow enough to be called “quasi-static.” These rates are several orders of magnitude slower than the deformation rates during stamping, which itself is several orders of magnitude slower than what is experienced during a crash event.
Stress-strain curves change with test speed, typically getting stronger as the speed increases. The magnitude of these changes varies with grade. Significant challenges exist when attempting to characterize the tensile response at higher strain rates. Improved equipment and data collection capabilities are among the required upgrades.
Influence of Tensile Test Equipment
Advanced High-Strength Steels (AHSS) may challenge older test equipment. The load and displacement response must reflect only the contributions of the sheet metal, and not be influenced by the load frame and other testing equipment. In much the same way that insufficiently stiff press crowns deflect when stamping AHSS parts, tensile test load frames may similarly deflect, resulting in inaccuracies in the load-displacement measurements.
Grip strength also becomes critical when testing AHSS samples. The high strength of the metal sheets requires more grip pressure to prevent sample slippage through the grips. Pneumatic grips and even some mechanical grips may not generate the necessary pressure. Hydraulically actuated grips may be necessary as the strength increases.
Back to the Top
![Tensile Testing]()
Friction, Testing and Characterization
Friction is a restraining force that limits metal flow resulting from contact with another surface during sheet forming. Friction is influenced by the complex interaction between the sheet steel, lubricant, and tooling material, as well as many parameters of the forming system, some of which are shown in Figure 1.

Figure 1: Friction is influenced by the complex interaction between the sheet steel, lubricant, and tooling material, as well as many parameters of the forming system. (image modified from Citation K-13)
Friction changes throughout the stamping process as well as across the part, since there are changes in contact pressure, contact temperature, geometry, the sheet steel strength (work hardening), and even the sheet metal surface due to flattening of the peaks after flowing over beads and radii. There is no one friction value that applies to all geometries and forming scenarios that can be encountered.
Characterizing friction in a simulative test is similarly challenging, since there is no one simulative test that approximates all regions of an engineered stamping. For many years, tooling, design, and simulation engineers used one friction value for each galvanized coating / lubricant combination, and applied that value across every part stamped from that metal with that lubricant. The industry has evolved to using different tests to generate friction values appropriate for different forming conditions.
Simulative tests to characterize friction include test to reflect bending under tension, pulling through draw beads, and movement over flat surfaces. Depending on the test, it may be possible to evaluate the effect of tooling material, temperature, radii, and speed in order to better simulate production conditions. Figure 2 indicates which of these simulative tests apply to the regions of an in-process stamping. The value obtained in one test is a function of only those specific test conditions and should not be compared against values obtained in other tests.
- Bending Under Tension test: In the Bend Under Tension (BUT) test, a metal strip is drawn over a fixed cylindrical pin with a pair of independently controlled hydraulic actuators offset by 90 degrees. Two load cells measure the pulling force and back tension force. (Figure 3)
- Draw Bead test: Two sets of tests are done using a Draw Bead Simulator (DBS). In the first test, the force to pull sheet steel through a set of fixed draw beads is measured and reflects both the bending and unbending forces as well as the friction forces. Another sample is pulled through frictionless roller beads in a similar arrangement. Here, only the bending/unbending forces are active. Subtracting the results allows for determination of the forces due solely to friction. (Figure 4)
- Strip Draw: In the Strip Draw test, friction is determined by pulling sheet steel through opposing flat platens. The restraining condition is controlled by the force applied on the flat platens. The influence of bending is not considered in this test. (Figure 5)
Other tests are also used to provide some assessment of formability. Dome Testing simulates stretch forming conditions and can provide a relative comparison between different materials and lubricants. The Twist Compression Test (TCT) is used to compare the performance of different lubricants under controlled, repeatable conditions. Lubricant breakdown, which results in adhesion between the tool and the sheet steel, can be evaluated in the TCT.

Figure 2: Pertinent Simulative Tests During Stamping (image modified from Citation S-42)

Figure 3: The Bending Under Tension Test (image modified from Citation S-42)
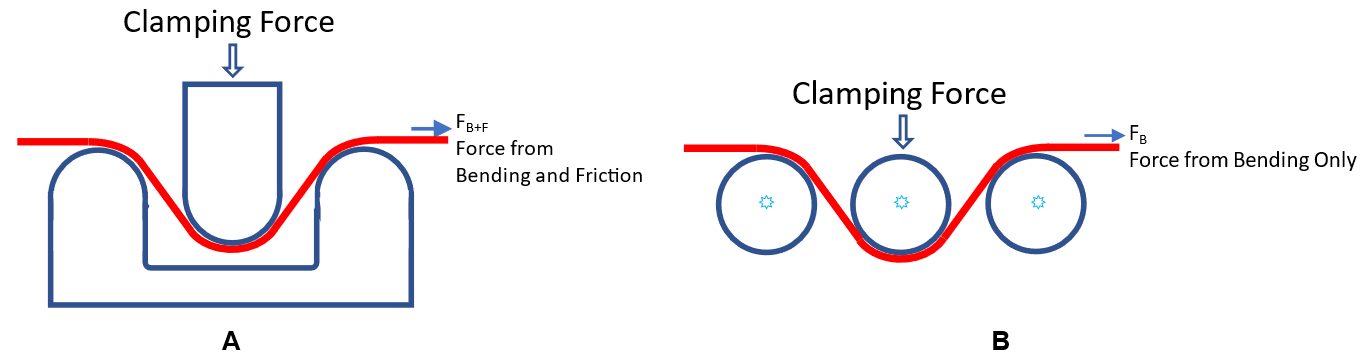
Figure 4: Draw Bead Simulator Testing determines the effect of friction from the differences in pulling force in two test conditions.
a) The strip pulled through fixed draw beads experiences restraining forces due to bending/unbending as well as forces due to friction.
b) The strip pulled through frictionless roller beads experiences restraining forces due only to bending/unbending.

Figure 5: The Strip Draw Test (image modified from U-6)
Blog, main-blog
The Beginnings of PHS Use
Press hardening, as we know it today, was developed in Luleå, Sweden, by Norrbottens Järnverks AB (abbreviated as NJA, translated as Norrbotten Iron Works). The first patent application was completed in 1973 and awarded in 1977.N-23 The technology was first commercialized in agriculture components, where the high strength of Press Hardened Steels (PHS) was favored for wear resistance.B-45
In 1984, automotive applications of PHS started with the Saab 9000 side impact door beams, as seen in Figure 1. A total of 4 parts were used in this car.A-66 The uncoated blanks were almost half the thickness of a cold stamped beam.T-26
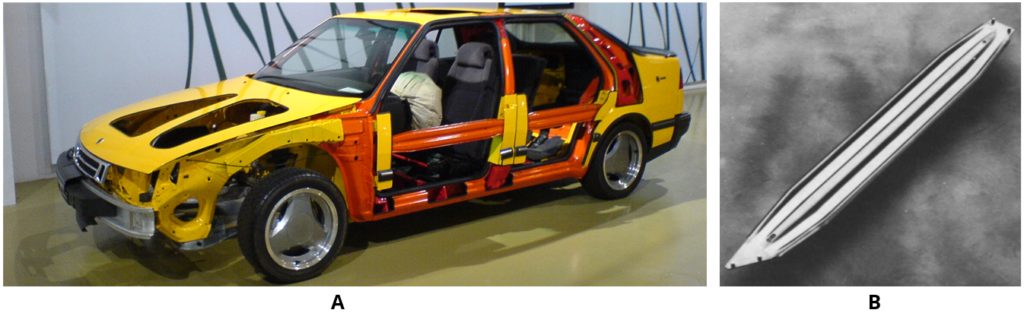
Figure 1: Door beams of the Saab 9000 (1984-1998): (a) A see-through car in Saab MuseumS-82, (b) the hot stamped part.L-42
The majority of the PHS parts were door beams through the mid-1990s, with approximately 6 million beams produced in 1996. By this time, the demand for bumper beams was also increasing.F-31 By the end of 1996, the European New Car Assessment Program (EuroNCAP) was formed, which increased the pressure on the OEMs for improved crashworthiness.T-26 In 1998, both the new Volvo S80L-44 and Ford Focus5 were equipped with Press Hardened bumper beams.
The year 1998 saw the development of one of the most important breakthroughs in Press Hardening technology. French steel maker Usinor developed an aluminum-silicon (AlSi) pre-coated steel, commercialized as Usibor 1500 (indicating the typical tensile strength, 1500 MPa.C-24, L-39 In 2000, BMW rolled out its new 3 series convertible. In this vehicle, the A-pillar is made from 3 mm thick uncoated, PHS sheet. This was BMW’s first PHS application, and one of the first PHS A-pillar reinforcement.S-83, S-84 Accra started delivering roll formed PHS components for the Volvo V70, initially an optional 3rd row seating support. Approximately 10,000 parts/year were supplied.G-28
AlSi coated steel was first hot stamped at a French Tier 1 supplier, Sofedit.V-15 This grade was first used in the front bumper beam of the 2nd Generation Renault Laguna (2000-2007). Laguna 2 was the first car to receive a 5-star safety rating from Euro NCAP.V-10 AlSi coated blanks were also used in PSA Group’s Citroën C5 (1st Gen: 2001-2007) in the front bumper beam, and the A-pillars. These three parts weighed a total of 4.5 kg, approximately 1% of the total BIW weight, Figure 2a. About one month later, PSA Group started production of the compact hatchback Peugeot 307, which had five hot stamped components (A- and B-pillars and rear bumper beam). Unlike the Citroën C5, these parts were uncoated. The total weight was 12 kg, corresponding to 3.4% of the BIW weight.R-17, P-27
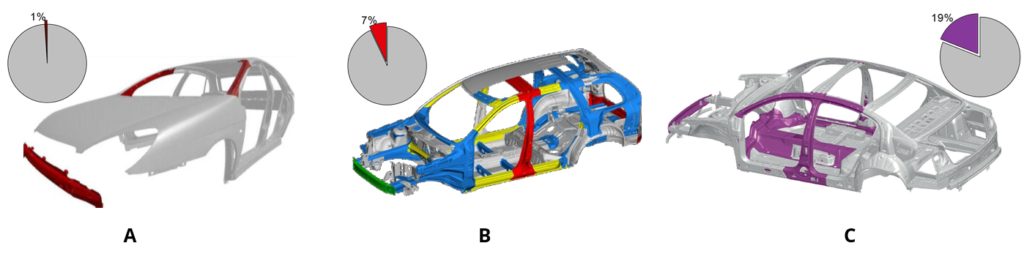
Figure 2: Increase in press hardened component usage: (a) 2001 Citroën C5P-27, (b) 2002 Volvo XC90L-29 and (c) 2005 VW Passat.H-50
Volvo started producing the XC90 SUV in 2002. The body-in-white with doors and closures weighed 531 kg.B-44 A total of 10 parts, weighing 37 kg are either roll formed or direct stamped PHS. This accounts for approximately 7% of the BIW weight.L-43 During its time, this was the highest use of PHS in car bodies. In Figure 2b, the Press Hardened components other than the 2nd row seat frame, which is a load bearing body part, are shown.
Accelerated Use and Globalization
The use of press hardened parts increased rapidly after the introduction of the VW Passat in 2005. This car had approximately 19% of its BIW (by weight) made from press hardened steels, Figure 2c. Some parts in this car saw the first use of varnish coated blanks in a two-step hybrid process. Three parts were produced using either an indirect or hybrid process, including the transmission tunnel.H-50
Following are a few highlights of PHS use in vehicle applications during this time period :
- In 2006, the Dodge CaliberK-37 and BMW X5P-28 were among the first cars to have tailor-rolled and Press Hardened components in their bodies (Figure 3).
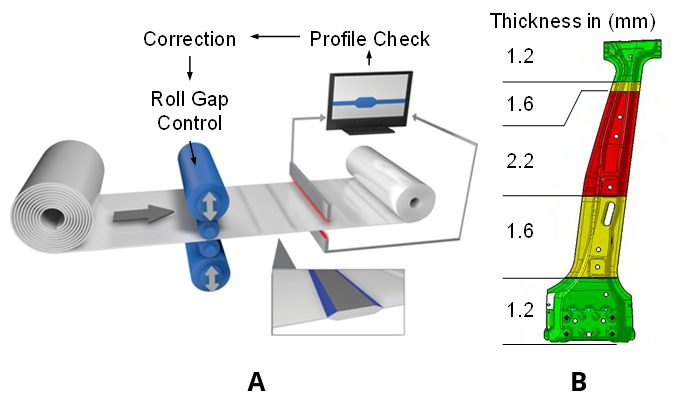
Figure 3: (a) Tailor Rolling ProcessZ-5, (b) B-pillar of BMW X5 (2nd Gen: 2006-2013).P-28
- BMW 7 Series (5th Gen: 2008-2015) became the first car to have Zn-coated Press Hardened components in its body-in-white. The car also contained uncoated parts, as shown in Figure 4 (next page). The total PHS usage in this car was approximately 16%.P-20
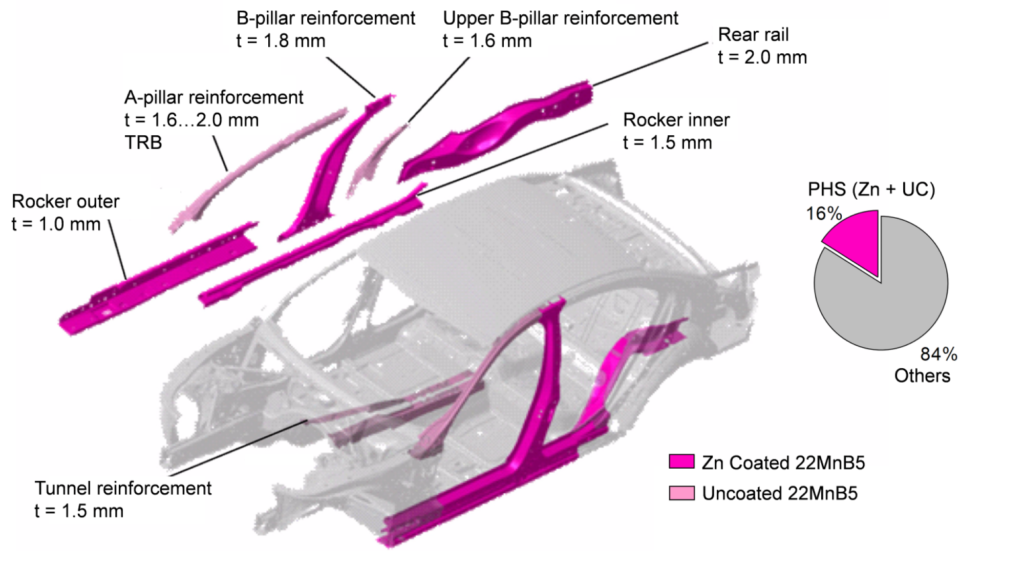
Figure 4: PHS usage in BMW 7 Series (5th Gen: 2008-2015) (re-created using P-20).
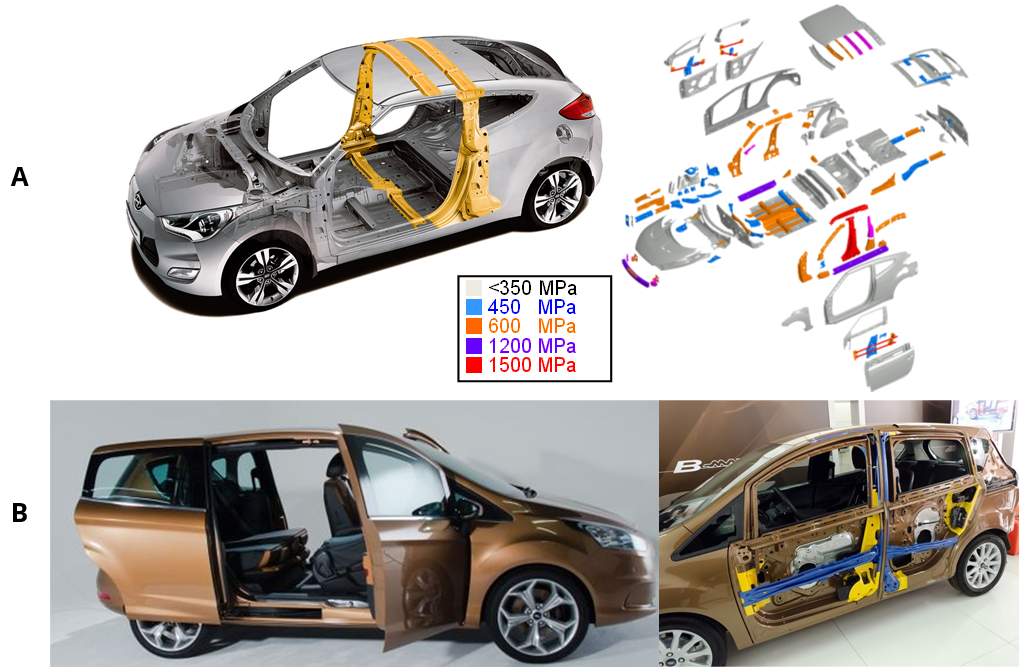
- Press hardening also allowed car makers to create unconventional cars. In 2011, Hyundai rolled out the 1st generation Veloster, a 3-door coupé (also known as 2+1, with one door on the driver side and 2 doors on the passenger side), and as such containing axisymmetric front doors. Thus, the car could not have a full B-ring, as illustrated in Figure 5a.B-14, R-19 Another unconventional design was the Ford B-Max subcompact MPV sold in Europe between 2012 and 2017. The car had conventional swing doors in the front and two sliding rear doors. A PHS B-pillar was integrated in the doors, providing ease of ingress. Its PHS components (integrated B-pillar in front and rear doors, door beams and cantrail) are shown with blue color in Figure 5b.B-14, L-45

Figure 5: Unconventional car designs with PHS: (a) Hyundai Veloster, asymmetric 2+1 doors coupé (re-created after Citation R-19), and (b) Ford B-Max, sub-compact MPV with integrated B-pillars in the doors.L-45
In 2013, the Acura MDX (3rd Gen: 2013-2020) became the first car to have a Hot Stamped door ring. The part was a tailor welded blank comprised of two sub-blanks, as shown in Figure 6a. The design saved about 6.2 kg weight per car and had high material utilization ratio thanks to sub-blank nesting optimization.A-67, M-46 One of the most recent PHS applications was in 2017 Chrysler Pacifica with 5 sub-blanks, as shown in Figure 6b. This car also has a PQS550 sub-blank at the lower B-pillar region.D-28
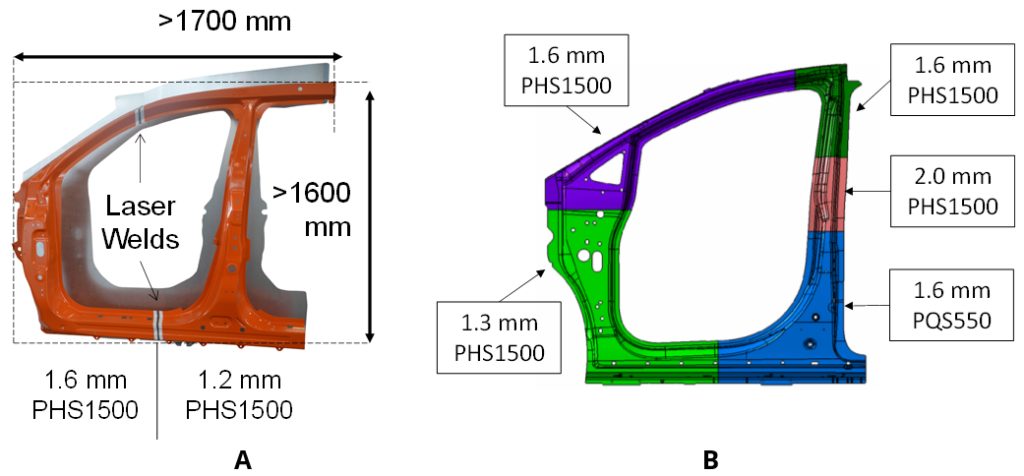
Figure 6: Hot stamped door rings: (a) First application in 2013 Acura MDX had 2 sub-blanks, (b) a more recent application in 2017 Chrysler Pacifica has five sub-blanks with PQS550 at the lower B-pillar (re-created after Citations B-14, A-67, D-28).
- Tubular hardened steels have been long used in car bodies, with minimal forming. Since 2013, a special 3-D hot bending and quenching (3DQ) process has been employed. One of the earliest uses of this technology was Mazda Premacy (known as Mazda 5 in some markets). The same process was also used in making the A-pillars of the Acura NSX (Honda NSX in some markets, 2016-present), as seen in Figure 7a.H-29 Since 2018, tubular parts formed with internal pressure, called form blow hardened parts, are used in the Ford Focus (4th Generation) (Figure 7b) and Jeep Wrangler (4th Generation).B-16, B-17
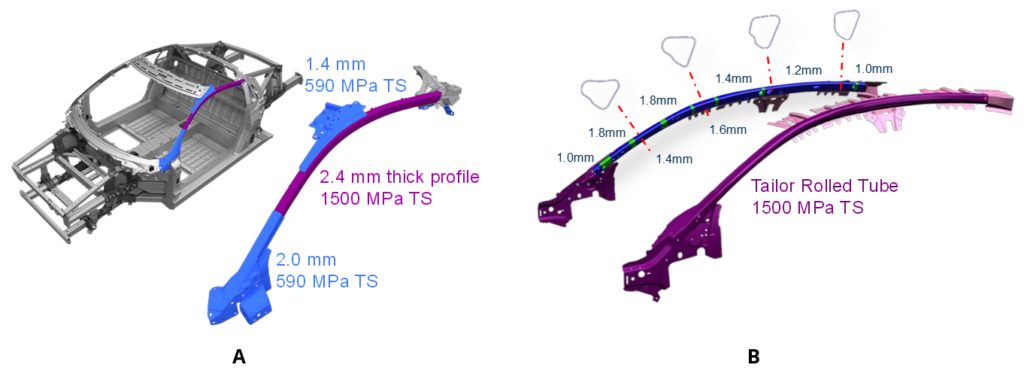
Figure 7: Tubular hardened steel usage in A-pillars of: (a) 2015 Acura NSXH-29, (b) 2018 Ford Focus.B-16
PHS Use in xEVs: Hybrid Electric, Battery Electric,
Plug-in Hybrid Electric & Fuel Cell Electric Vehicles
The first commercially available Hybrid Electric Vehicle (HEV) was the Toyota Prius (1st Gen: 1997-2003). The second-generation Prius (2003-2009) had very few Press Hardened components, as shown with red color in Figure 8a. This was the first time Toyota used hot stamped components.M-47 The third generation Prius (2009-2015) had approximately 3% of its BIW Press Hardened. In the 4th generation Prius released in 2015, the share of >980 MPa steels has risen to 19%.U-10 Figure 8b shows the Press Hardened parts in this latest Prius.K-38
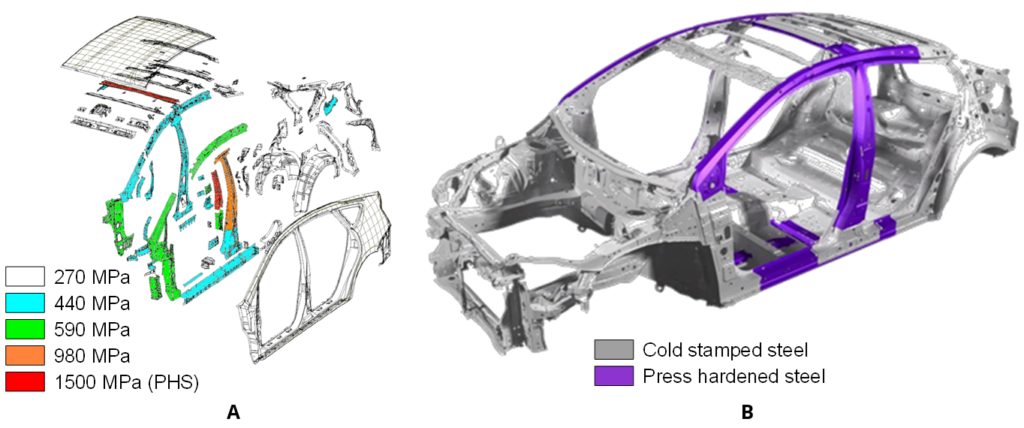
Figure 8: PHS usage in Toyota Prius: (a) 2nd generation (2003-2009) and (b) 4th generation (2015-present) (re-created after Citations M-47 and K-38)
The 2012 Tesla Model S and Model X launched using aluminium bodies, with PHS reinforcements in the pillars and the bumpers. Model S is known to have a roll-formed PHS bumper beam. High volume Model 3 and Model Y have a significant amount of press hardened components in their bodies.T-35
In 2011, General Motors started production of its first Plug-in Hybrid Electric Vehicle (PHEV), the Chevrolet Volt (known as Opel Ampera in EU and Vauxhall Ampera in the UK). This car had six Hot Stamped components, including A and B pillars, accounting for slightly over 5% of the BIW mass.P-29
The smaller BEV Chevrolet Bolt, launched in 2017, had aluminum closures, but a steel-intensive BIW that is 80% steel, 44% of which is Advanced High-Strength Steels including 11.8% PHS. Figure 9.A-69
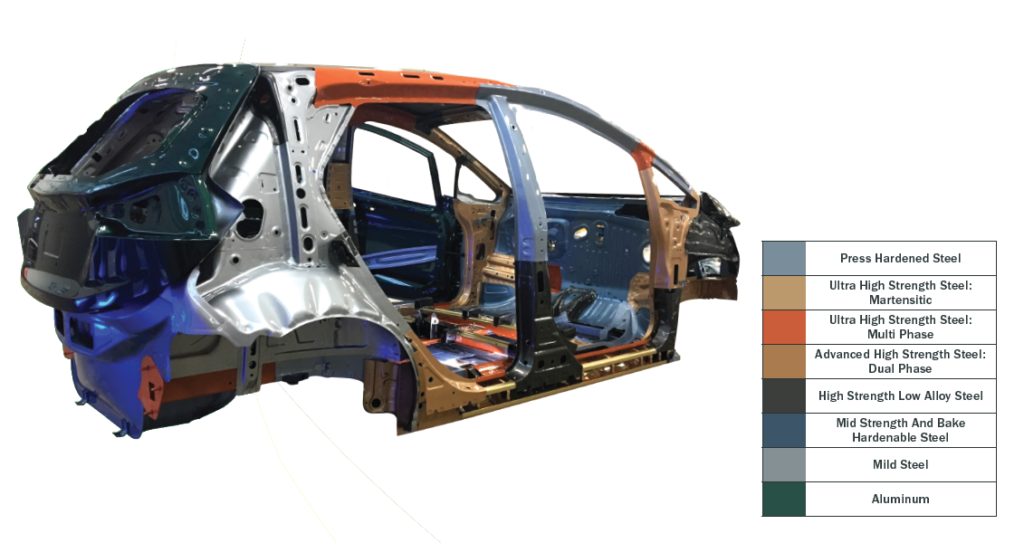
Figure 9: Chevrolet Bolt Body Structure and Steel Content.A-69
In December 2020, Hyundai announced their new electric platform, E-GMP. The platform will utilize Press Hardened steel components to secure the batteries.H-52
Automakers have turned to PHS to manage the extra load of Fuel Cell powertrains as well. The first-generation Toyota Mirai had only Press Hardened B-pillars, cantrails and lateral floor members.T-38 The second generation has a number of parts with PHS in its under body as well.T-39
In 2018, Hyundai Nexo became the first fuel-cell car to be tested by EuroNCAP, achieving a 5-Star rating. The car has PHS A- and B-pillars, rocker reinforcements, and several under body components, as seen in Figure 10.H-53
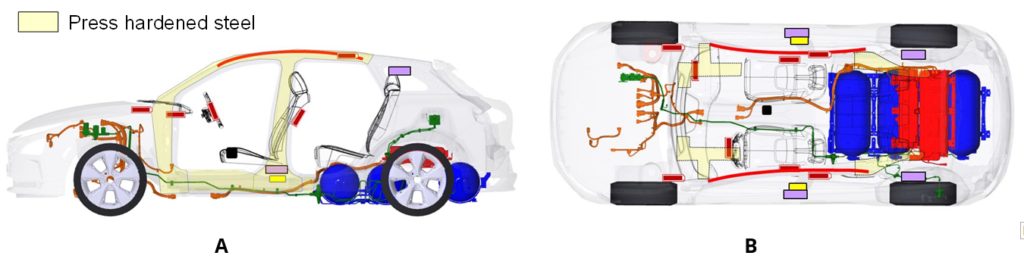
Figure 10: Press hardened steel usage in Hyundai Nexo Fuel Cell vehicle: (a) side view and (b) top view (re-created after Citation H-53).
Did you enjoy this story? You can find a much more detailed article here in the Guidelines with many more vehicle examples and history data.