
Mechanical Properties
M-Value, Strain Rate Sensitivity
All metals strengthen as they are deformed through a process called work hardening. However, the degree of strengthening may change as a function of the speed at which they are tested. In these cases, when local necking starts, the strain rate in the necked area is different in the surrounding non-necking region.
With negative strain-rate sensitivity, as is the case with many aluminium alloys, the necked region is weaker than the surrounding area. Fracture occurs with very little additional strain after necking initiation.
With positive strain-rate sensitivity, the necked region is stronger than the surrounding area. This is the basis for many steel alloys having a total elongation to fracture that is nearly double that of uniform elongation.
This strain-rate sensitivity is described by the exponent, m, in the modified power law equation:
 Equation 1
where έ is the strain rate and m is the strain rate sensitivity.
To characterize the strain rate sensitivity, medium strain rate tests were conducted at strain rates ranging from 10-3/sec (commonly found in tensile tests) to 103/sec. For reference, 101/sec approximates the strain rate observed in a typical stamping. Both yield strength and tensile strength increase with increasing strain rate, as indicated Figures 1 and 2.

Figure 1: Influence of Strain Rate on Yield Strength.Y-1
Figure 2: Influence of Strain Rate on Tensile Strength.Y-1
Up to a strain rate of 101/sec, both the YS and UTS only increased about 16-20 MPa per order of magnitude increase in strain rate. These increases are less than those measured for low strength steels. This means the YS and UTS values active in the sheet metal are somewhat greater than the reported quasi-static values traditionally reported. However, the change in YS and UTS from small changes in press strokes per minute are very small and are less than the changes experienced from one coil to another.
The change in n-value with increase in strain rate is shown in Figure 3. Steels with YS greater than 300 MPa have an almost constant n-value over the full strain rate range, although some variation from one strain rate to another is possible.

Figure 3: Influence of Strain Rate on n-value.Y-1
Similar behavior was noted in another studyB-22 that included one TRIP steel and three DP steels. Here, DP1000 showed a 50% increase in yield strength when tested at 200/sec compared with conventional tensile test speeds. Strain rate has little influence on the elongation of AHSS at strain rates under 100/sec.
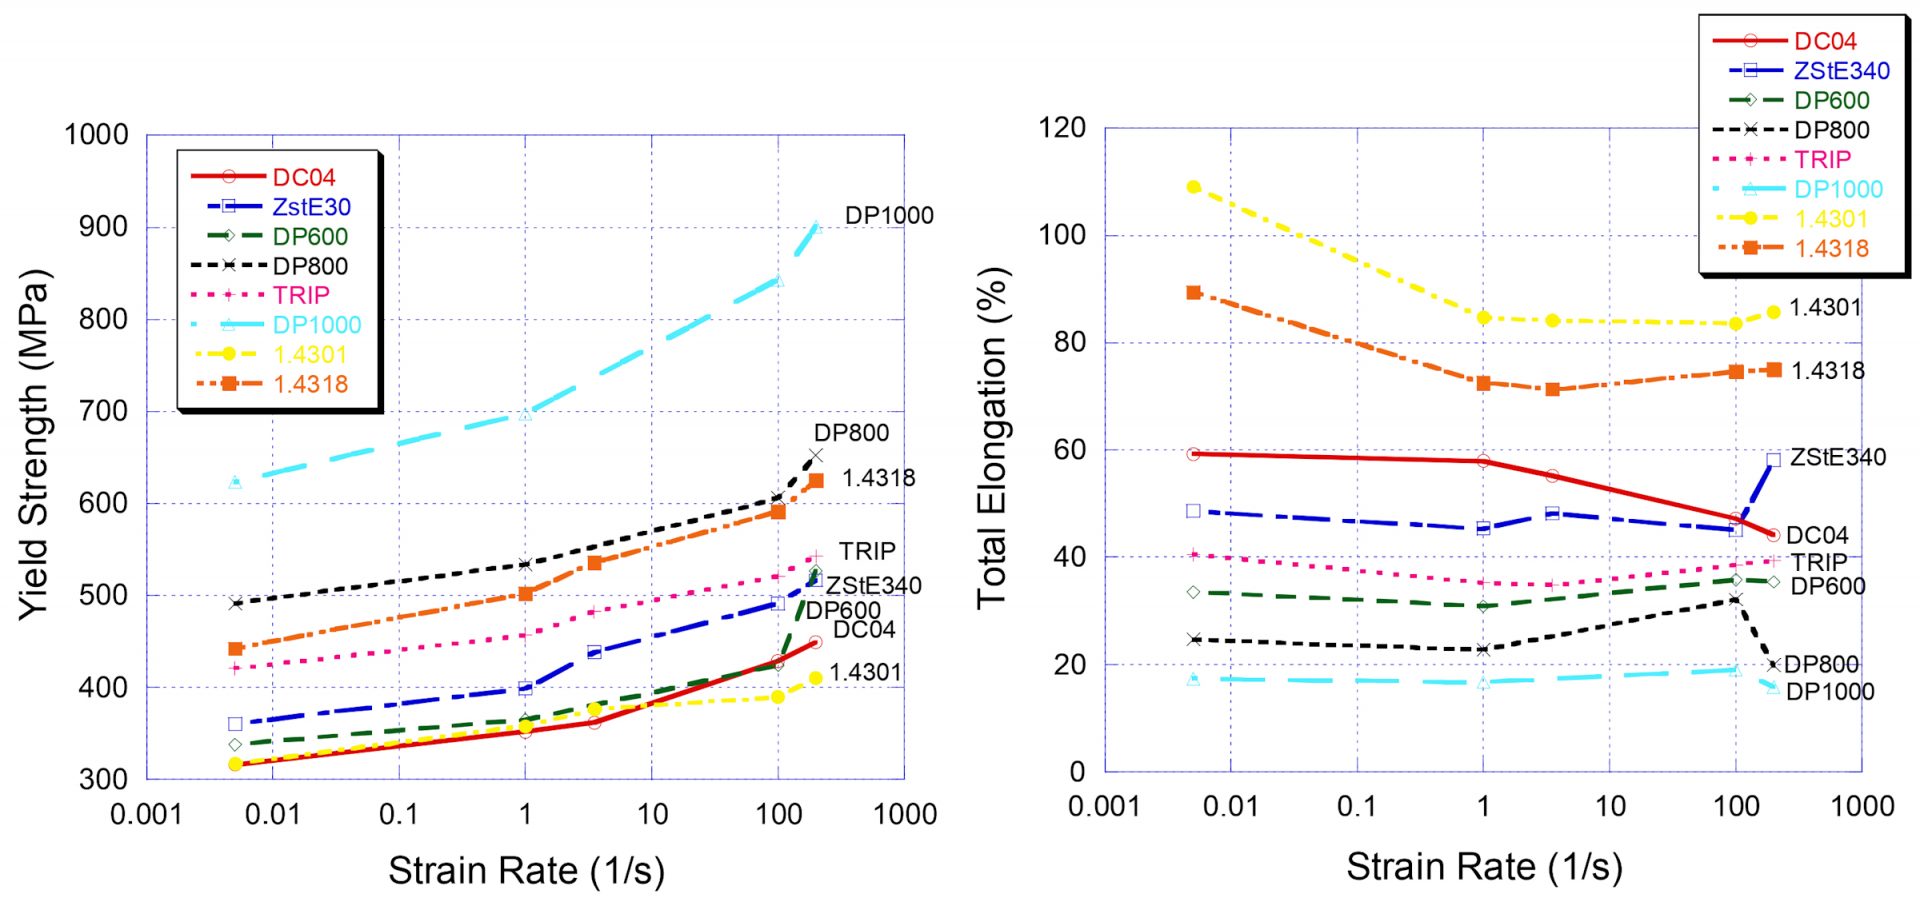
Figure 4: Relationship between strain rate and yield strength (left) and elongation (right). Citation B-22, as reproduced in Citation D-44
Figure 5 shows the true stress-true strain curves for a processed Press Hardened Steel tested at different strain rates. The yield stress increases approximately five MPa for one order of magnitude increase in strain rate.

Figure 5: True stress-strain curves at different strain rates for 1mm thick Press Hardening Steel (PHS) after heat treatment and quenching.V-1
The tensile and fracture response of different grades is a function of the strain rate and cannot be generalized from conventional tensile tests. This has significant implications when it comes to predicting deformation behavior during the high speeds seen in automotive crash events. See our page on high speed testing for more details.
![Tensile Testing]()
Testing and Characterization
topofpage
Tensile testing characterizes the forming and structural behavior of sheet metals. The test involves loading a sample with a well-defined shape along the axis in tension, generally to fracture, and recording the resultant load and displacement to calculate several mechanical properties. Global standardsI-7, A-24, D-19, J-15 prescribe the conditions under which tests must occur.
Sample Size and Shape
Full-size samples for tensile testing of metal sheets have a rectangular section at the edges for gripping by the test machine. Reducing the width in the central area promotes fracture in the monitored region. These geometrical features result in a sample shape which resembles a dogbone, leading to a descriptive term applied to test samples.
Dimensions of the dogbone samples are associated with tensile test standard from which they apply. ISO I, II, and III (described in Citation I-7) corresponds to the ASTMA-24, DIND-19, and JISJ-15 shapes, respectively. Figure 1 shows the dogbone shapes, highlighting the critical dimensions of width and gauge length. Refer to the Test Standards for other dimensions, tolerances, and other requirements.

Figure 1: Full-size tensile sample shapes for ISO I (ASTM), ISO II (DIN), and ISO III (JIS) standards.I-7, A-24, D-19, J-15
Significant differences exist in the width and gauge length of these tensile bar shapes. Although the ASTM and JIS bars have similar gauge length, the width of the JIS bar is twice that the ASTM bar. The ASTM and DIN bars have a 4:1 ratio of gauge length to width, where the JIS bar has a 2:1 ratio.
These shape differences mean that the calculated elongation changes depending on the test-sample standard used, even when testing identical material. With the combination of the shortest gauge length and widest sample, elongation from JIS bars typically are higher than what would be generated from the other shapes.
Yield strength and tensile strength are not a function of the shape of the tensile bar. Strength is defined as the load divided by the cross-sectional area. Even though each of the bars specify a different sample width (and therefore different cross-section), the load is normalized by this value, which negates differences from sample shape.
Shearing or punching during sample preparation may work-harden the edges of the tensile bar, which may lead to generating an inaccurate representation of the mechanical properties of the sheet metal. Test Standards require subsequent machining or other methods to remove edge damage created during sample preparation. Milling or grinding the dogbone samples minimizes the effects sample preparation may have on the results.
Tensile Test Procedure
The gauge length is the reference length used in the elongation calculations. Depending on the test standard, the gauge length is either 2 inches, 80 mm, or 50 mm. Multiplying the width and thickness within the gauge length determines the initial cross-sectional area before testing.
Grips tightly clamp the edges of the sample at opposite ends. As the test progresses, the grips move away from each other at a prescribed rate or in response to the restraining load. A load cell within the grips or load frame monitors force. An extensometer tracks displacement within the gauge length. Samples are typically tested until fracture.
During the tensile test, the sample width and thickness shrink as the length of the test sample increases. However, these dimensional changes are not considered in determining the engineering stress, which is determined by dividing the load at any time during the test by the starting cross-sectional area. Engineering strain is the increase in length within the gauge length relative to the starting gauge length. (Incorporating the dimensional changes occurring during testing requires calculating true stress and strain. The differences between engineering and true stress/strain are covered elsewhere (hyperlink to 2.3.2.1-Engineering/True)
A graph showing stress on the vertical axis and strain on the horizontal axis is the familiar engineering stress-strain curve, Figure 2. From the stress-strain curve, numerous parameters important for sheet metal forming appear, including:

Figure 2: Engineering stress-strain curve from which mechanical properties are derived.
Influence of Test Speed
Conventional tensile testing is done at strain rates slow enough to be called “quasi-static.” These rates are several orders of magnitude slower than the deformation rates during stamping, which itself is several orders of magnitude slower than what is experienced during a crash event.
Stress-strain curves change with test speed, typically getting stronger as the speed increases. The magnitude of these changes varies with grade. Significant challenges exist when attempting to characterize the tensile response at higher strain rates. Improved equipment and data collection capabilities are among the required upgrades.
Influence of Tensile Test Equipment
Advanced High-Strength Steels (AHSS) may challenge older test equipment. The load and displacement response must reflect only the contributions of the sheet metal, and not be influenced by the load frame and other testing equipment. In much the same way that insufficiently stiff press crowns deflect when stamping AHSS parts, tensile test load frames may similarly deflect, resulting in inaccuracies in the load-displacement measurements.
Grip strength also becomes critical when testing AHSS samples. The high strength of the metal sheets requires more grip pressure to prevent sample slippage through the grips. Pneumatic grips and even some mechanical grips may not generate the necessary pressure. Hydraulically actuated grips may be necessary as the strength increases.
Back to the Top