Edge Stretching Tests
topofpage
- Hole Tension Test
- Edge Tension Test
- Side Bending Test
- Half-Specimen Dome Test (HSDT)
- Edge Flange Test
- Effect of Time on Edge Ductility
The ISO 16630 Hole Expansion Test and the VDA238-100 bend test are among the few standardized tests to characterize local formability, the term which describes when part and process design, in addition to sheet metal properties like strength and elongation, influence the amount of deformation the metal can undergo prior to failure.
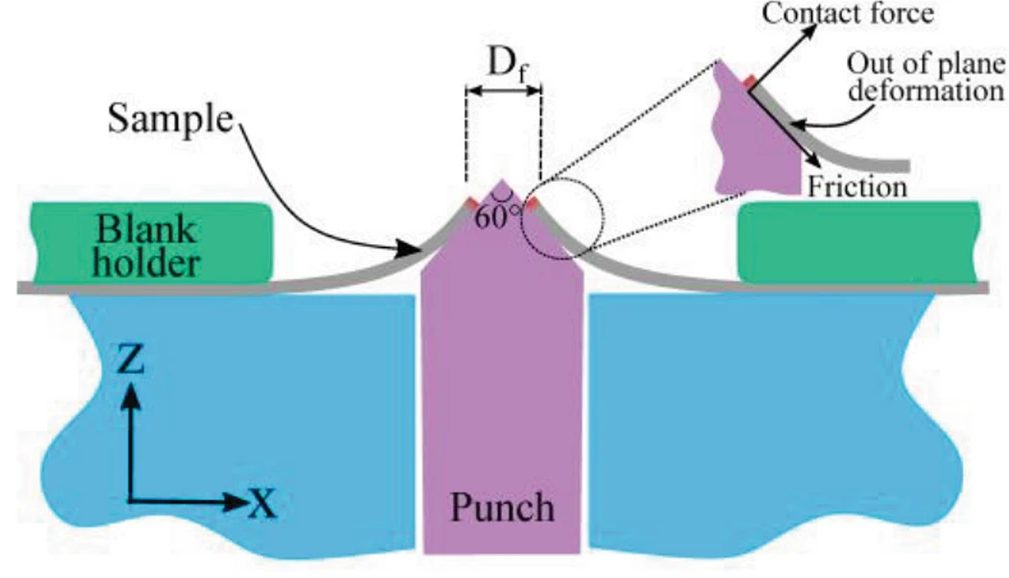
As schematically shown in Figure 1, the stress state at the edge of the hole expansion test specimen is influenced by friction, contact forces, and out-of-plane deformation, and therefore the hole expansion ratio as determined by ISO 16630 is not solely a material characteristic.
Figure 1: Parameters influencing stress state at edge of hole expansion test specimen.K-68
Researchers have developed alternate tests to further investigate process parameters and more clearly understand and optimize non-steel related variables. Also important is the investigation of different strain states from the ones seen in the hole expansion and bending tests. Comparisons of the stretched or bent edge performance evaluating different process parameters using the same material help to better define optimum process parameters. Repeating the testing with different AHSS grades confirms if similar trends exist across different microstructures and strengths. Standardization of these alternate tests has not yet occurred, so use caution when comparing specific values from different studies.
Hole Tension Test (In-Plane Deformation)
Microstructural damage in the shear affected zone reduces edge ductility. Damage has been evaluated with a modified tensile dogbone containing a central hole prepared by shearing or reaming, as shown in Figure 2. In contrast with a hole expansion test using a conical punch, the researchers described this as a Hole Tension test, which determines failure strain as a function of grade and edge preparation.
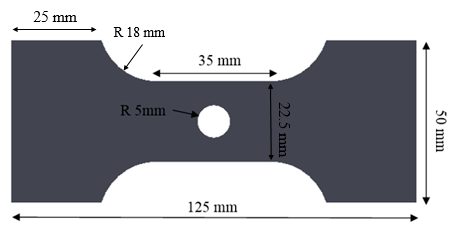
Figure 2: Hole Tension Test Specimen GeometryP-12
Edge Tension Test (In-Plane Deformation)
A two-dimensional (2-D) edge tension test, also called Half-A-Dogbone test, also evaluates edge stretchability. There are multiple versions of this type of test, but they all are based on the same concept. Like a standard tensile test, the 2-D edge tension test pulls a steel specimen in tension until failure. Unlike a standard tensile test where both sides of the tensile specimen are milled into a “dog bone”, the 2D tension test uses half of a dogbone with different preparation methods for the straight edge and the edge containing the reduced section (Figure 3). The chosen preparation method for each face is a function of the parameter being investigated (ductility, strain, burr, and shear affected zone for example). Potential edge preparation methods include laser cutting, EDM, water jet cutting, milling, slitting or mechanical cutting at various trim clearances, shear angles, rake angles or with different die materials.
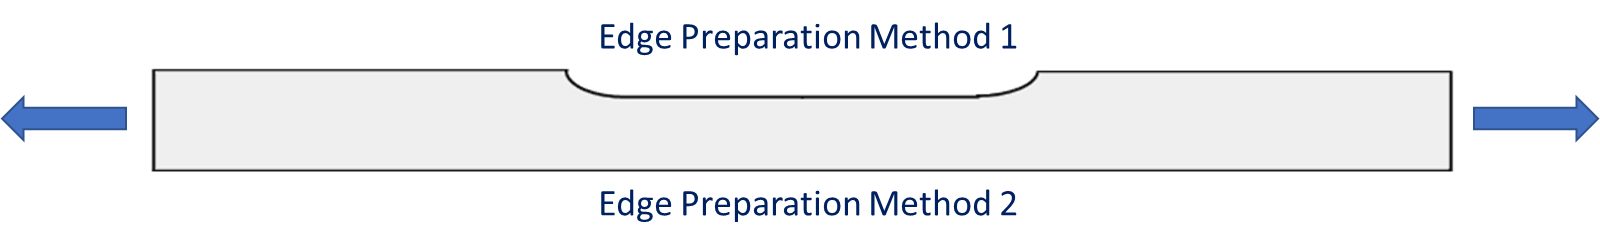
Figure 3: 2-D Edge Tension Test Sample. Note the edges are prepared differently based on the targeted property evaluated.
The hole expansion test is prone to scatter in the results. Many replicates are usually tested to improve the robustness of any conclusions. In addition, the test averages the strains over the entire circumference, and as such is lower than the peak strain immediately surrounding the location of crack initiation.
The Sheared Edge Tensile test (SET)W-25 has many merits: it does not require many samples, sample preparation is relatively easy, and the test itself can be performed on a regular tensile test machine. However, the test itself can be complicated to execute, partially because it requires stopping the test immediately after a load drop of 0.5% to 4% from peak load. Full separation of the specimen after failure is to be avoided since it can cause substantial distortion of the cross section along the failure.
This test was modified to eliminate the need to monitor and control based on load drop by using non-contact optical strain measurements facilitated by DIC (digital image correlation), creating what is termed the Sheared Edge Tensile – Improved test (SETi).A-92
A benefit of the use of DIC with SETi is that local peak strains can be captured, allowing for determination of critical strain measurements that can be fed into forming simulations.
More information about SETi can be found in Citations A-92 and A-93.
Side Bending Test (In-Plane Deformation)
Instead of a dogbone or half-dogbone, some studies use a rectangular strip without a reduced section. Bending performance can be evaluated with a rectangular strip having one finished edge and one trimmed edge while preventing out-of-plane buckling, as shown in Figure 4.G-7
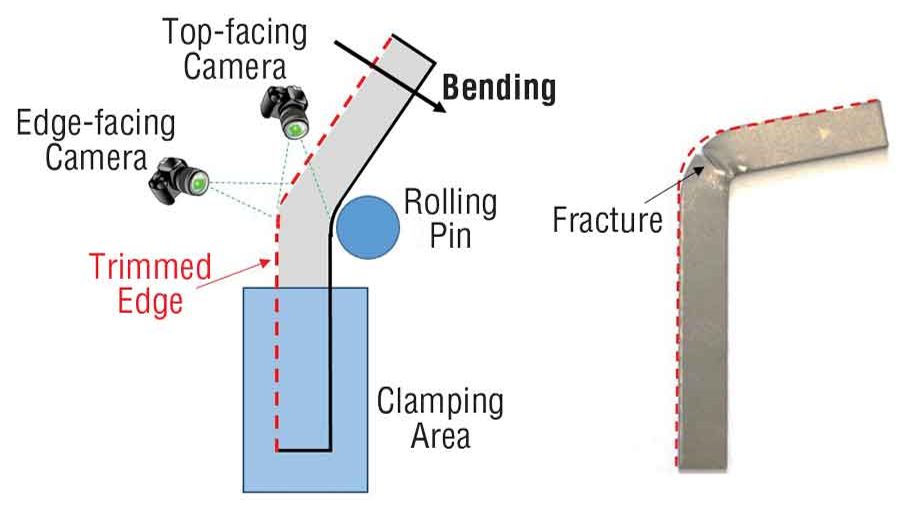
Figure 4: The side-bending test expands a trimmed edge over a rolling pin until detection of the first edge crack.G-7
Another type of in-plane side bending test is described in Citation K-68. The set-up shown in Figure 5 delays necking, allowing for determination of the hardening curve above uniform elongation. A key addition to the fixture is the anti-bucking mechanism. Unlike a standard hole expansion test, there is no friction and contact stress on the edge. The strain gradient is controlled by changing the beam height of the sample (Figure 6). An indication of the measurable dimensions after deformation is seen in Figure 7.
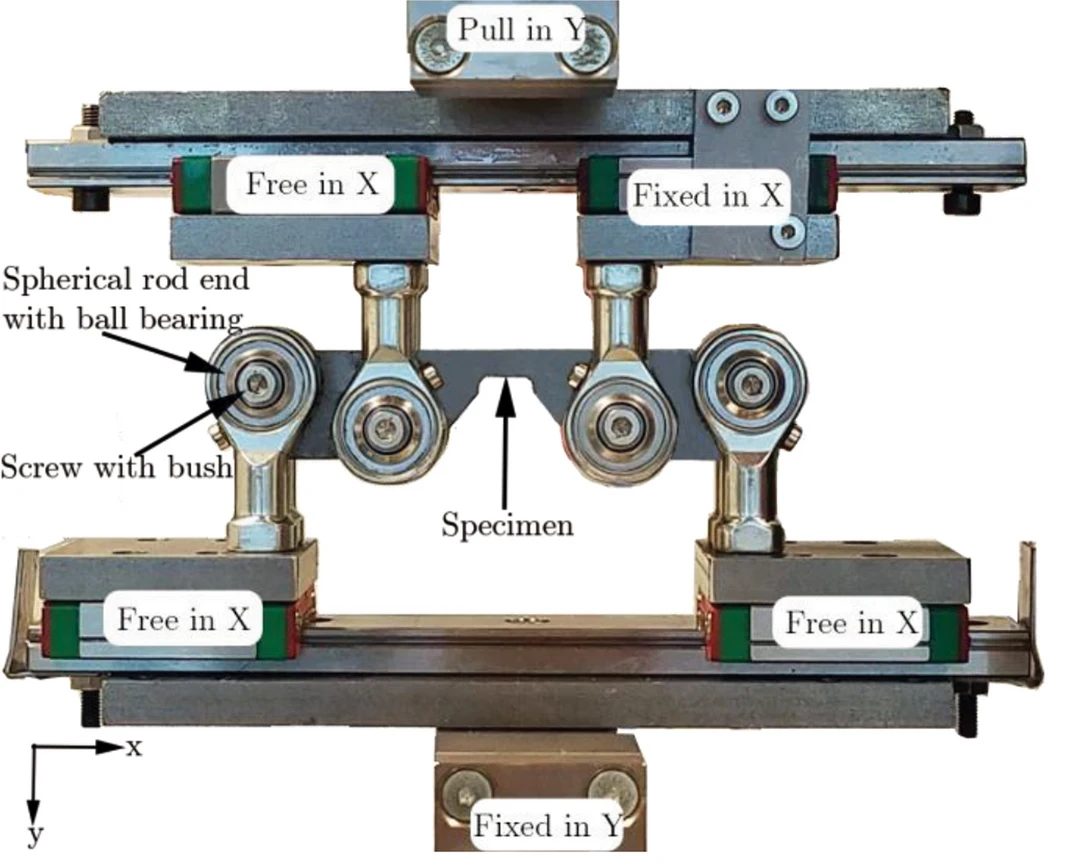
Figure 5: In-plane bending test fixture.K-69
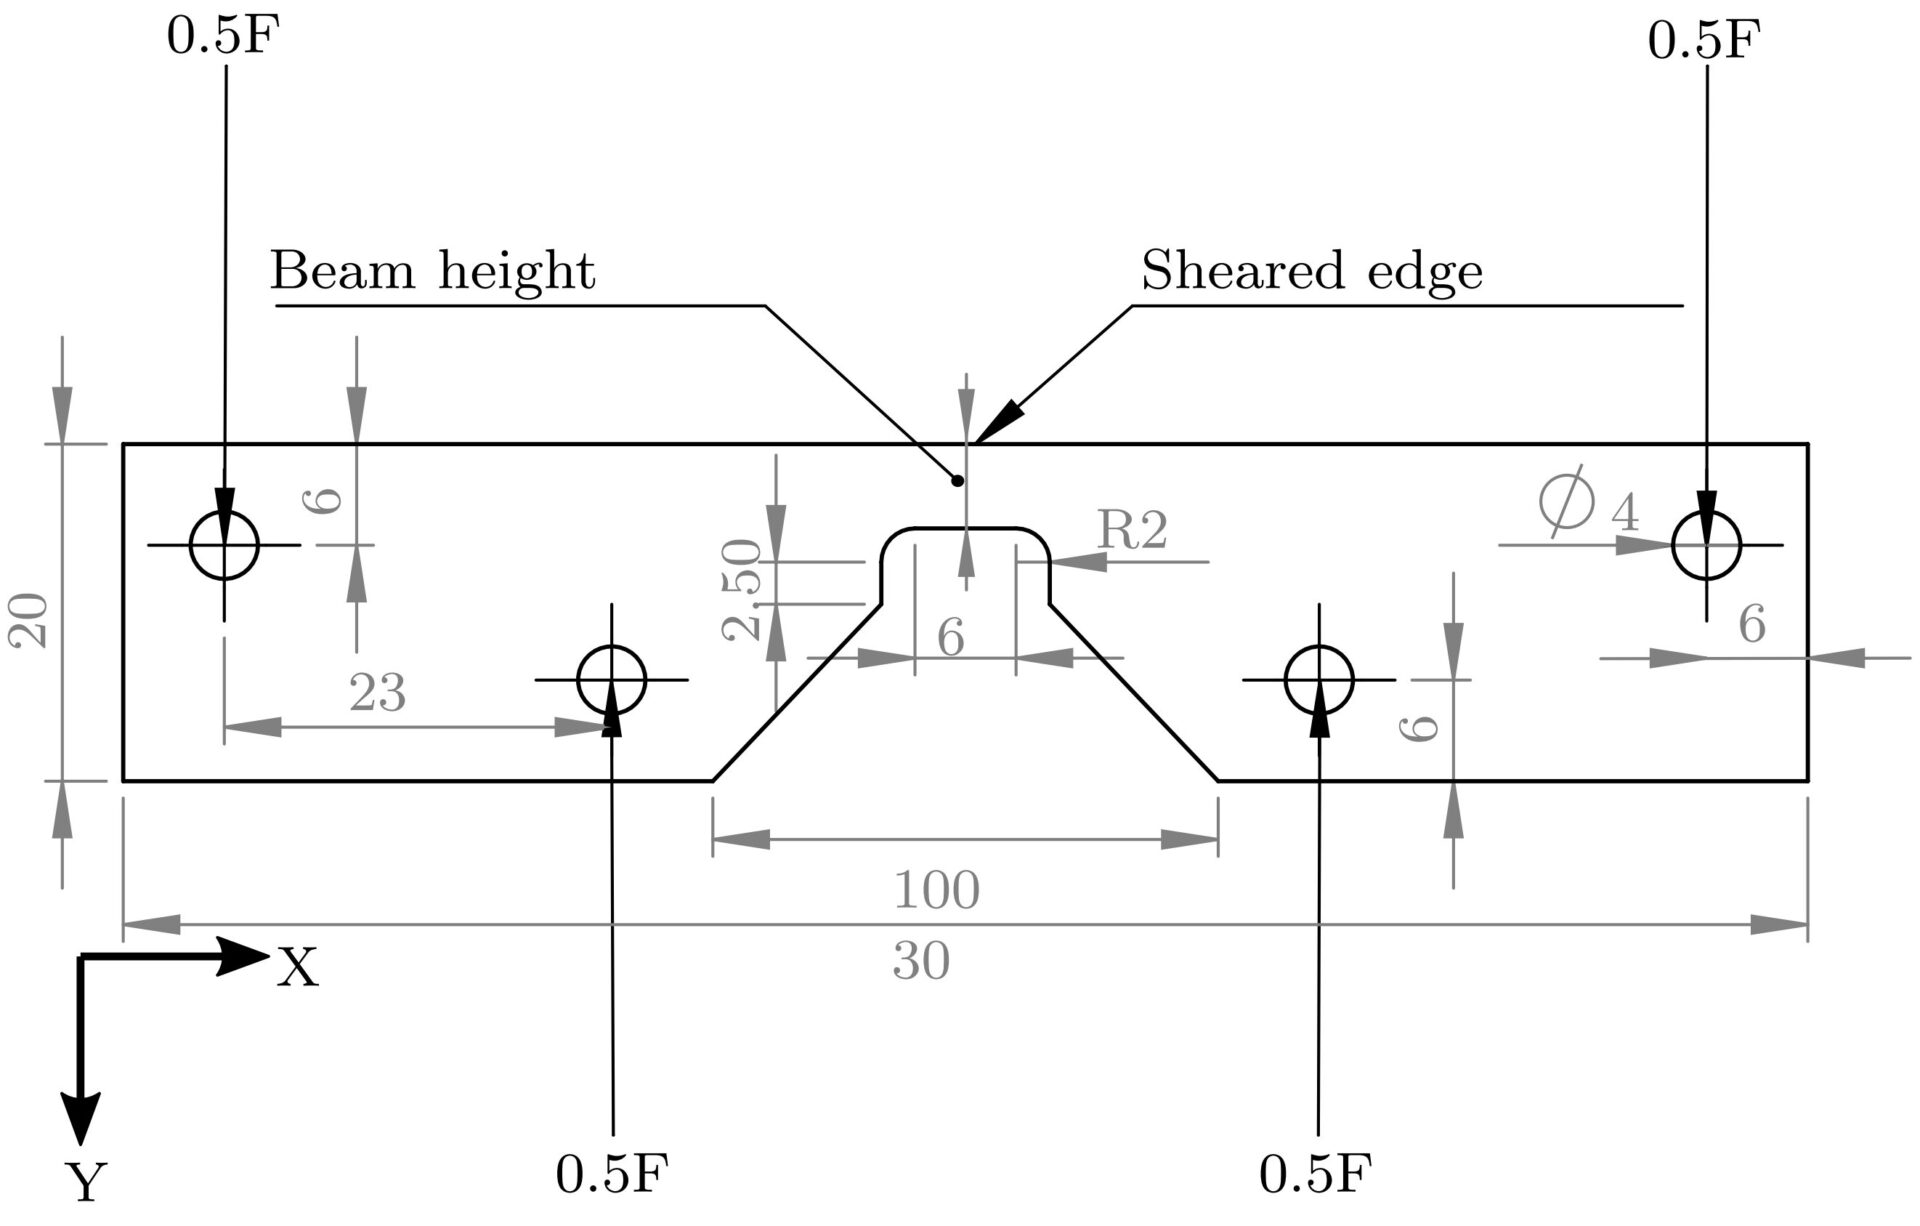
Figure 6: Sample geometry for in-plane bending test.K-69
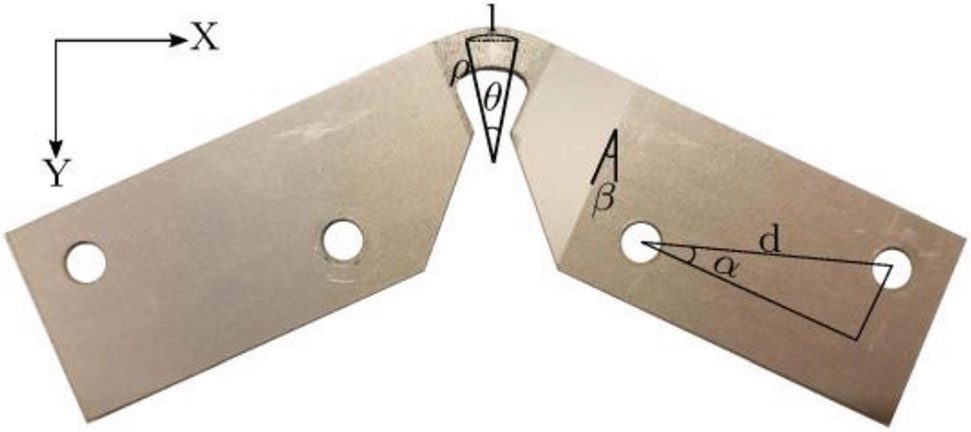
Figure 7: Deformed sample after in-plane bending test.K-68
The in-plane bending test provides more details of fracture strain in a desired material orientation relative to the rolling direction compared with the axisymmetric hole expansion test. In the hole expansion test, the weakest direction determines the result due to inherent rotational symmetry in the test. With potential anisotropy in the martensite morphology found in DP steels, the ability to improve characterization in specific orientations may be useful.
The in-plane bending test was used to show a DP800 sheared edge parallel to the transverse direction has a lower fracture strain than a sheared edge parallel to the rolling direction. Furthermore, a sharper cutting tool improves edge ductility.K-68 All tests allowed for two weeks between cutting and testing; over that two week period edge fracture strain is influenced by the time between cutting and testing, but stabilizes after two weeks.A-91
This test also was used to explore void distribution and the uniformity of plastic deformation in sheared edges.K-70 This study shows that the blanking process creates an inhomogeneous void distribution in the thickness direction. As the deformation increases during the subsequent in-plane bending test, the micro-cracks initiate at the burr region and grow towards the rollover region. Once they entirely pass the thickness of the material, they grow further, away from the edge.
No voids are present in the relatively smoother rollover and burnish regions of the sheared edge, whereas the rougher fracture region and burr contain many voids. The majority of voids are a result of martensite cracking and separation of ferrite–martensite interfaces.
Overall, the initial void volume fraction inside the severely hardened layer of the as-cut edge plays a more critical role than roughness in edge ductility. Removing the volume from edge with high void density (in this case, 40 microns) is enough to significantly increase the edge ductility. It is not necessary to remove the complete shear-affected zone, which for this study is on the order of 500 microns.
Half-Specimen Dome Test (Out-of-Plane Deformation)
Deformation in these three tests occur in the plane of the sheet. Typical hole expansion tests, like production stampings, deform the sheet metal perpendicular to the plane of the sheet. However, hole expansion testing does not always give consistent test results. The half-specimen dome test (HSDT) also attempts to replicate this 3-dimensional forming mode (Figure 8), and appears to be more repeatable likely due to creating a straight cut rather than round hole.
In the HSDT, a rectangular blank is prepared with one edge having the preparation method of interest, like sheared with a certain clearance or laser cut or water-jet cut. The sample is then clamped with the edge to be evaluated over a hemispherical punch. The punch then strains the clamped sample creating a dome shape, with the test stopping with the first crack appears at the edge. Edge stretchability is quantified by measuring dome height or edge thinning or other characteristics.
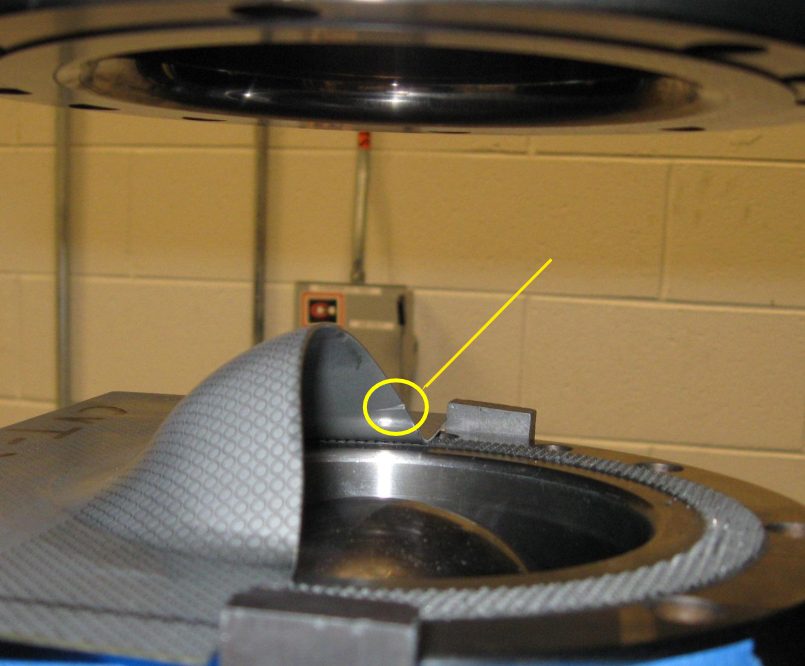
Figure 8: Half-Specimen Dome Test sample. Arrow points to edge crack.S-12
Edge Flange Test (Out-of-Plane Deformation)
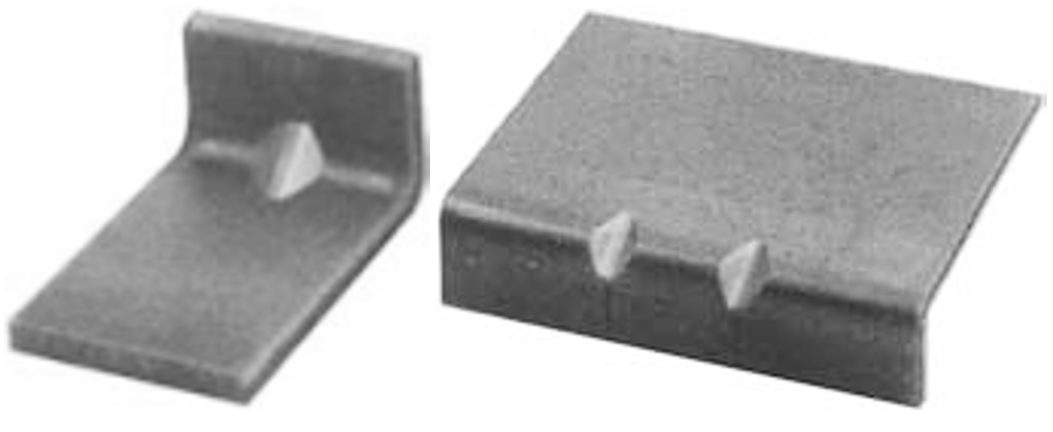
Flanging limits depend on the part contour, edge quality, and material properties. Non-optimal flange lengths – either too long or too short – will lead to fracture. Different tools can assess the influence of flange length, including the one shown in Figure 9 from Citation U-3.

Figure 9: Tool design to investigate flange length before fracture. Flange height: 40mm in left image, 20mm in right image.U-3
Physical tests using this tool show that optimizing sample orientation relative to the rolling direction leads to longer flange lengths before splitting.U-3 Figure 10 highlights the results from testing DP800.

Figure 10: Flange height limits as a function of orientation in DP800.U-3
Effect of Time on Edge Ductility
The time passed between cutting and deforming has a large influence on the test results.
Edge ductility test results are impacted by the amount of elapsed time between cutting and deforming. Citation A-91 documented this effect on two coils each of galvanized or bare dual phase steels having different chemistry that were evaluated with Hole Expansion Capacity (HEC), Sheared Edge Tensile – Improved (SETi), and BMW’s Kantenriss Empfindlichkeitstest (translated to edge crack sensitivity test, abbreviated as KRE) tests.
The difference between testing a few hours versus a few days after cutting can be a reduction of up to 10 HEC%, or a true strain of 0.1. Property values appear to be stable when tested within 4 hours after cutting or after 24 hours after cutting, at the high and low values, respectively. It was also found that this effect pertains only to zinc coated materials – no edge ductility reduction over time was found in bare steels.
A practical implication of this time effect is that a galvanized part formed in a coil-fed press line should have fewer problems with edge ductility than if blanks were prepared offline in advance, all other things being equal.
At least one automotive OEM recognizes this and puts timing restrictions on the hole expansion evaluation test procedure, stating that there must be a delay of “24 h ± 1 h at room temperature” after punching but before the hole expansion test begins to avoid the aging effect.
Making a second cut to remove the work hardened zone produced during the first cut, called shaving or pre-piercing, can improve the edge ductility. See the bottom of our page on shearing for more information. This practice may have the additional benefit of reducing or eliminating the time delay sensitivity associated with stretching of galvanized cut edges.
Although Citation A-91 evaluated only coated and uncoated DP steels, similar conclusions were drawn in another study covering dual phase (DP), complex phase (CP), and high strength low alloy (HSLA) grades,S-126 and another study covering DP steels of different strength levels.W-46
However, another studyC-44 observed a decrease in hole expansion capacity for galvanized complex phase steel, uncoated martensitic steel, and one galvanized dual phase grade. Yet the effect was absent in galvanized bake hardening (BH), uncoated transformation induced plasticity aided bainitic-ferritic (TBF), and another uncoated dual phase grade. A related studyC-45 concluded that the advanced high strength grades with good edge ductility were the most susceptible to a decrease in edge stretchability with aging.
Influence of Starting Dimension
In addition to the time between edge creation and testing, the starting reference dimension of the analyzed region influences the results. Edge strains of samples from CR440Y780T-DP were evaluated using four tests: two with a relatively large strain reference length, and two associated with smaller strain reference lengths. It is found that the measured edge formability increases with a smaller strain reference length.S-127
This is similar to the effect seen in a comparison of A80 and A50 tensile bars, where A80 – having the longer reference length – is associated with lower elongation values than on an A50 bar of the same material.
The strain reference length in physical testing should correspond to the element size in associated forming simulation.
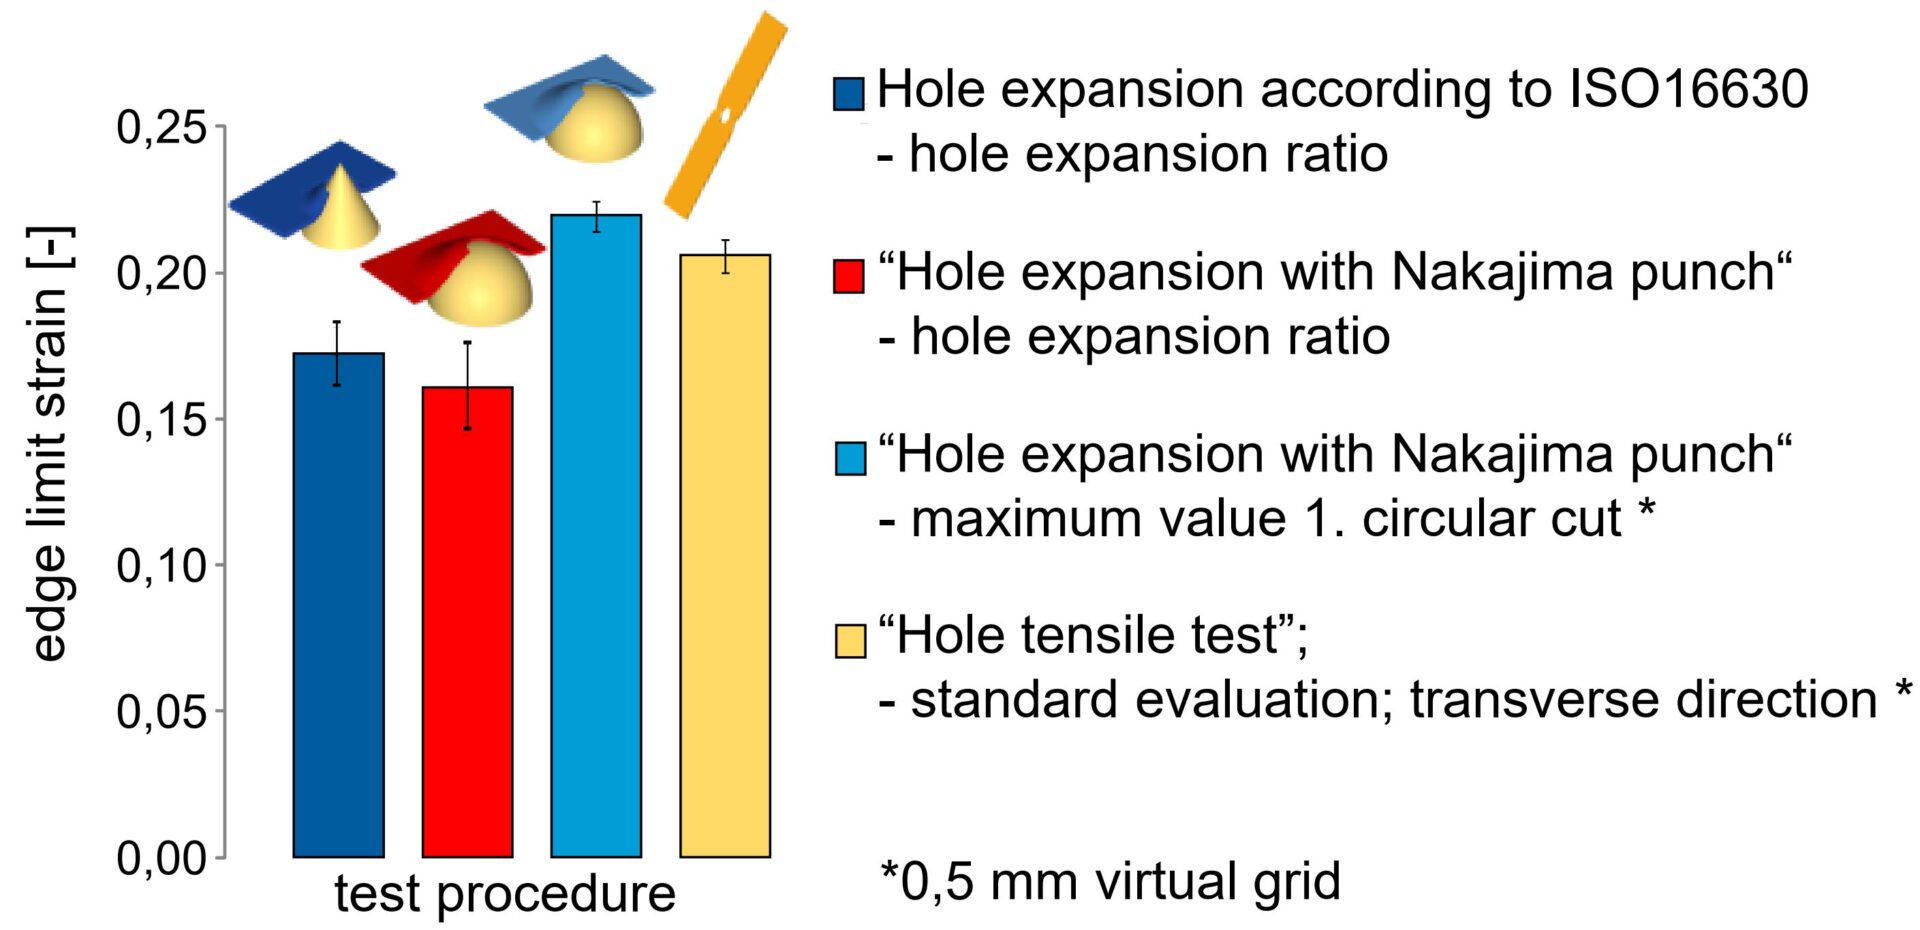
Figure 11: Limiting edge strains of the same material tested and evaluated differently. The red bar is from a conventional ISO 16630 test, except a dome was used to expand the hole instead of a conical punch. The lighter blue bar are the results from the same test, but a non-contact DIC method was used to measure the limiting strains instead of the change in hole diameter.S-127
- Hole Tension Test
- Edge Tension Test
- Side Bending Test
- Half-Specimen Dome Test (HSDT)
- Edge Flange Test
- Effect of Time on Edge Ductility