Joining, Laser Welding, Press Hardened Steels
This studyR-25, conducted by the Centre for Advanced Materials Joining, Department of Mechanical & Mechatronics Engineering, University of Waterloo, and ArcelorMittal Global Research, utilized 2mm thick 22MnB5 steel with three different coating thicknesses, given in Table 1. The fiber laser welder used 0.3mm core diameter, 0.6mm spot size, and 200mm beam focal length. The trials were done with a 25° head angle with no shielding gas but high pressure air was applied to protect optics. Welding passes were performed using 3-6kW power increasing by 1 kW and 8-22m/min welding speed increasing by 4m/min. Compared to the base metal composition of mostly ferrite with colonies of pearlite, laser welding created complete martensitic composition in the FZ and fully austenized HAZ while the ICHAZ contained martensite in the intergranular regions where austenization occurred.
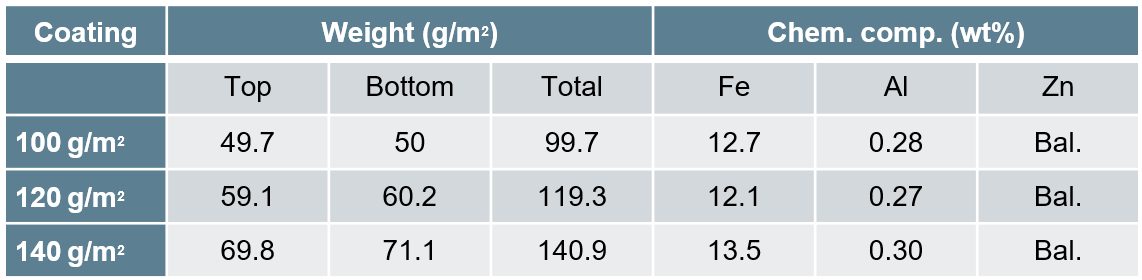
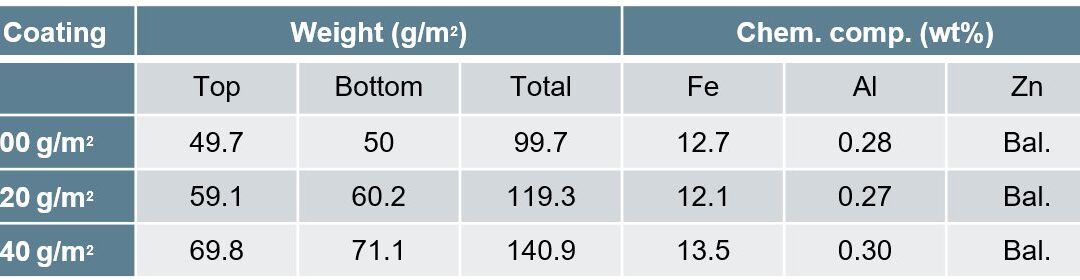
Table 1: Galvanneal Coatings.R-25
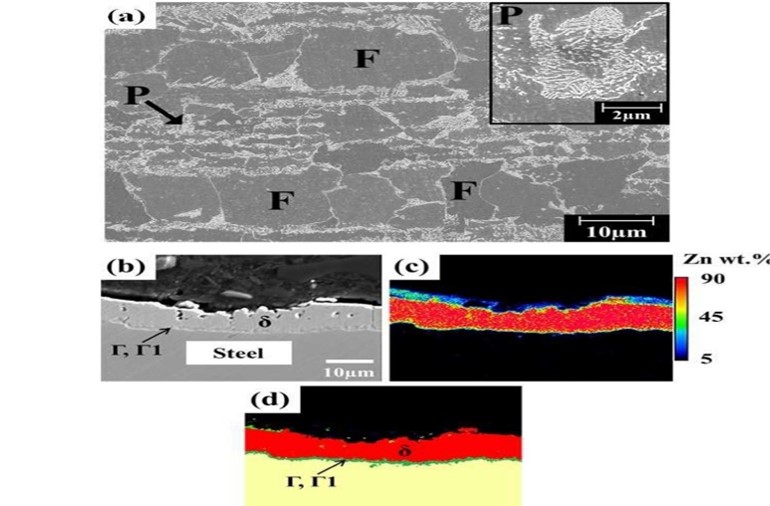
Figure 1: Base metal microstructure(P=pearlite, F=ferrite, Γ=Fe3Zn10, Γ1=Fe5Zn21 and δ=FeZn10).R-25
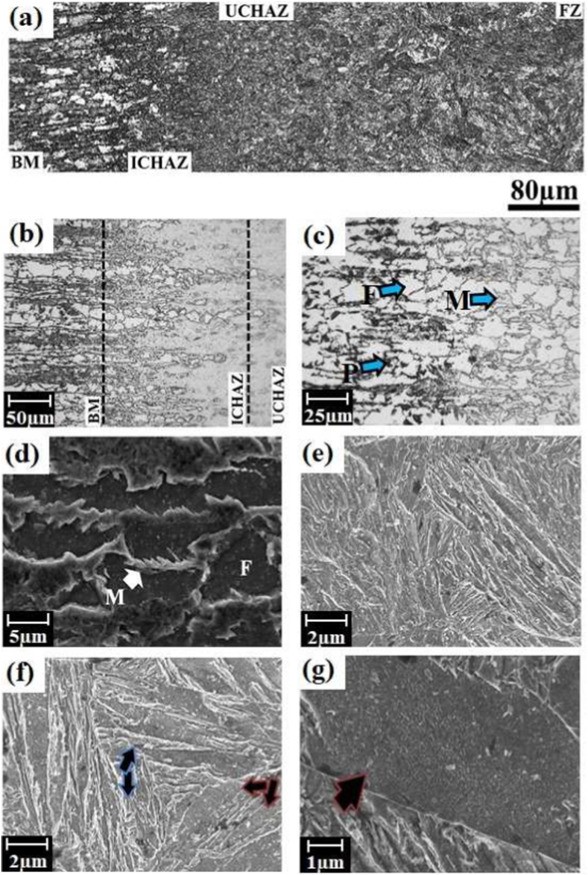
Figure 2: Welded microstructure — (a) overall view, (b) HAZ, (c) ICHAZ at low and (d) high magnifications, (e) UCHAZ (f) FZ, and (g) coarse-lath martensitic structure (where M; martensite, P: pearlite, F: ferrite).R-25
Given the lower boiling temperature of Zn at 900 °C as compared to Fe, the interaction of the laser with the Zn plasma that forms upon welding affects energy deliverance and depth of penetration. Lower coating weight of (100 g/m2) resulted in a larger process window as compared to (140 g/m2). Increased coating weight will reduce process window and need higher power and lower speeds in order to achieved proper penetration as shown in Figure 3 and Figure 4. Depth of penetration due to varying welding parameters was developed:
d=(H-8.6+0.08C)/(0.09C-4.8)
[d= depth of penetration(mm), H= heat input per unit thickness(J/mm2), C= coating weight(g/m2)]
Given the reduction in power deliverance, with an increase in coating weight there will be an expected drop in FZ and HAZ width. Regardless of the coating thickness, the HAZ maintained its hardness between BM and FZ. No direct correlation between coating thickness and YS, UTS, and elongation to fracture levels were observed. This is mainly due to the failure location being in the BM.
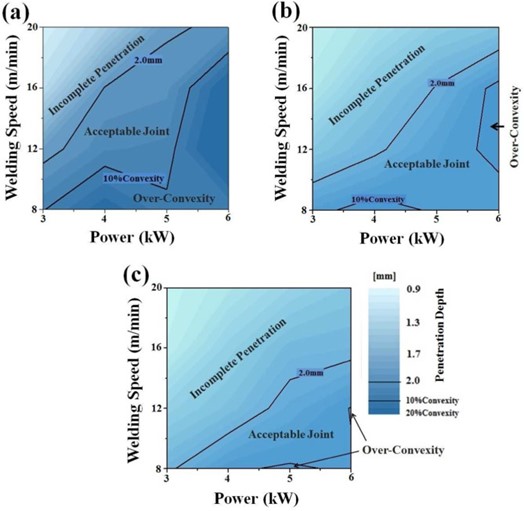
Figure 3: Process map of the welding window at coating weight of (a) 100 g/m2, (b) 120 g/m2, and (c) 140 g/m2.R-25
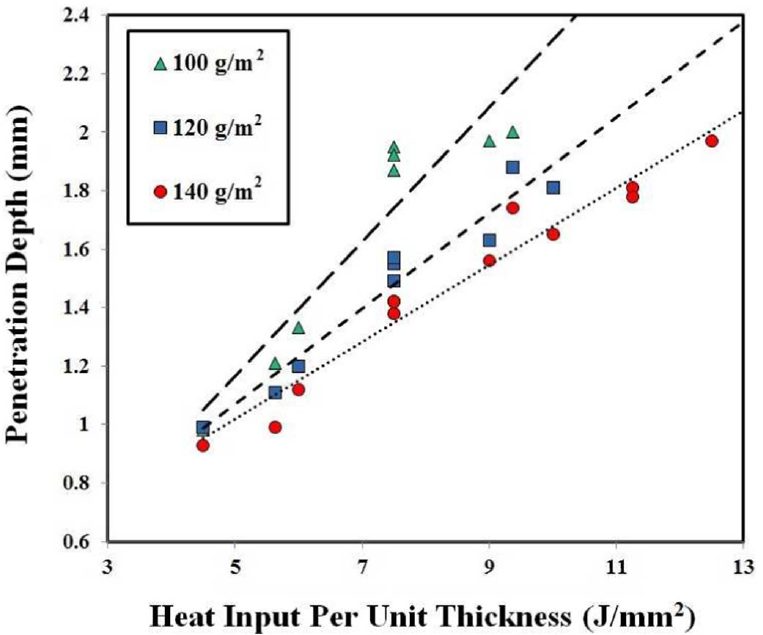
Figure 4: Heat input per unit thickness vs depth of penetration.R-25