Blog, homepage-featured-top, main-blog
Efficient energy and resource use in automotive engineering is a major challenge that can only be overcome with innovative solutions. A cost-effective and resource-saving approach is the use of digital methods in production.
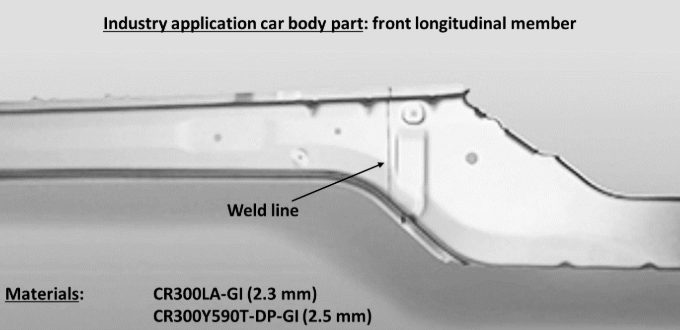
In demanding production chains like body-in-white components from tailor-welded blanks (TWBs), it is crucial to digitally simulate the product before actual production to prevent tool adjustments and unnecessary trials. A new digital twin for the tailor welded blanking process chain links numerical simulations for welding and forming steps. Figure 1 shows a typical application for a tailor welded blank component in the body in white: front longitudinal member.
Figure 1: A typical application for TWBs in the automotive industry is the longitudinal member shown here at the front. The TWB shown consists of micro-alloyed CR300 LA (2.3 mm) and high-strength dual phase steel with 600 MPa (2.5 mm). The welded sheet metal blanks were deep-drawn into the final shape of the TWB.
The process chain of laser beam welding and deep drawing faces challenges when pushing to stronger advanced high-strength steels. Areas around the weld seam are susceptible to softening due to heat input during welding, leading to changes in material properties, such as decreased strength in the heat-affected zone (HAZ) and hardening of the weld metal, influencing forming limit behavior.
Adapted welding process control can optimize material properties, ensuring laser beam welding’s applicability for AHSS grades. Consistent digital simulation of manufacturing processes is one of the most promising approaches for enabling low-emission, lightweight construction and maximizing material efficiency. To replace material-intensive experiments, simulations using the finite element analysis (FEA) create a virtual 3D model of a component.
Welding structure simulation validation is performed using thermocouple measurements and metallographic sections. The core of the forming simulation consists of material cards for high-strength steels. Yield curves, stress-strain curves, and forming limit diagrams are incorporated into the simulation. Validation experiments complete the forming simulation setup, comparing the deep-drawing press force-displacement curve with the modeled curve. The deep-drawn component is then digitized using a 3D scanner, allowing comparison of the real component with the simulated one in terms of geometry, defects, and sheet thickness. Figure 2 shows a simulated S-rail as demonstrator component after deep-drawing simulation.
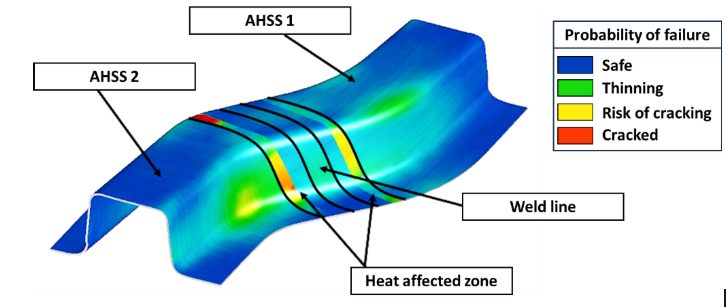
Figure 2: Simulation result of an S-rail formed from TWBs for the probability of failure (max. failure). Both the weld seam and the heat-affected zone are greatly oversized in the illustration for better visibility. The base materials are two high-strength steels of different sheet thicknesses, which were welded together using a butt joint. The heat-affected zone is represented as two areas with different properties.
Today’s forming simulation tools cannot readily account for the small geometric areas of weld metal and heat affected zones, hence the welding simulation results cannot be directly used as input for another software. In addition, it is difficult to measure material behavior of the welding zones to correctly model them in forming simulations. New interfaces were developed for a digital data management platform to bridge this gap. Intermediate steps are required to transfer welding results to forming simulation, including determining the heat-affected zone and deriving weld seam geometry. The analysis chain of the digital twin involves extracting welding simulation results, creating input for forming simulation and adjusting welding simulations based on forming results in an iterative loop. Figure 3 illustrates the digital process chain.
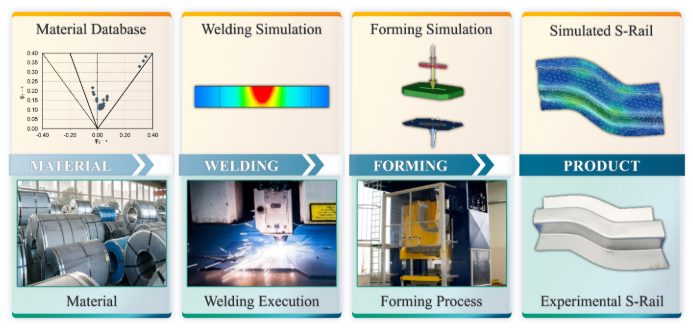
Figure 3: Scheme of the digital (top) and conventional (bottom) process chain of tailor welded blanking: main process steps from material to final product.
Linking welding and forming simulations (Figure 4) enable TWBs made of advanced high-strength steels reach higher strength levels, ultimately saving resources in car body construction and making production more sustainable. The development of TWBs for automotive construction serves as a starting point for expanding lightweight construction potential across the transport sector.
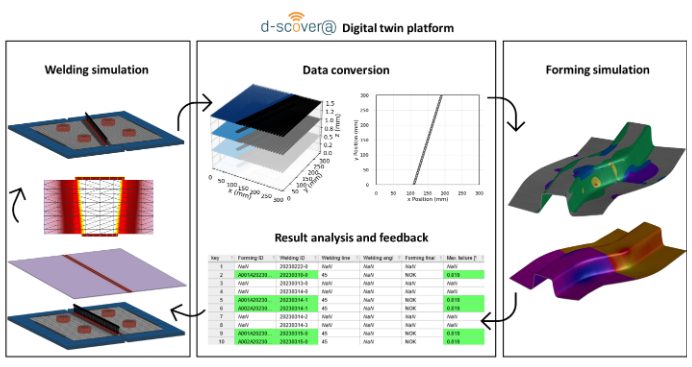
Figure 4: Bidirectional digital twin: How adapting welding simulation closes the loop. The welding simulation displays its results using three-dimensional volume elements. With the help of the digital platform, a simplified two-dimensional representation is generated that contains information about the position of the weld seam and heat-affected zone, which can then be modelled in shell elements. This data is used for the forming simulation and the result is fed back into the digital platform. The parameters of the best simulation results are highlighted and assist in the planning of new welding simulations.

A special thank you to our author, Josefine Lemke, M. Sc. She is a research associate at Fraunhofer IPK in Berlin, Department Joining and Coating Technology. She specialized in additive manufacturing and welding simulation. The focus is on the correlation of component quality and powder properties, particularly in the context of industry and SME environments. She is also working on the qualification of ultra-high-strength steels in car body construction (integration of laser welding and forming simulation in tailor-welded blanking).
Blog, homepage-featured-top, main-blog
Tensile testing is one of the most basic formability characterization methods available. Results from tensile testing are a key input into metal forming simulations, but if the right information isn’t included, the simulation will not accurately reflect material behavior.
Metal forming simulation is particularly beneficial on the value-added parts made from advanced high strength steels, since accurate simulations allow for optimal processing with minimal recuts … at least when the right information is used as inputs.
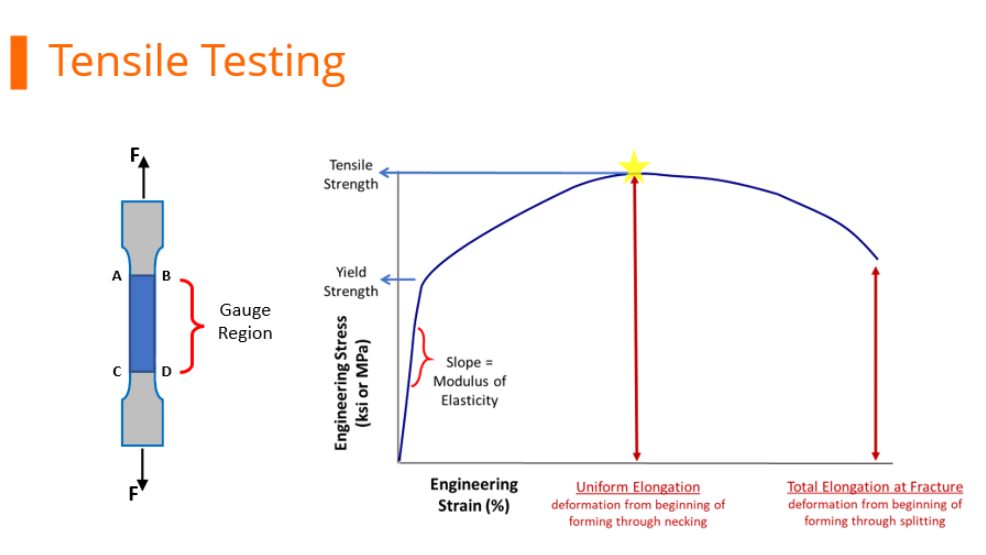
Tensile Testing
During tensile testing, a standard sample shape called a dogbone is pulled in tension. Load and displacement are recorded, and which are then converted to a stress-strain curve. Strength is defined as load divided by cross-sectional area. Exactly when the cross-sectional area is measured during the test influences the results.
Before starting the pull, it’s easiest to measure the width and thickness of the test sample.
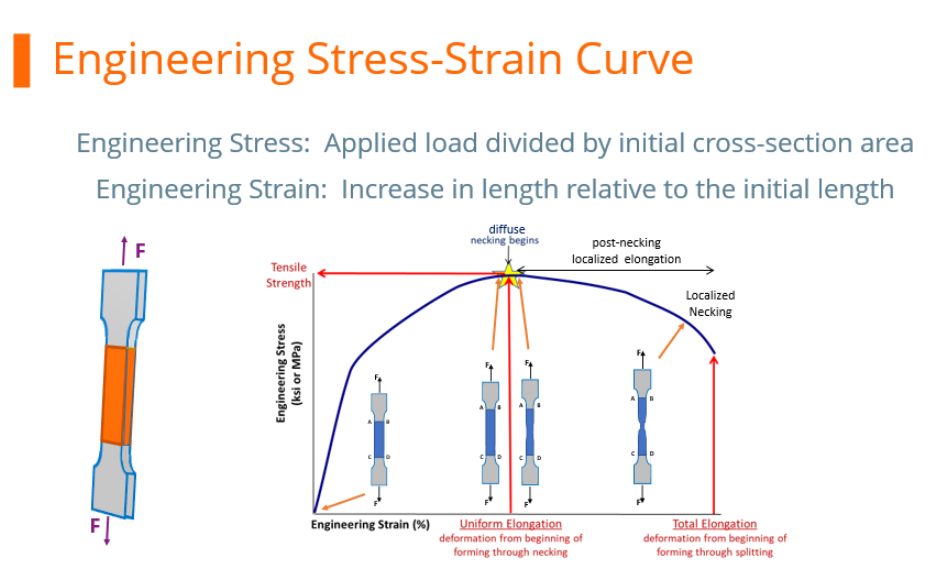
Engineering Stress-Strain Curve
At any load, the engineering stress is the load divided by this initial cross-sectional area. Engineering stress reaches a maximum at the Tensile Strength, which occurs at an engineering strain equal to Uniform Elongation. After that point, engineering stress decreases with increasing strain, progressing until the sample fractures.
However, metals get stronger with deformation through a process known as strain hardening or work hardening. As a tensile test progresses, additional load must be applied to achieve further deformation, even after the “ultimate” tensile strength is reached. Understanding true stress and true strain helps to address the need for additional load after the peak strength is reached.
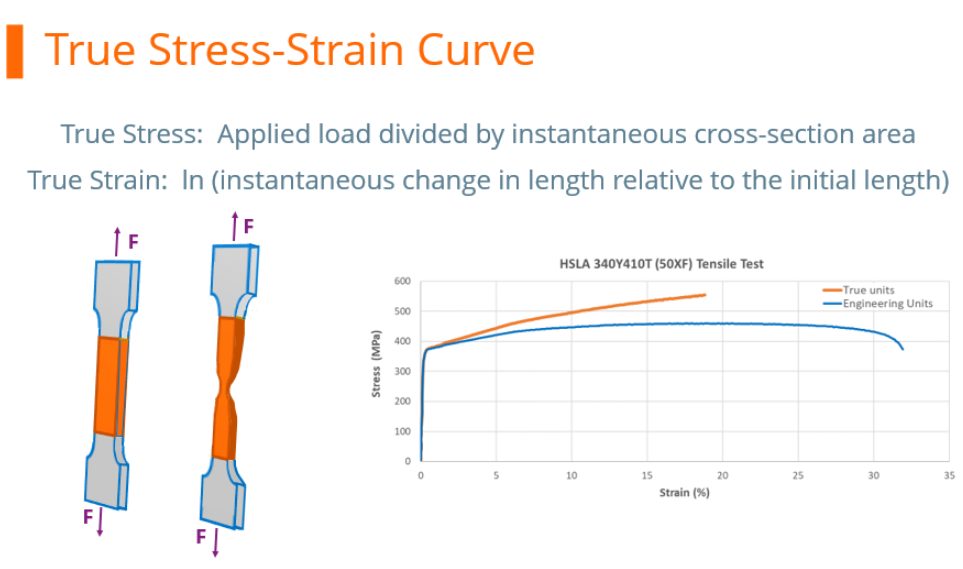
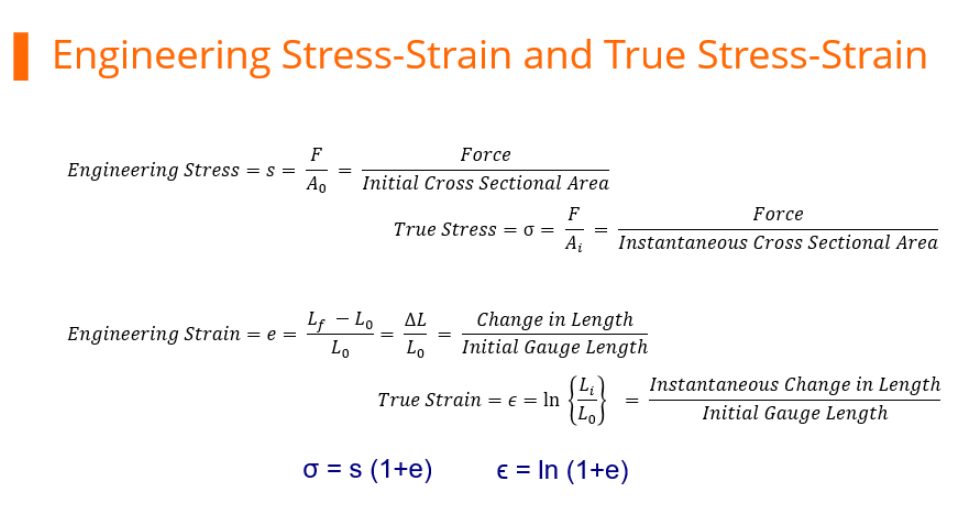
During the tensile test, the width and thickness shrink as the length of the test sample increases. Although these dimensional changes are not considered when determining the engineering stress, they are of primary importance when determining true stress. At any load, the true stress is the load divided by the cross-sectional area at that instant.
True Stress-Strain Curve
The true stress – true strain curve gives an accurate view of the stress-strain relationship, one where the stress is not dropping after exceeding the tensile strength stress level.
True stress is determined by dividing the tensile load by the instantaneous area.
True stress-strain curves obtained from tensile bars are valid only through uniform elongation due to the effects of necking and the associated strain state on the calculations. Inaccuracies are introduced if the true stress-true strain curve is extrapolated beyond uniform strain, and as such a different test is needed. Biaxial bulge testing has been used to determine stress-strain curves beyond uniform elongation. Optical measuring systems based on the principles of Digital Image Correlation (DIC) are used to measure strains. The method by which this test is performed is covered in ISO 16808.
Stress-strain curves and associated parameters historically were based on engineering units, since starting dimensions are easily measured and incorporated into the calculations. These are the values you see on certified metal properties, also called metal cert sheets that you get with your steel shipments.
True stress and true strain provide a much better representation of how the material behaves as it is being deformed, which explains its use in computer forming and crash simulations.
It’s much more challenging to get accurate dimensional measurements once the test has started unless there are multiple loops of the operator stopping the test, remeasuring, then restarting the pull. This is not a practical approach.
Fortunately, there are equations that relate engineering units to true units. Conventional stress-strain curves generated in engineering units can be converted to true units for inclusion in simulation software packages.
As the industry moves to more value-added stampings, metal forming simulation is done on nearly every part. The value-added nature of parts made from advanced high strength steels requires best practices be used throughout – otherwise the results from simulation drift further away from matching reality, leading to longer development times and costly recuts.

Danny Schaeffler is the Metallurgy and Forming Technical Editor of the AHSS Applications Guidelines available from WorldAutoSteel. He is founder and President of Engineering Quality Solutions (EQS). Danny wrote the monthly “Science of Forming” and “Metal Matters” column for Metalforming Magazine, and provides seminars on sheet metal formability for Auto/Steel Partnership and the Precision Metalforming Association. He has written for Stamping Journal and The Fabricator, and has lectured at FabTech. Danny is passionate about training new and experienced employees at manufacturing companies about how sheet metal properties impact their forming success.
Blog, homepage-featured-top, Joining Dissimilar Materials, main-blog
The discussions relative to cold stamping are applicable to any forming operation occurring at room temperature such as roll forming, hydroforming, or conventional stamping. Similarly, hot stamping refers to any set of operations using Press Hardening Steels (or Press Quenched Steels), including those that are roll formed or fluid formed.
Automakers contemplating whether a part is cold stamped or hot formed must consider numerous factors. This blog covers some important considerations related to welding these materials for automotive applications. Most important is the discussion on Resistance Spot Welding (RSW) as it is the dominating process in automotive manufacturing.
Setting Correct Welding Parameters for Resistance Spot Welding
Specific welding parameters need to be developed for each combination of material type and thickness. In general, the Hot Press (HP) steels require more demanding process conditions. One important factor is electrode force which should be higher for the HP steel than for cold press type steel of the same thickness. The actual recommended force will depend on the strength level, and the thickness of the steel. Of course, this will affect the welding machine/welding gun force capability requirement.
Another important variable is the welding current level and even more important is the current range at which acceptable welds can be made. The current range is weldability measurement, and the best indicator of the welding process robustness in the manufacturing environment and sometime called proceed window. Note the relative range of current for different steel types. A smaller process window may require more frequent weld quality evaluation such as for weld size.
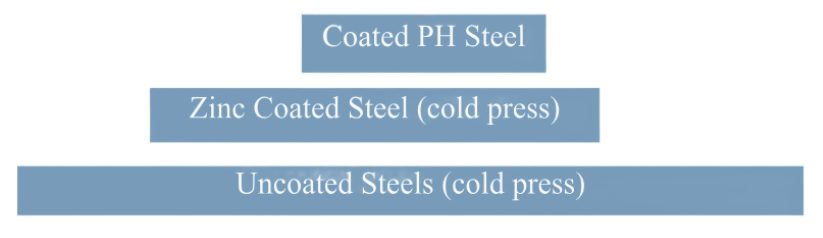
Relative Current Range (process windows) for Different Steel Types
The Effect of Coating Type on Weldability
In all cases of resistance spot welding coated steels, it is imperative to move the coating away from the weld area during and in the beginning of the weld cycle to allow a steel-to-steel weld to occur. The combination of welding current, weld time and electrode force are responsible for this coating displacement.
For all the coated steels, the ability of the coating to flow is a function of the coating type and properties, such as electrical resistivity and melting point, as well as the coating thickness.
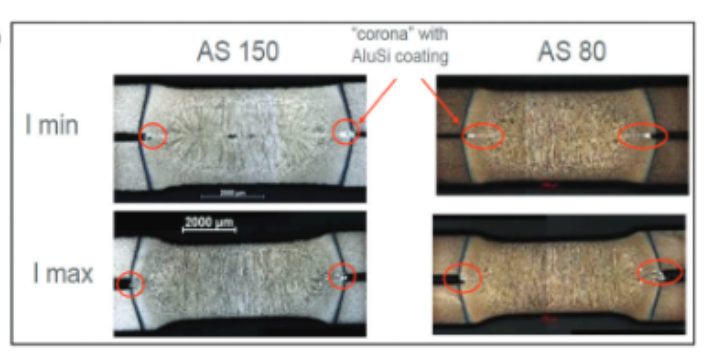
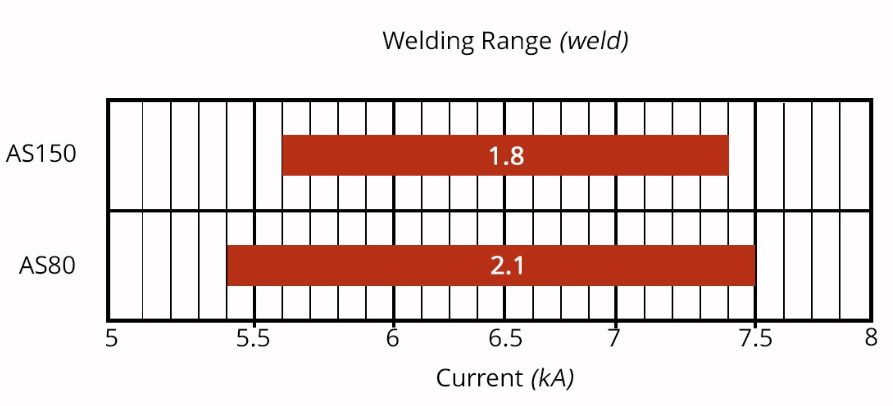
An example of cross sectioned spot welds made on Hot Press Steel with Aluminum -Silicon coating is shown below. It shows two coating thicknesses and the displaced coating at the periphery of weld. This figure also shows the difference in current range for the different coating thickness. The thicker coating shows a smaller current range. In addition, the Al-Si coating has a much higher melting point than the zinc coatings on the cold stamped steels, making it more difficult to displace from the weld area.
Hot Press Steel with Aluminum -Silicon
Liquid Metal Embrittlement and Resistance Spot Welding
Cold-formable, coated, Advance High Strength Steels such as the 3rd Generation Advanced High Strength Steels are being widely used in automotive applications. One welding issue these materials encounter is the increased hardness in the weld area, that sometime results in brittle fracture of the weld.
Another issue is their sensitivity to Liquid Metal Embrittlement (LME) cracking. These two issues are discussed in detail on the WorldAutoSteel AHSS Guidelines website and our recently released Phase 2 Report on LME.
Resistance Spot Welding Using Current Pulsation
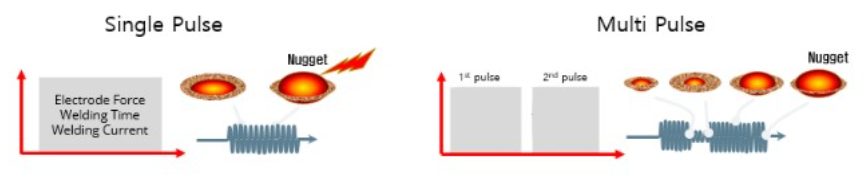
The most effective solution for the issues described above is using current pulsation during the welding cycle. A schematic description is shown below.
The pulsation allows much better control of the heat generation and the weld nugget development. The pulsation variables include the number of pulses (typically 2-4), the current level and time for each pulse, and the cool time between the pulses.
In summery, pulsation (and sometime current upslope) in Resistance Spot Welding proved to be beneficial for the following applications:
- Coated Cold Stamped steels
- Cold stamped Advance High Strength Steels
- Multi materials stack-ups – As described in our articles here on 3T/4T and 5T Stack-Ups

Thanks is given to Menachem Kimchi, Associate Professor-Practice, Dept of Materials Science, Ohio State University and Technical Editor – Joining, AHSS Application Guidelines, for this article.
Blog, homepage-featured-top, main-blog, News
The transportation industry’s contribution to greenhouse gas (GHG) emissions and global warming is well documented and understood. Vehicle OEMs, fleet operators, and transport users all have responsibilities to reduce environmental impacts on the planet and contribute to meeting global emissions regulations.
Mobility as a Service (MaaS) solutions like WorldAutoSteel’s flaghip Steel E-Motive (SEM) program have the potential to contribute to a reduction in GHG emissions, helping to achieve these global targets and specific policy objectives. The Steel E-Motive engineering report, released in 2023, addresses the impact of emissions reduction using Life Cycle Assessment, with key results summarized in this article.
Introduction to Life Cycle Assessment
Life Cycle Assessment (LCA) is a methodology that evaluates the environmental impact of a product across its entire lifecycle. By understanding the impact across the entire vehicle life cycle, vehicle manufacturers evaluate trade-offs and assess the net impact of the product they’re using.
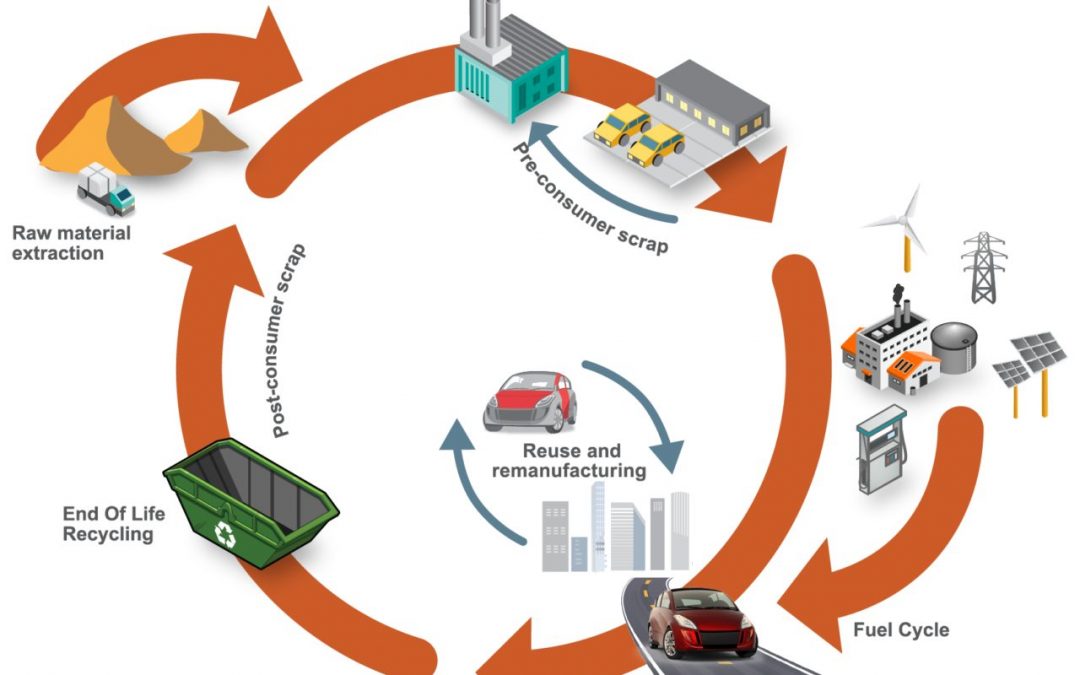
Cradle-to-grave assessments utilize a boundary that includes impacts from the production phase (including raw material extraction and vehicle production), the use phase (including fuel or electricity as well as consumables like tires and fluids) and the end-of-life phase, which could include disposal and/or recyling of the product, as shown in Figure 1. We applied LCA throughout the development of the SEM concept.
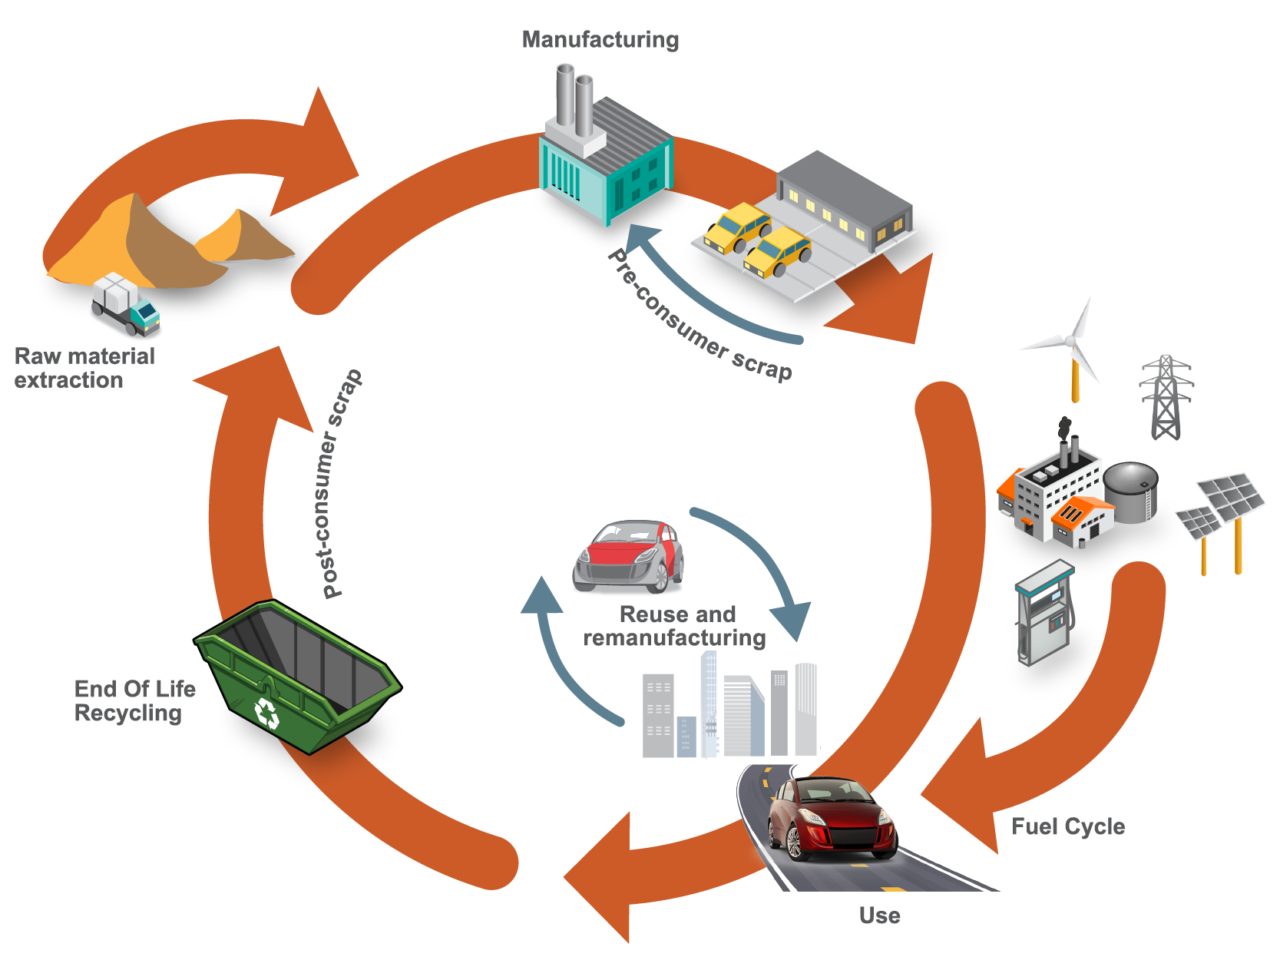
Figure 1. SEQ Figure \* ARABIC 1 Life Cycle Assessment, considering the entire life of the vehicle, from raw material extraction to end of life
LCA can cover a range of environmental impacts; however, for the SEM program, we focused on GHG emissions through the GWP-100 indicator and total energy consumption using Cumulative/Primary Energy Demand and Fossil Energy Consumption indicators.
Reference Taxi (Baseline) Vehicle
A key consideration in LCA calculations is establishing an appropriate reference vehicle. For this program, the following criteria was used:
- Present day (~2020) battery electric vehicle (BEV) operating in taxi mode with a driver and one occupant with vehicle/battery lifetime assumptions of 300,000km, and use of 100 percent conventional steel/aluminum.
- Vehicle end-of-life methodology using the Avoided Burden Approach, where recycled metals are assumed to displace equivalent quantities of their virgin counterparts and assigned corresponding emission and energy demand credits.
- Assumption of 50 percent pyrometallurgical recycling for the battery packs.
- Estimated reference taxi vehicle curb weight using the statistical reference data study (Figure 2), resulting in an estimated curb weight of 1,949kg.
- Material utilization based on data from a similar vehicle specification, as shown in Figure 3.
- Vehicle occupancy rate assumptions of 1.4, based on a combination of both “empty” and passenger-carrying journeys.
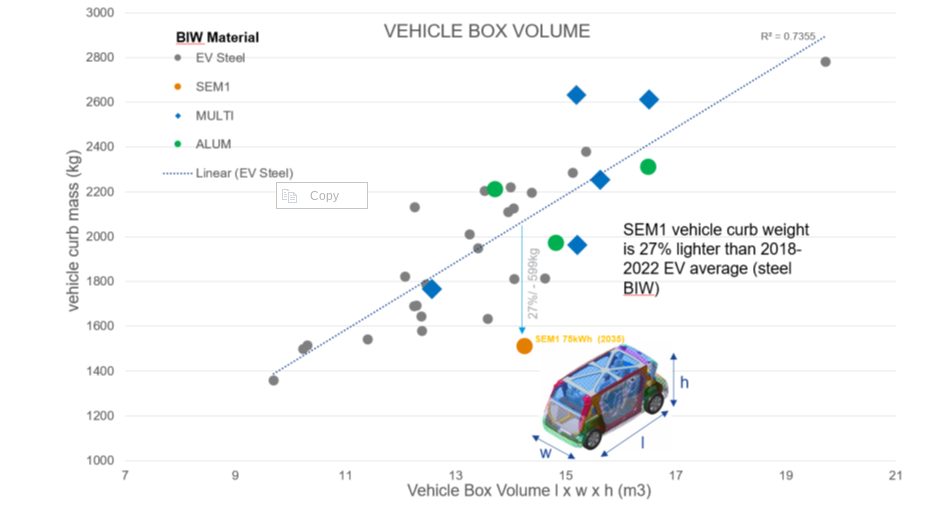
Figure 2. Vehicle curb weight versus box volume comparison. Reference vehicle data; source www.a2mac1.com
Steel E-Motive “Default” Vehicle
SEM vehicle life cycle calculations assume a hypothetical 2030 manufacture and start-of-operation date of 2030 to 2035. We updated the electricity grid supply mix to include the average of the International Energy Agency (IEA) scenario estimates for 2030 and 2040.
- We applied the nominal SEM1 vehicle curb weight of 1,512kg in the LCA model, and updated the vehicle Bill of Materials.
- As with the reference vehicle, we adopted the Avoided Burden Approach as the default for end-of-life calculation.
Life Cycle Assessment Results
Figure 3 below highlights absolute calculated life cycle GHG emissions, in units of kgCO2e/ passengerꞏkilometer studied, with the individual contributions of vehicle manufacturing, vehicle use, and end-of-life phase presented.
The analysis evaluated two reference/baseline conditions and nine SEM sensitivity studies, see Figure 4. These included alternative assumptions on LCA end-of-life modeling methodology, lifetime vehicle activity (and battery lifetime), alternative operational energy consumption sensitivities, sensitivities on the use of ‘green’ steel, and vehicle occupancy rates.
The accompanying pie chart shows the breakdown and contributions to the vehicle manufacture GHG for the baseline SEM scenario (2).
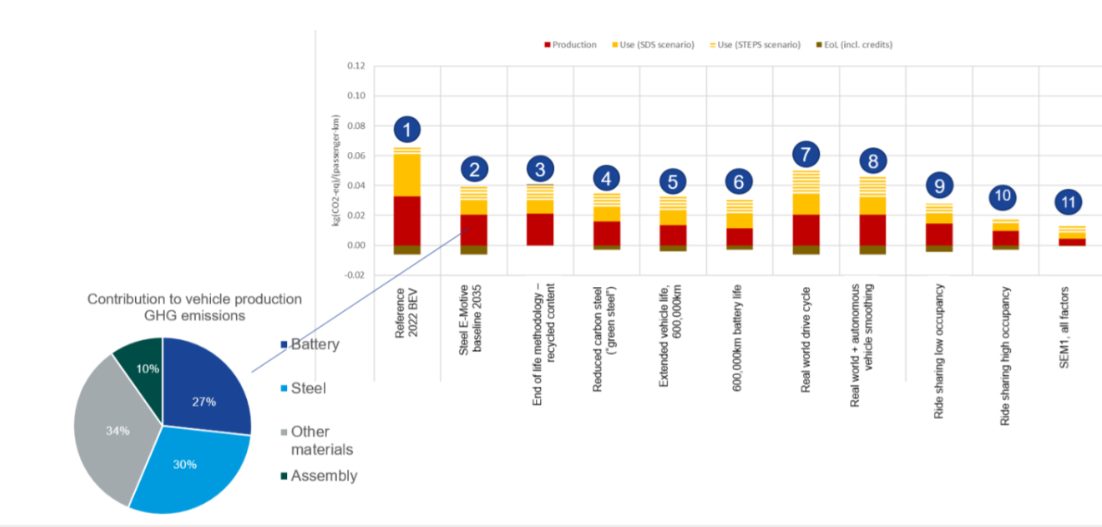
Figure 3. SEQ Figure \* ARABIC 2 life cycle assessment GHG results
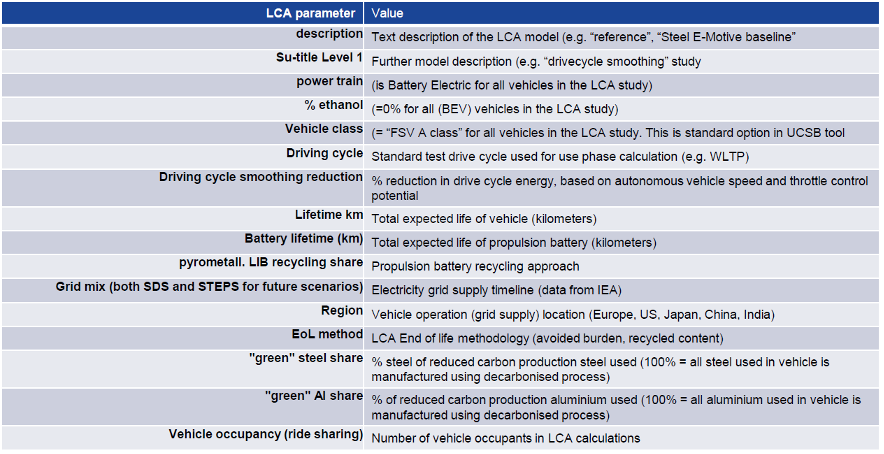
Figure 4. Reference/baseline conditions and SEM sensitivity studies
Life Cycle Assessment Conclusions
Based on the parameters outlined, applying LCA to SEM concept demonstrated the designs’ potential to reduce lifecycle greenhouse gas emissions by up to 86 percent compared to a present-day battery electric vehicle operating as a taxi.
This potential can be realized by adopting the following measures:
- Reducing vehicle production and manufacturing embedded emissions by utilizing 100 percent reduced carbon (“green”) steel
- Improving battery technology and increasing the use of renewable electricity in battery manufacturing; as well as increasing/improving battery recycling
- Ensuring the vehicle weight of autonomous vehicles is managed, and the potential weight reduction benefits realized and implemented. The SEM body structure and battery housing demonstrate good weight efficiency.
- Increasing the overall lifespan of the vehicle and battery. The fatigue and durability properties of AHSS can enable enhanced vehicle lifetime. The SEM battery design allows easy replacement of specific modules, enabling an overall extended battery life.
- Autonomous vehicle control smooths the driving cycle. The vehicle acceleration and deceleration rates can be optimized to match the driving conditions and road topography, reducing energy consumption and subsequent GHG emissions.
- Increasing passenger occupancy rates to at least three per vehicle via MaaS.
The projected net GHG emissions for the SEM vehicle operating with the flexibilities described above already represent a significant reduction when compared to the current baseline.
Achieving net zero emissions would require additional measures like offsetting manufacturing impacts (e.g., through compensatory credits from atmospheric carbon capture and storage) and transitioning to a 100 percent renewable electricity grid.
Moving Toward Net Zero
Taking a Life Cycle Assessment approach to the SEM concept demonstrates the possibilities for engineering future mobility vehicles that continue to move us closer to a net zero future. For more information about the Steel E-Motive program, download the engineering report here: https://bit.ly/SEM_Eng_Report

Thanks go to Russ Balzer for his contribution of this article to the AHSS Insights blog. As.technical director at WorldAutoSteel, he leads technical programs and oversees the organization’s work in research, modeling, and advocacy for Life Cycle Assessment in the automotive sector. An LCA Certified Professional through the American Center for Life Cycle Assessment (ACLCA), he also acts as the WorldAutoSteel liaison to the worldsteel LCA Expert Group.
Blog, homepage-featured-top, main-blog, News
The Steel E-Motive concept features an innovative battery housing design and laser welded blank door ring created using part integration to reduce mass and cost.
Battery Carrier Frame System
The Steel E-Motive battery modules, cooling plates & hoses, electrical connectors, and battery management system are mounted to an AHSS carrier frame. This assembly is then bolted to the body structure. The body in white floor assumes the role of the battery top cover, providing both cost and weight savings; an AHSS bottom cover seals and provides underbody protection.
You can view the details about the SEM1 final battery concept in section 7.3 in the SEM Engineering Report: https://bit.ly/SEM_Eng_Report
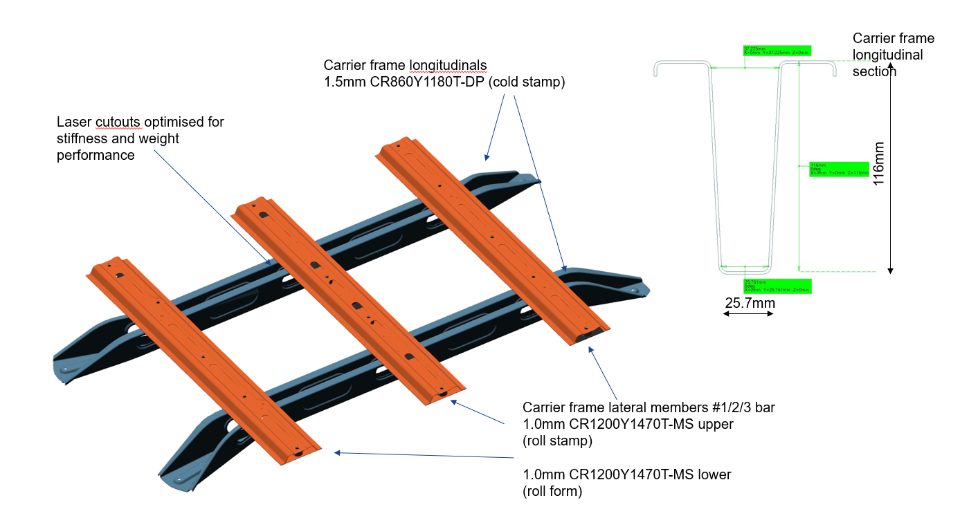
The Steel E-Motive Battery Carrier Frame
The battery carrier frame forms an integral part of the body structure load path. It connects to the front and rear longitudinals and the floor cross members. Two different manufacturing approaches and designs were considered for the longitudinals.
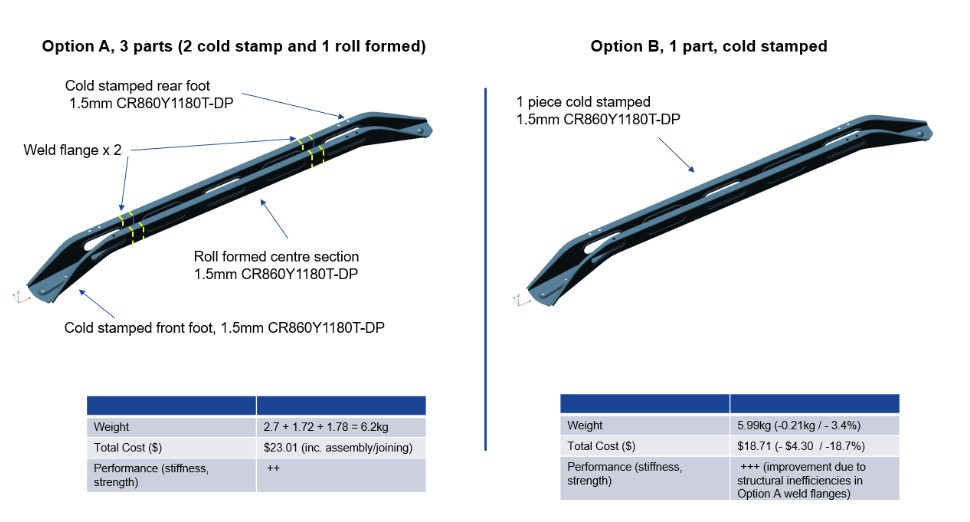
Option A considered a 3-part longitudinal design, with unique cold stampings for the front and rear “feet” and a roll-formed center section. The part integration is accomplished via an overlap weld flange and spot welding. Dual Phase 1180MPa UTS grade AHSS was selected based on the strength required for crash load reaction and enabling a lower 1.5mm gauge thickness. Initially, it was perceived that the roll-formed center section design would enable an overall lower-cost solution.
Option B replaces the 3-piece design with a single, cold-stamped part, again using 1.5mm DP1180 AHSS. The deep draw profile and material’s low ductility presented formability challenges for the cold stamping of the longitudinal. These were overcome by adjustments to the deep draw profile and optimization of the die and stamping parameters.
A comparison of the two designs shows that a small weight saving and a significant cost reduction of $4.30 (18.7%) per longitudinal is achieved with the single cold-stamped design. The vehicle NVH, static stiffness, and crash performance were also calculated to be superior for the integrated design Option B.
Therefore, Option B, provides cost, weight, and performance benefits compared to the multiple part design Option A.
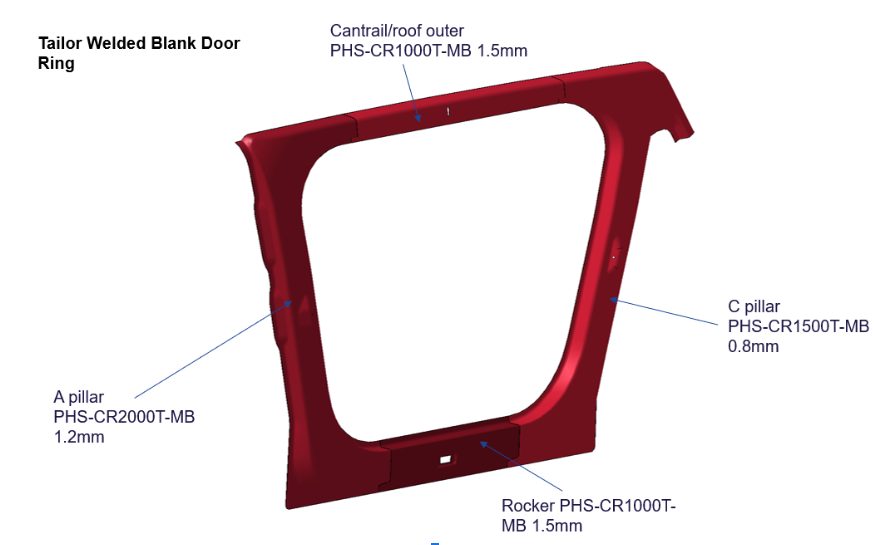
Laser Welded Blank Door Ring Created Using Part Integration
Part integration via laser-welded blanks allows different steel grades, thicknesses, and coating types to be combined into a single blank before the fabrication process. The Steel E-Motive door ring is a hot-formed part consisting of four different blanks with different AHSS grades and thicknesses.
The performance requirements for the specific region determine the grades and thicknesses for each blank. The A-pillar requires very high strength to protect the front occupants in the event of a high-speed frontal or side collision. Lower strengths and grades are required for the rocker, cantrail, and C-pillar parts. The four blanks are cut from the native material grade coil and joined using laser welding to form the single-door ring blank. This then undergoes a hot-forming process to achieve the design door ring shape and the Ultra High-Strength properties of press-hardened steel.
Consolidating four blanks into a single part significantly reduces scrap compared to a single blank part, and simplifies part manufacturing by eliminating other stamping and assembly processes with related cost savings. Higher material utilization means less steel is produced, resulting in lower costs and lower GHG emissions. The laser weld between the blanks helps achieve greater strength and stiffness to spot-welding four individual blanks.
Outlook
The latest AHSS grades and fabrication processes allow engineers to reduce the number of parts or blanks used in automotive body structures. Several part integration and consolidation processes have been applied and demonstrated in the Steel E-Motive concept. Part consolidation results in lower scrap rates, improved material utilization, reduced part cost, and GHG emissions. The integrated structures also improve overall stiffness and strength performance.

Thanks go to Neil McGregor for his contribution of this article to the AHSS Insights blog. As Chief Engineer, Systems Integration at Ricardo, Neil has extensive knowledge of lightweight, advanced materials across all major vehicle sub-systems and leads the Steel E-Motive vehicle engineering program at Ricardo.