Blog
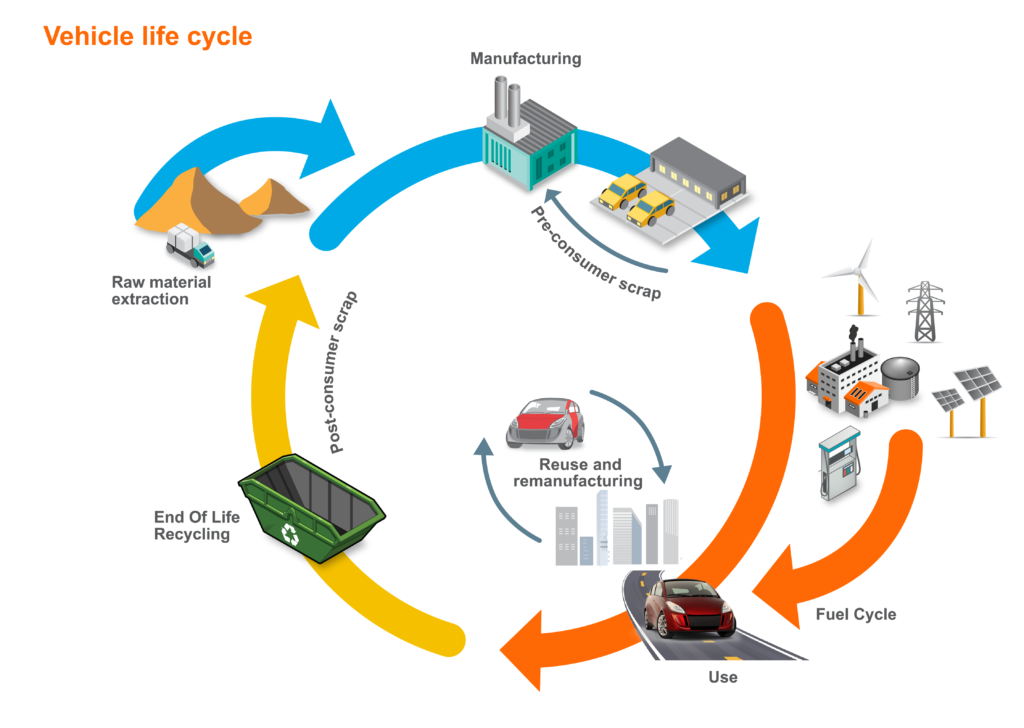
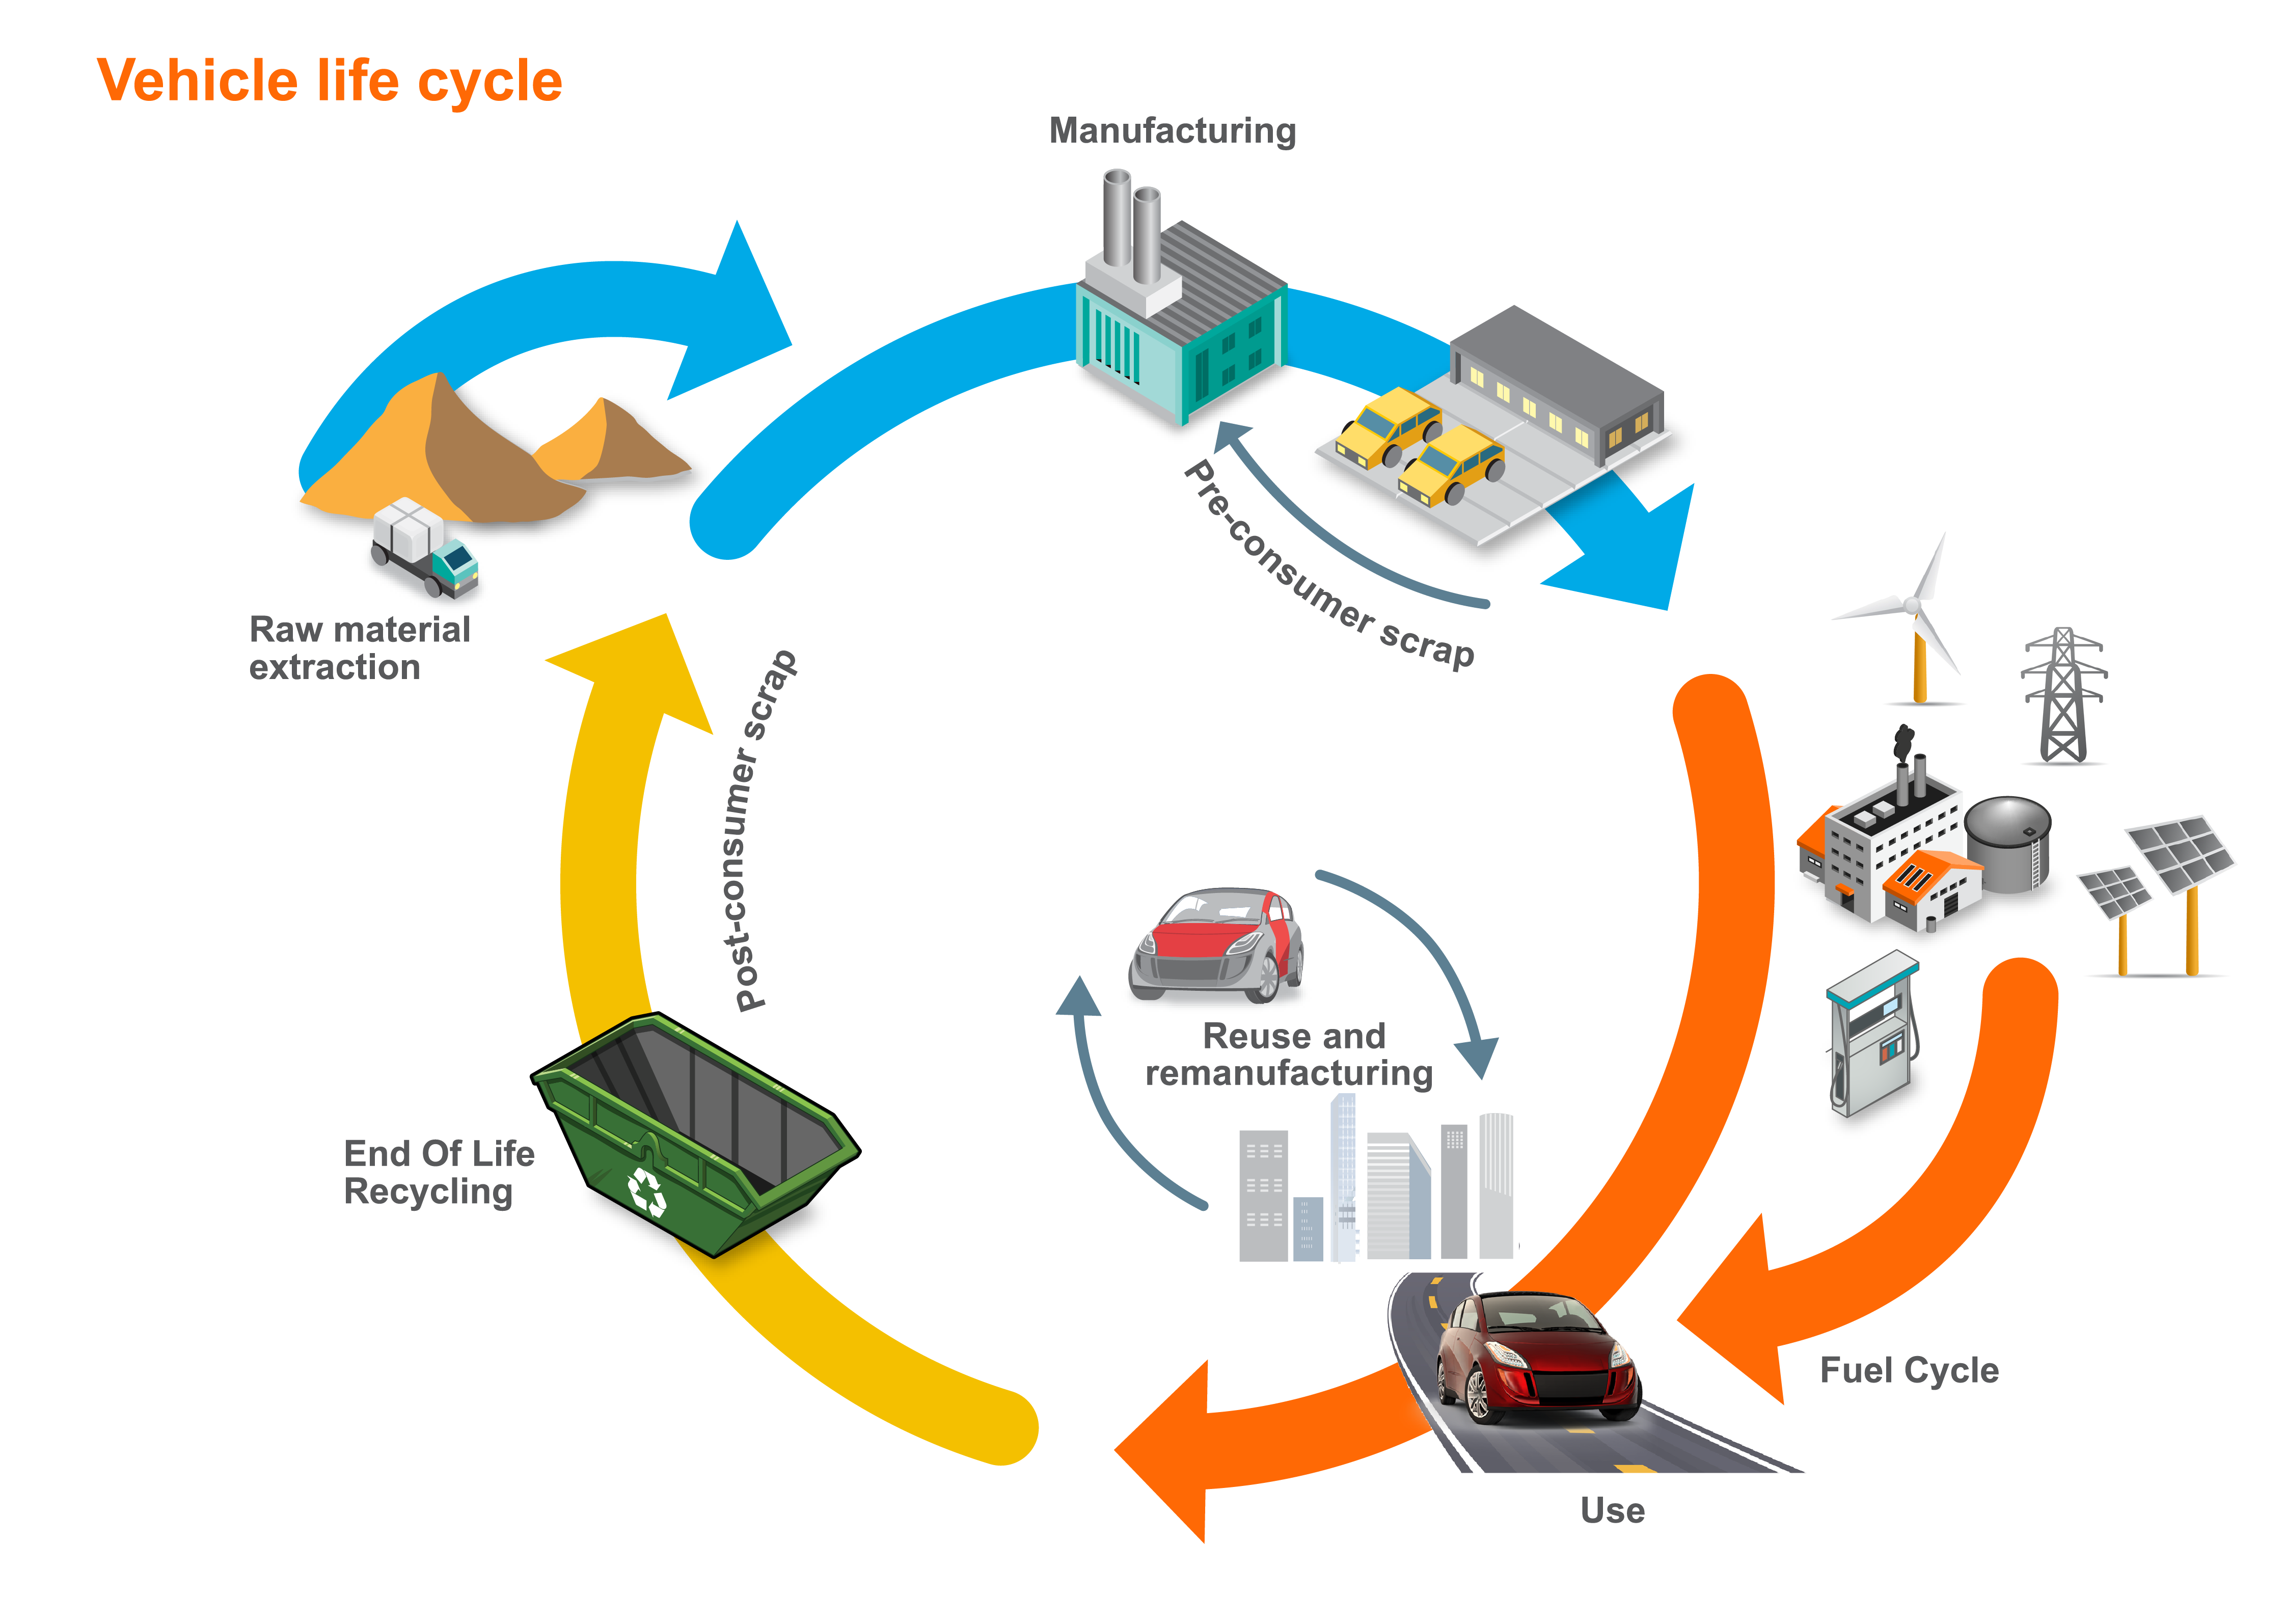
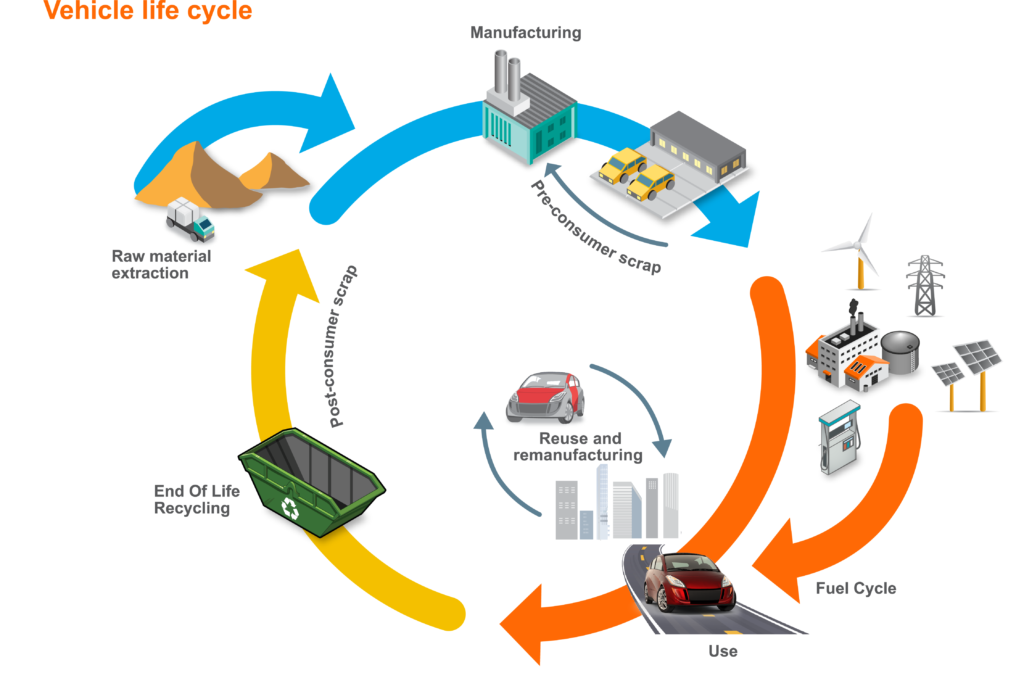
Vehicle LCA encompasses all phases of the product cycle, from raw material extraction to end of life recycling and disposal.
Life Cycle Assessment (LCA) continues to gain traction as the preferred method for assessing the environmental impacts of a product, and we are seeing more and more automotive LCA studies, and claims or conclusions based on LCA, being published. Here are five things to look for in an automotive LCA study. This is not an exhaustive list – there are many more things that need to be considered when conducting an LCA (the international standard that lays out requirements and guidelines for LCA, ISO 14044, lists 14). For a detailed look at LCA, I recommend Environmental Life Cycle Assessment, an excellent textbook published by the American Center for Life Cycle Assessment (ACLCA).
1. Is the study comparing “apples to apples”?
This can sometimes be a bit of a challenge in an automotive LCA, as cars are complex products made up of many systems and sub-systems, with supply chains that reach around the world. It is easy to lose sight of apparently subtle differences.
One such difference arises in material comparisons of an existing product and one at the design stage. Before making choices about which material has the lower impact, it is important to decide if this is a fair comparison. Have both designs been fully optimized? Does the theoretical design meet all the requirements (e.g. crash, NVH) of an existing design that has gone through all the additional steps necessary to get to production?
Functional equivalence is another important factor to consider. For example, it would be inappropriate to compare the “body” of a vehicle with a body-on-frame design with the “body” of a vehicle with a unibody design. Though both systems are casually referred to as the “body”, their functional requirements are very different. Similarly, when comparing an assembly of stamped parts to a single casting, it is important to include all the stamped parts that are required to meet the same functional performance as the cast part.
2. Has the best and most appropriate data been used?
As with any assessment tool, data is key, and there are many factors that can help determine which is the most appropriate to be used in a particular study. There are ten of these factors listed in ISO 14044, but I will only talk about three of them here. If you want more detail, Guidance on Data Quality Assessment for Life Cycle Inventory Data, published by USEPA’s National Risk Management Research Laboratory is a great resource.
Temporal scope – the temporal scope of the data describes when the data was collected, as well as the time period to which the data applies. An often-used rule of thumb is that the data used for the study should be no more than five years old. The goal is to use either data that reflects the time period when the product under study was actually produced or the most recent data that captures the current state of the art (these may of course be the same thing).
Geographical scope – the geographical scope of the data describes the location to which the data applies. This is critical, as the same process may have a very different impact profile in different locations. For example, primary aluminium made largely using electricity from hydropower in Canada will have a much different impact from primary aluminium made in China, where the electricity used comes almost entirely from coal. With automakers increasingly developing global platforms (i.e. using the same parts all over the world, as often as possible), it is important to consider how the results of an LCA might change if a product is produced in a region other than the one studied. The same is true when considering where a product is used. For example, the differences in electricity generation in Canada and China will greatly affect the impact of charging an electric vehicle.
Technological scope – the technological scope of the data describes the technology to which the data applies. Often the same product can be made from a variety of production pathways. Much like production in different regions, production via different pathways can result in much different impacts. An example of this is primary magnesium production. Magnesium produced via the Pidgeon process (a declining, but still-used method) can have a global warming impact more than 1.5 times higher than magnesium produced via the electrolytic method.
3. How sensitive are the results to changes in the choices made?
Because LCA involves choices about things like data and functional requirements (as well as a host of other parameter choices), it is important to understand what happens to the results if different choices are made or underlying conditions change. Inclusion of a sensitivity analysis of this kind allows us to evaluate the results of an LCA and look for areas that might require further study, perhaps by looking for more precise data. It could also affect decisions we might make based on the results. If the results of a study are very sensitive to the location in which the materials are made, we want to evaluate this if we are considering making the product in many different places.
4. What is the fundamental approach taken?
ISO 14040, which lays out the principles and framework for LCA, describes two fundamental approaches to LCA:
- one which assigns elementary flows and potential environmental impacts to a specific product system typically as an account of the history of the product, and
- one which studies the environmental consequences of possible (future) changes between alternative product systems.
It is important to consider which approach was used, and what the chosen approach means in terms of interpreting the results. In a very basic sense, the key lies in the words “history” and “future”. A study that considers the historical impact of a product (i.e. the impact of any product that has already been made) tells us about the impact of that particular product, but may be of limited use in making decisions about what the impact of that same product may be in the future. Studies of the potential future impact of a product, while necessary for decision making, are fraught with all the perils of predicting the future. Both approaches are valuable, and it is important to understand which approach was taken in order to make decisions about how to use the results of the study. The ILCD Handbook: General guide for Life Cycle Assessment, published by the Joint Research Center of the European Commission, provides guidance on when to use each approach in assessing the technological representativeness of LCI data.
5. How broadly can I apply the results?
It is often tempting to apply the results of a study more broadly than is justified. Given all the factors listed above (as well as the many others not included), it is critical that careful consideration be given when making decisions based on the results of automotive LCA studies in order to make sure that the scope of the study is in alignment with the scope of the decision. It is clearly inappropriate to make global decisions based on local studies, or to make future decisions based solely on past conditions. LCA is a valuable, well-developed tool for assessing environmental impacts, but we must be careful to use it appropriately.
The UCSB Automotive Energy and GHG Model, developed on behalf of WorldAutoSteel, is a publicly available, peer-reviewed tool for the assessment of automotive emissions on a life cycle basis. The model can be downloaded for free at www.worldautosteel.org. A user guide is also available for download.
Does the subject of Life Cycle Assessment confuse you or would you like to learn more? There is a great free online course at our sister organization steeluniversity, “Introduction to LCA”, taught by Dr. Matthias Finkbeiner, head of the department of Sustainability Engineering at Technical University of Berlin, who introduces LCA methodology to analyse the environmental burdens of product and service systems. The course is fun and interactive, and you can finish it at your own pace.

Russ Balzer, LCACP, Technical Director, WorldAutoSteel and Phoenix Group
Russ Balzer is the LCA Technical Director at WorldAutoSteel and Phoenix Group. As Technical Director, Russ manages a variety of engineering projects, and has tactical and strategic responsibilities in WorldAutoSteel’s efforts to use and promote Life Cycle Assessment (LCA). Russ recently achieved LCACP certification and was recognized for his work in the field of LCA with the ACLCA’s Rising Star Award.
Blog
While not an AHSS forming or joining topic, Life Cycle Assessment (LCA) is critical to truly reducing vehicle emissions for future generations. Russ Balzer, Technical Director at WorldAutoSteel covers in this blog its importance and the tools WorldAutoSteel has developed to provide environmental insight to design decision tradeoffs.
All over the world there are continuing and growing efforts to address transportation greenhouse gas (GHG) emissions, which remain a major unresolved issue. These efforts are intended to help the transportation sector make its contribution to global emissions reduction goals. Unfortunately, much of this effort is focused on reducing emissions only from the vehicle tailpipe, with no consideration of the other sources of emissions in that vehicle’s life. This is not an effective way to meet these goals. In fact, this approach could lead to the unintended consequence of increasing GHG emissions in some cases. Fortunately, there is a better way – life cycle assessment (LCA), a tool for looking at the environmental impact of a product across its entire life cycle (Figure 1).
Figure 1: Vehicle LCA encompasses all phases of the product cycle, from raw material extraction to end of life recycling and disposal.
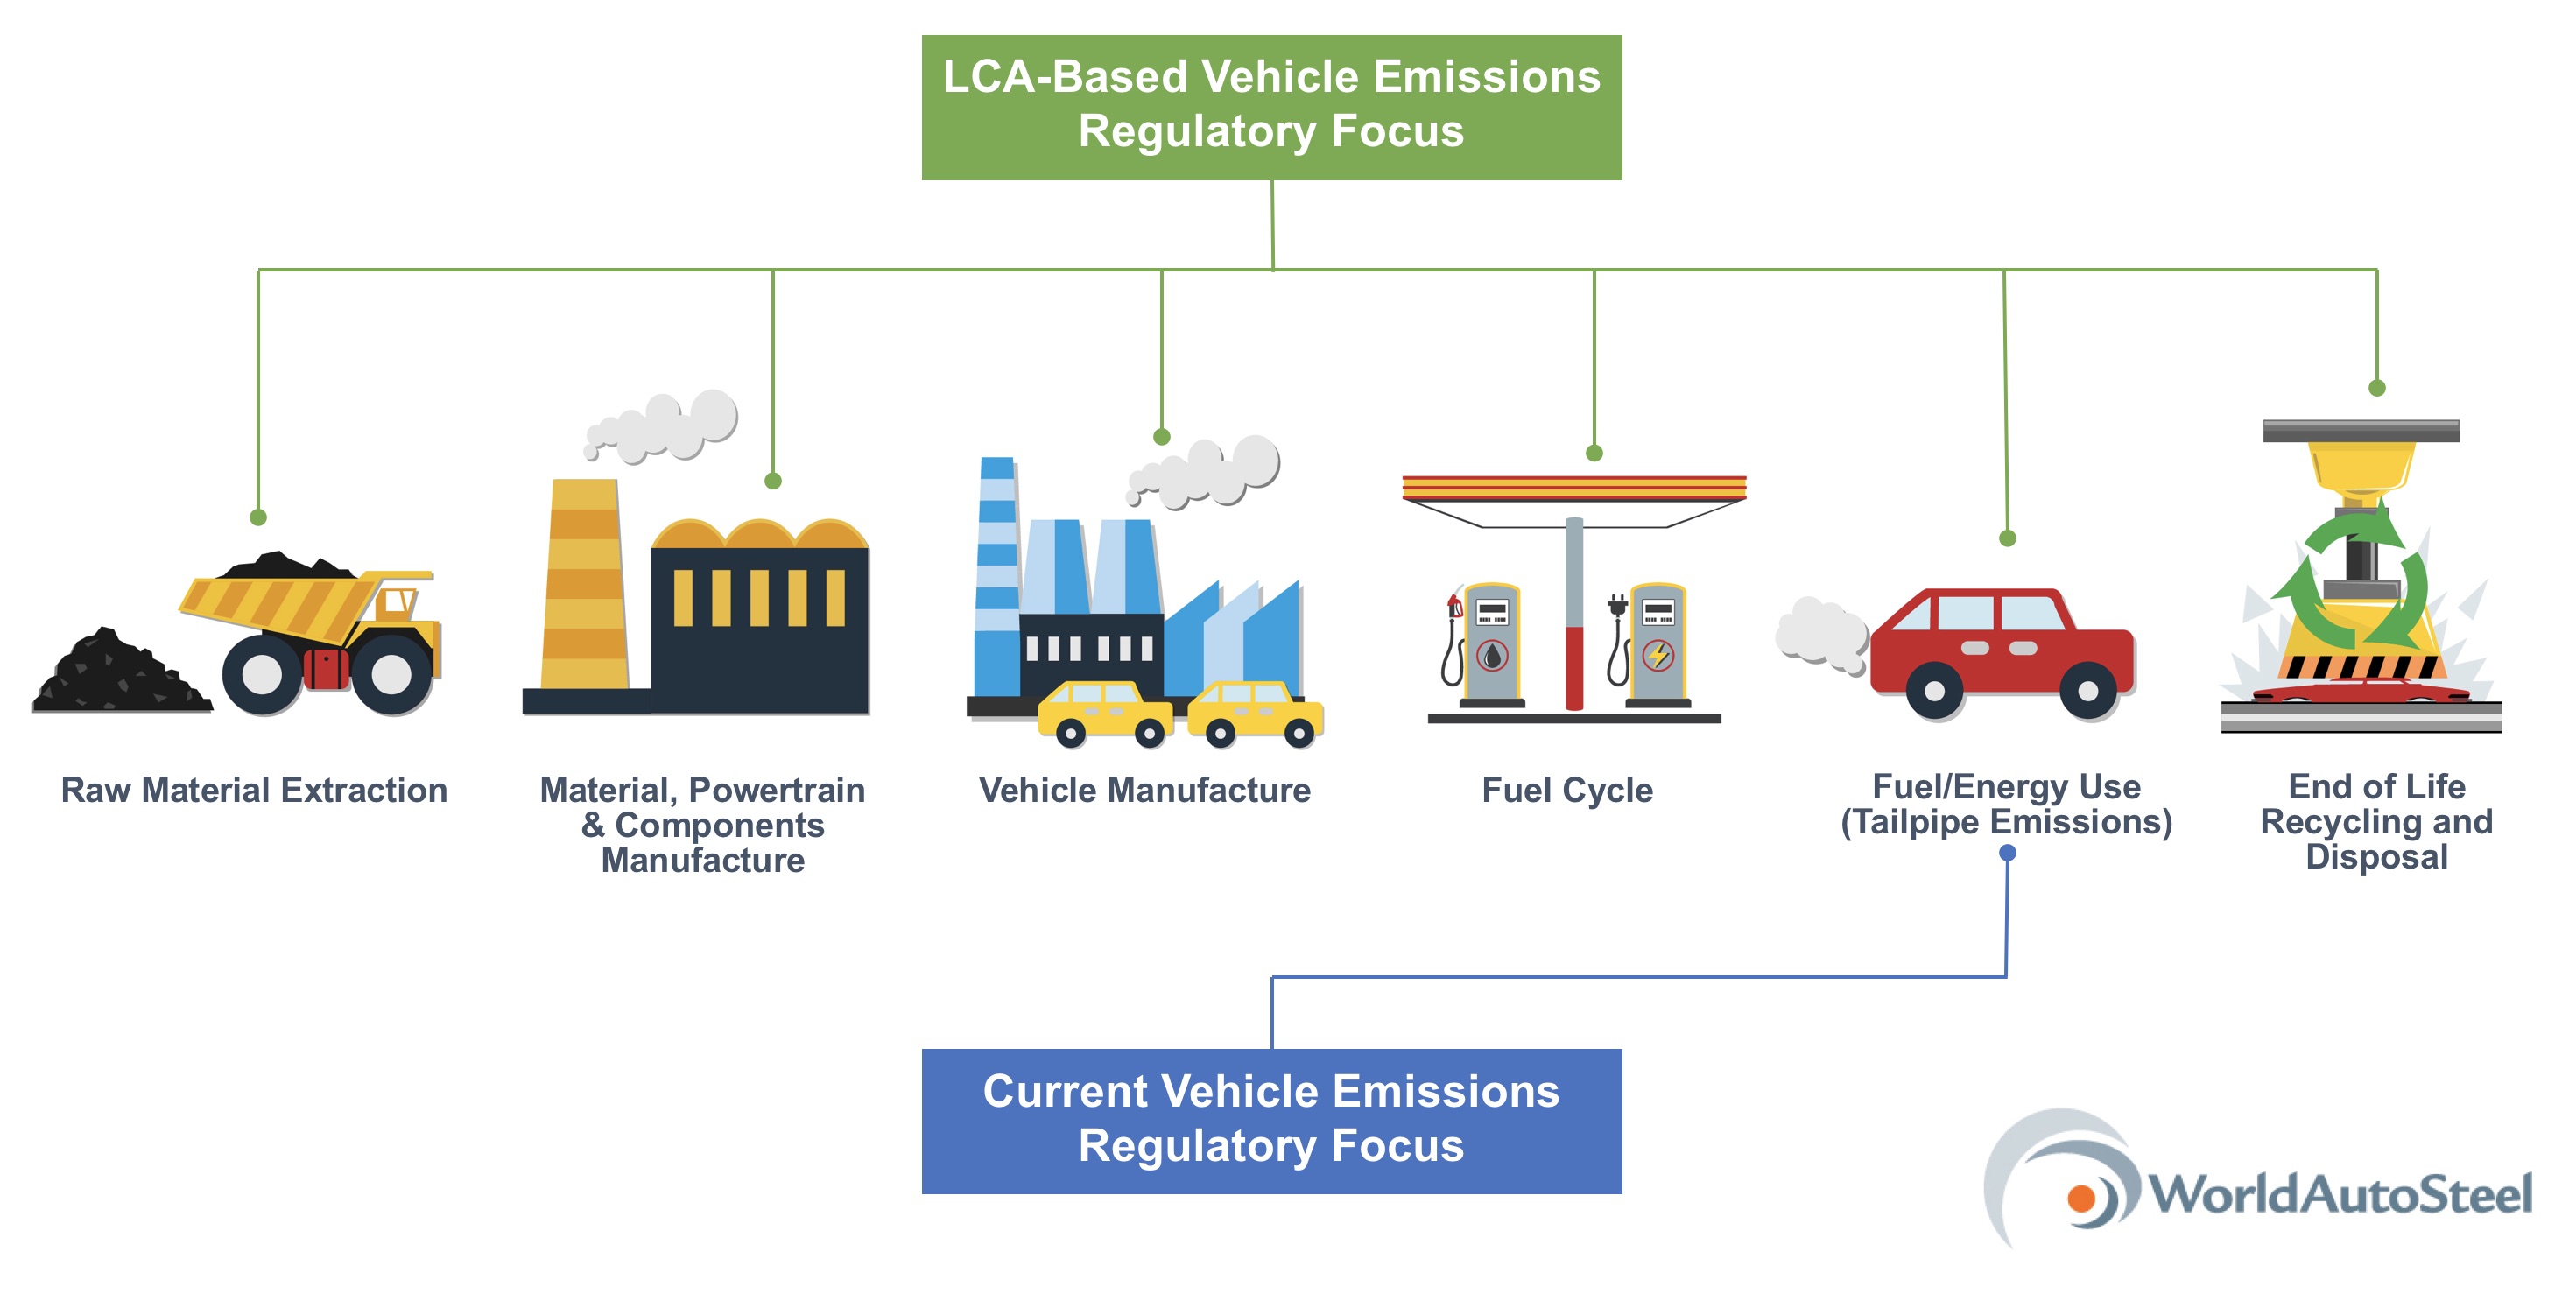
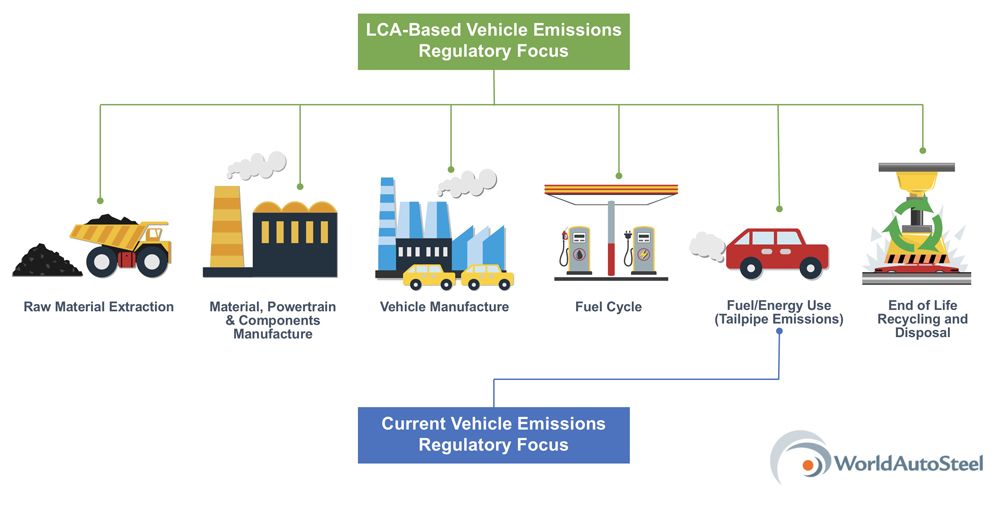
Focusing solely on the tailpipe emissions means ignoring other significant sources of GHG emissions, such as vehicle production and emissions generated (or avoided) at the end of the vehicle’s useful life (see Figure 2 on Page 2). An example of this is that tailpipe-only thinking can put too much emphasis on lightweighting. Don’t get me wrong, lightweighting can be an important part of the solution. Three of the four main drivers of fuel consumption (and therefore tailpipe emissions) – rolling resistance, acceleration and gravity (as in climbing a hill) – are dependent on the vehicle’s mass. So we can see why vehicle lightweighting is an obvious choice. It is a direct way to reduce these power demands and achieve better fuel consumption and fewer tailpipe emissions. The problem with lightweighting arises when we are so focused on reducing a vehicle’s mass that we fail to consider the consequences to the vehicle’s overall emissions.
One of the potential consequences arises from the use of lower-density materials like aluminium, magnesium and even carbon fibre to replace steel in a vehicle. From a tailpipe perspective, this can seem like a good (if expensive) solution. Vehicle mass may be reduced, resulting in improved fuel consumption and fewer tailpipe emissions. Sadly, it is not that simple. These low-density materials come with an environmental cost in addition to their higher financial cost. This cost comes in the form of higher GHG emissions in the production of the material itself. On a global average basis, GHG emissions from aluminium production can be as much as eight times as high per kilogram of material as the GHG emissions from steel production. For carbon fibre and magnesium the difference in production GHG emissions is even greater. This means that, even though you may save tailpipe emissions with some applications of these low-density materials, there is always a trade-off of higher production emissions.
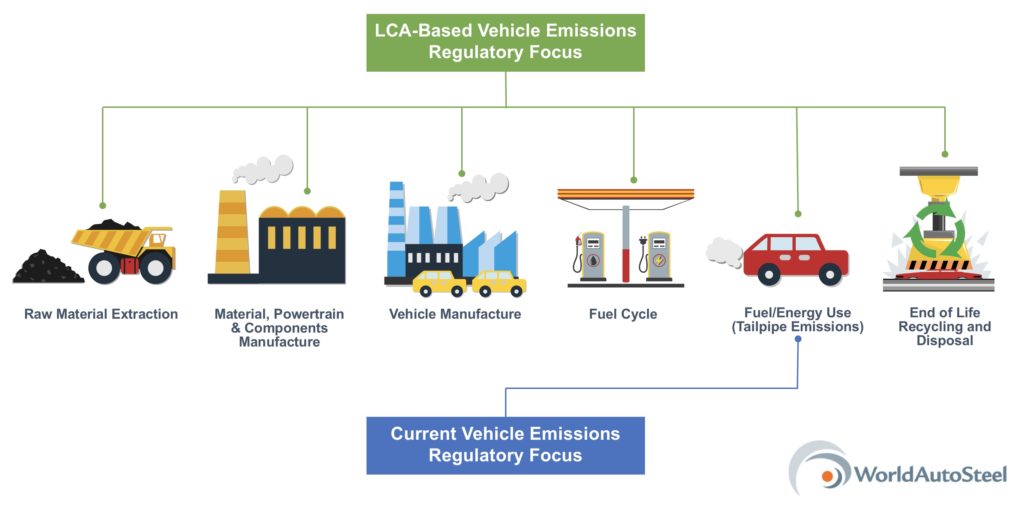
Figure 2: The difference between a regulatory focus that includes LCA and current tailpipe emissions.
In the best case, the reduction of emissions in the use phase does result in overall lower emissions, though, because of the trade-off between the tailpipe and production emissions, not as low as predicted by a tailpipe-only metric. Also possible is an intermediate case in which the use phase savings and the production phase increase are approximately equal, resulting in no net savings at all. In the worst case, the production emissions outweigh the use phase savings, resulting in the unintended consequence—higher overall emissions, the very opposite of what the regulation intends.
All three of these cases have two things in common. First, under a tailpipe-only regulation, we don’t know what the actual emissions are, because production emissions impacts are not being monitored. Second, because the low-density materials we are talking about are more expensive, all three of these cases come at a higher cost. So, we must ask ourselves: do we want to force automakers and consumers to pay more money without knowing the outcome? It’s time to consider another route to reducing emissions, and we believe that taking a life cycle approach is the correct route.
LCA assesses all the stages of a product’s life, from raw material extraction through production, use, and end of life processing. Though awareness of LCA has grown rapidly over the last 10-15 years, LCA methodology and practice have been developing since the early 1970s. Today, it is a mature assessment tool with global standards. Many car manufacturers are already using life cycle thinking and LCA, recognizing its importance and effectiveness in product and process design. LCA is equally accepted and used by material producers. In fact, together with many of their member companies, the trade associations of the steel, aluminium, and plastic industries are among the most active members of the global LCA community.
WorldAutoSteel has been directly involved with LCA since 2007, when we partnered with Dr. Roland Geyer of the University of California at Santa Barbara to develop an LCA tool for the assessment of material choices in passenger vehicles. The UCSB Automotive Materials Energy and Green House Gas (GHG) Comparison Model that Dr. Geyer developed on behalf of WorldAutoSteel is now in its fifth version and continues to be one of the most comprehensive publicly available vehicle LCA tools in the world.
The UCSB model is a full vehicle model assessing both GHG and energy effects of automotive material substitution over the entire life cycle of the vehicle.
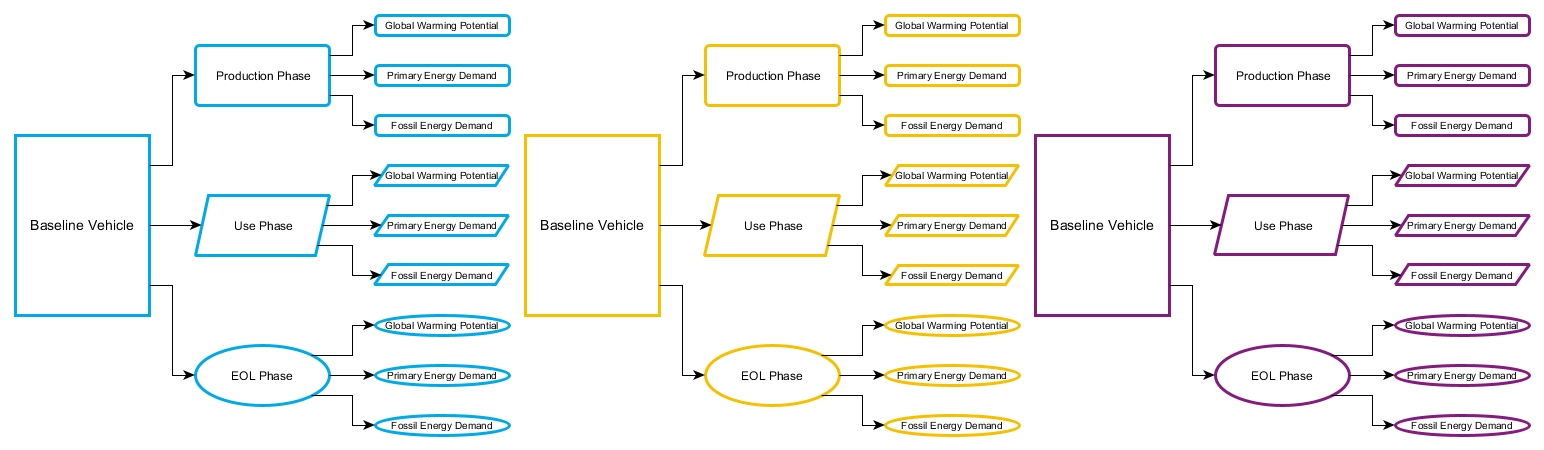
Computation and parameter values are kept separate for maximum transparency and flexibility. This allowed the computational structure to be peer reviewed by members of the LCA community. The model calculates 27 main result values: three environmental indicators x three life cycle stages x three vehicles, as shown in Figure 3.
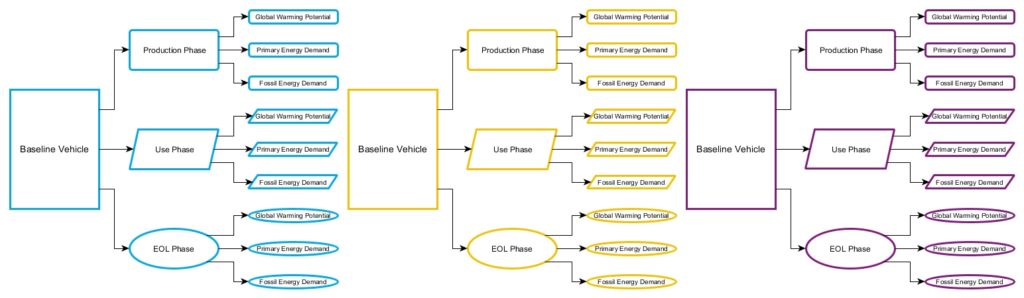
Figure 3: UCSB Model calculates 27 main result values.
The model has the flexibility to allow a multitude of different scenario evaluations, offering 14 structural material categories, 24 total material categories, adjustable material recycling methodology, a variety of biofuel and electricity pathways, as well as the powertrains, driving cycles and vehicle classes noted in Figure 4.

Figure 4: UCSB Model analysis options.
To maximize flexibility and transparency, all calculations are shown, and no parameter values are locked or hidden. This makes the UCSB Model an excellent tool for teaching LCA, particularly automotive LCA.
GHG emissions in the transport sector must be reduced to meet global emissions reduction goals. Lightweighting of passenger vehicles can be an important part of the emissions reduction solution in the transport sector, but only if lightweighting scenarios are viewed in the context of the overall vehicle emissions. Many companies inside and outside of the transport sector use Life Cycle Assessment, which considers environmental impacts from the whole of a vehicle’s life cycle, as their primary method to develop this overall view. The UCSB Automotive Energy and GHG Model, developed on behalf of WorldAutoSteel, is a publicly available, peer-reviewed tool for the assessment of automotive emissions on a life cycle basis. Version 5 of the UCSB Model can be downloaded for free at the WorldAutoSteel website here.

Russ Balzer, Technical Director, WorldAutoSteel
Russ Balzer is the LCA Technical Director at WorldAutoSteel and CEO of The Phoenix Group. Russ manages a variety of engineering projects, and has tactical and strategic responsibilities in WorldAutoSteel’s efforts to use and promote Life Cycle Assessment (LCA).
News
A common problem in every stamping plant is trim edge burrs. As new materials have been introduced, special trim breakage (clearance) or entry amounts may be required. Researchers are still trying to understand the edge stretching limits of these new materials. Edge stretching limits are directly linked to the reduction of the work hardening exponent (n-value) due to the cutting operation. As the material is cut during the coil slitting, blanking, trimming, or piercing operations, the tensile stretching on the sheared edge reduces the amount of formability remaining in the material. Finding the proper trim breakage and trim edge condition is critical. New test studies help steel producers understand the maximum stretch limits of the material they produce.
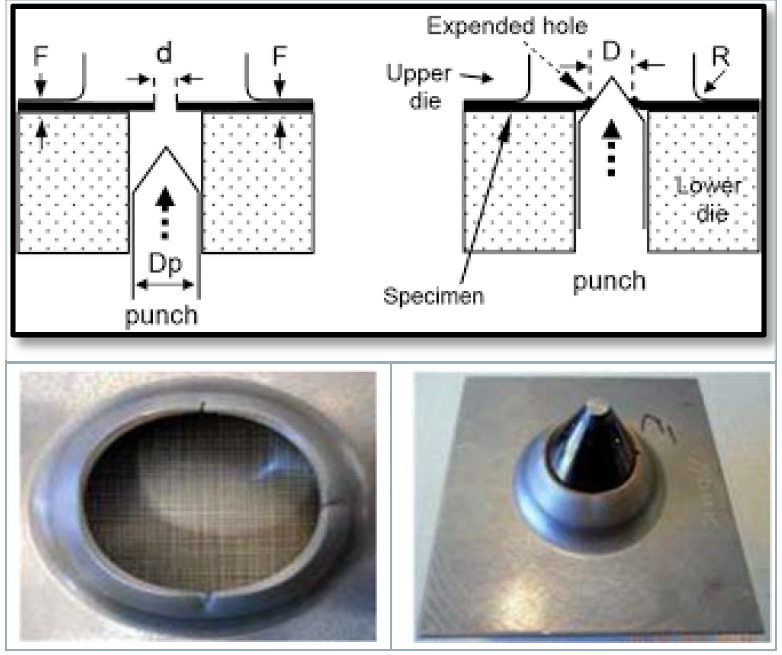
The Hole Expansion Test (HET) is the accepted form of measuring edge stretching limits. The test is performed by punching a hole in the center of a flat blank which is then clamped down, while a conical punch is pushed up through the hole, creating a stretch-flanged edge (see Figures 1 & 2). The output is the ratio of final hole diameter/initial hole diameter. The hole in the blank can be produced by various processes, to simulate manufacturing conditions. Some of the best results are produced by utilizing milled edges, laser cutting, EDM, and water jet.
In the world of stamping operations, reduced formability of a trim or pierced edge can equate to downtime, scrap, or rework. Since the use of EDM and Waterjets are not practical solutions, we evaluate current methods and materials that are available. The intention is to provide information to the people on the shop floor who might deal with this issue on any given day. Worn or chipped trim steels, improper clearances, and worn punches need to be repaired and maintained. New Advanced High-Strength Steels have lower forming limits compared to mild steel, and the introduction of a worn tool will reduce that forming range significantly. The use of powder metallurgy or cutting steels can help improve the number of hits between preventive maintenance intervals significantly. Some surface treatments can also extend tool life, achieving the same relative tool wear as conventional mild steels.
Figure 1: Schematic of a typical hole expansion test (HET)
conical punch/die setup.
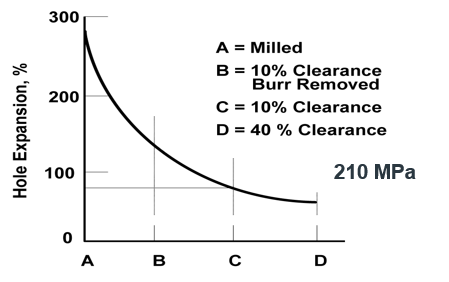
Figure 2: Schematic showing hole expansion capability for a 200 MPa mild steel for various punch conditions.
New grades such as Complex Phase (CP) steels have great strength, but also perform well in edge or stretch flange conditions because of bainite and grain refinement due to thermo-mechanical processing in the steel mill. Yet, the lack of proper tool maintenance can strip these steels of their performance advantage, as shown in Figure 3.
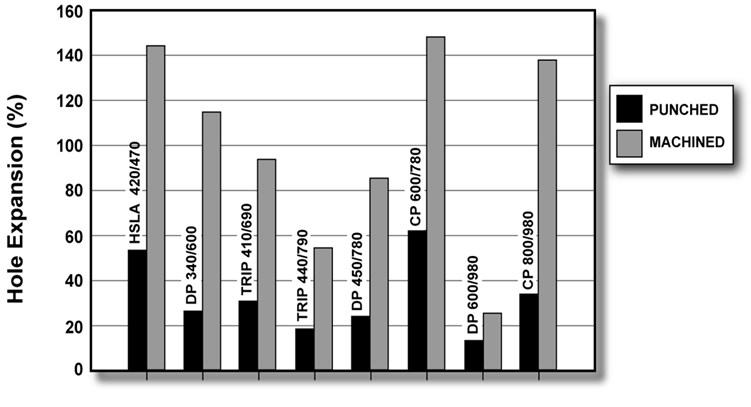
Figure 3: Hole expansion results for various AHSS grades, comparing effect of tool conditions.
Understanding the effects of tool wear rates, trim breakage, surface coating, and surface treatments will reduce downtime, scrap, and extend preventive maintenance intervals on trim and pierce dies. Providing training to the die makers on the newest materials, die components, and surface treatments available will help them make longer lasting corrections to stamping dies. Research and processes are evolving every day, resulting in new methods, products, and information for the successful stamping of Advanced High-Strength Steels.
Note: AHSS Application Guidelines Section 3.C.2 – Tool Materials and Die Wear contains more information that you may find helpful. Download the Guidelines free at www.worldautosteel.org.
Image References:
- Figure 1: (Schematic): H. Mohrbacher, “Advanced metallurgical concepts for DP steels with improved formability and damage resistance” – NiobelCon bvba
- Figure 2: R. Hilsen et al, “Stamping Potential of Hot-Rolled, Columbium-Bearing High-Strength Steels,” Proceedings of Microalloying 75 (1977).
- Figure 3: Courtesy of C. Walch, voestalpine Stahl GmbH.
Contributions made by Phoenix Group.
News
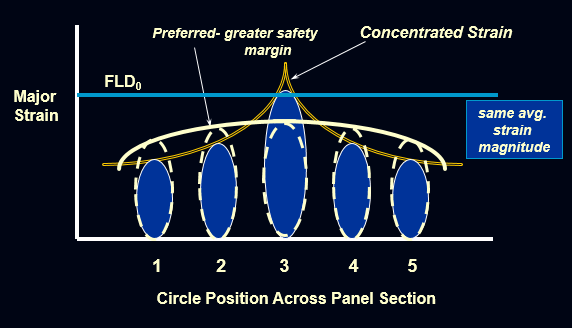
The mild steel currently being used for sheet metal stampings has higher n-values than High Strength Low Alloy Steel and Advanced High Strength Steel. The high n-value indicates that the material has a higher work hardening exponent making the steel much easier to stretch or form. The n-value describes how the material works together to resist localized fractures as stresses are applied. High strain patterns can be created in localized areas such as character lines and embossments. This strain pattern creates strain peaks or strain gradients. These strain peaks have much higher plastic deformation than areas on the rest of the material. The localized strain will cause the material to thin as it forms the character line or embossment. The die geometry does not allow the material to deform in stretch or draw modes, which means the material is in the plane strain mode of deformation on the Forming Limit Diagram (FLD). This deformation mode has the least amount of formability due to the location of the FLD₀anchoring point (See Figure 1).
Figure 1: Benefits of Uniformed Strain Distribution.
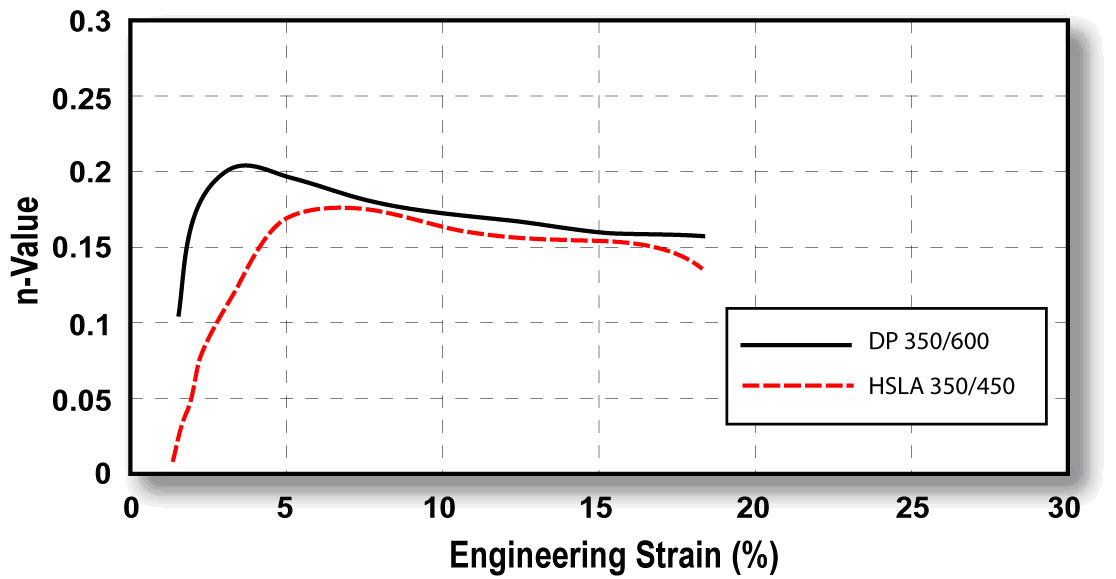
What does that mean for your stamping process? Mild steel has the ability to reach a high strain gradient due to higher n-values. High strength steels do not have the ability to reach the higher peak gradients due to lower n-values and less stretchability. These high strain areas will be more susceptible to a greater amount of thinning and/or fractures. If changes in the stamping process occur, such as reduced lube quantity, greater thinning can occur, at times exceeding minimum thickness and resulting in metal fracture. These concerns can be minimized through a better understanding of material capabilities, specific geometry effects, and the use of process recipe discipline. For example, Figure 2 compares the instantaneous n-value for Dual Phase steel, a member of the AHSS family, to HSLA steel. The early n-value increase reflects enhanced local formability, which is observed in stamped parts, contrary to what the typical stress-strain curve does not show the early n-value increase, which reflects enhanced formability in local regions of stamped parts. Other AHSS grades don’t show this tendency but have been developed with greater concentrations of bainite or finer dispersion of martensite within a ferrite matrix; both effects result in better localized forming.
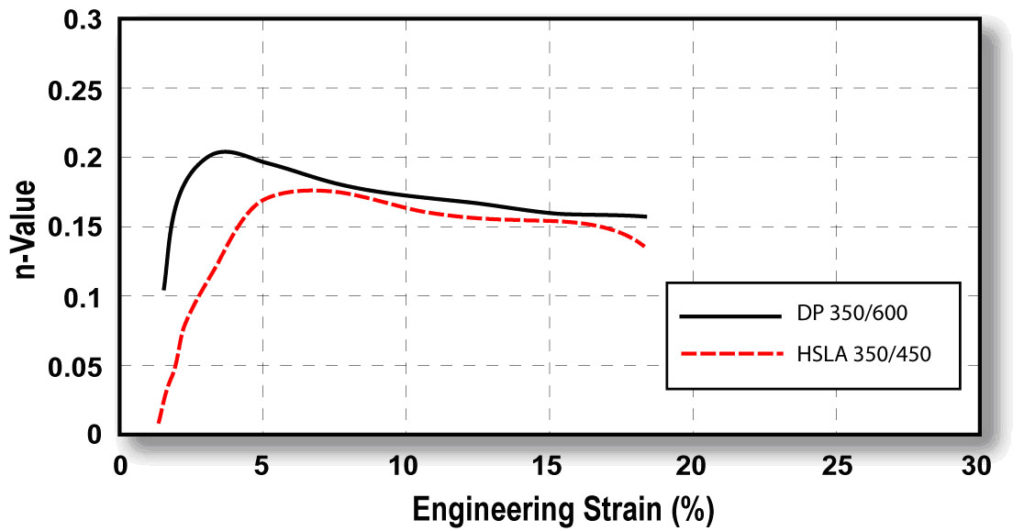
Figure 2: Instantaneous n-values versus strain for DP 350/600 and HSLA 350/450 steels.
Training die makers to understand these effects, while managing die geometry, will have a dramatic effect on the rework, downtime, and scrap associated with a conversion to AHSS products. The use of FLD₀ and formability analysis should identify areas of concern on the stamped part, but should also be coupled with hole expansion testing, or 2-D tension tests to more fully explore the formability condition. When trouble areas have been identified, there should be a review of the analysis and part with T&D managers, die makers, and quality personnel to formulate a corrective action plan. This plan should have specific and measurable direction, buy in, and understanding of the impact that die changes will have to the existing process.
BONUS!
Watch a video of renowned metallurgist Dr. Stuart Keeler explaining AHSS Instantaneous n-value:
Keeler On N-Value from worldautosteel on Vimeo.
Contributions made by Phoenix Group.
Figure 2 Image provided courtesy of Dr. Stuart Keeler.
News
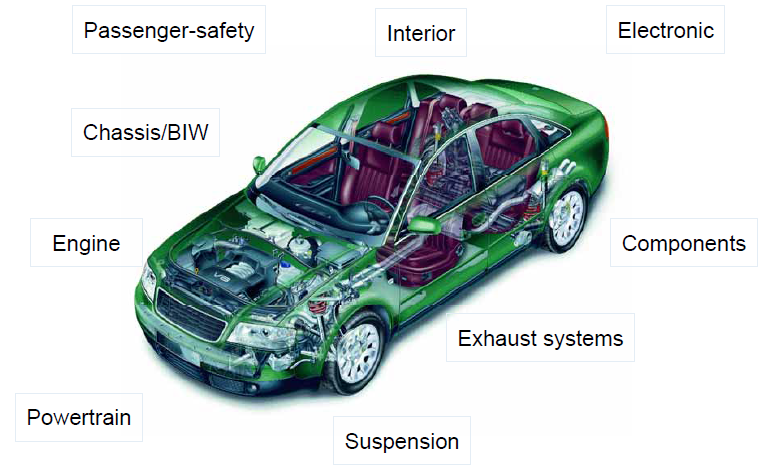
Figure 1: Laser Welding is commonly found in these vehicle subsystems.
Laser welding is finding its way into more vehicle applications due to inherent weld strength, adaptability to complex weld geometries, and lower part distortion (Figure 1). Automotive applications use a variety of welding joint designs for laser welding in both lap joint and seam butt joint configurations as shown in Figure 2. For example, laser butt-welding is used for welding tubes in roll-forming production lines as an alternative method for high frequency induction welding. Seam welds on butt joints need less power from the machine than lap joints due to the smaller weld fusion area, producing less distortion and a smaller heat affected zone (HAZ). Butt joint configurations are more cost efficient, however, the fit up for seam welds can be more difficult to obtain than those of lap joints.
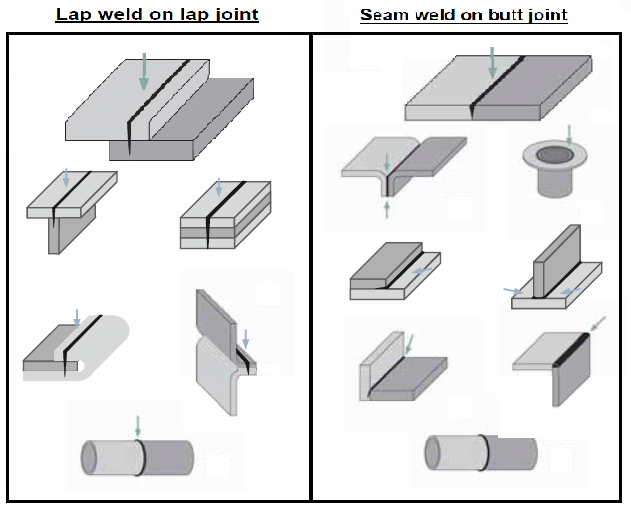
Figure 2: Common seam and joint types for laser welding of automotive applications.
When seam welding butt joint configurations, a general guideline for fit-up requirements include a gap of 3-10% the thickness of the thinnest sheet being welded, and an offset of 5-12% thickness of the thinnest sheet. Conversely, lap joints can require a gap of 5-10% the thickness of the top sheet being welded (Figure 3).
Laser welding is often used for AHSS lap (overlap) joints, but of course use different parameters compared to seam butt joint configurations. This type of weld is either a conventional weld with approximately 50% penetration in the bottom sheet or an edge weld. Welding is performed in the same way as for mild steels, but the clamping forces needed for a good joint fit-up are higher with AHSS than for mild steels. Lap joints tend to provide a larger process window, which can compensate for some of the manufacturing difficulties with AHSS, including springback and part distortion.
To achieve good laser-welded overlap joints for Zn-coated AHSS, a small intermittent gap (0.1-0.2 mm) between the sheets is recommended, which is identical to Zn-coated mild steels. In this way, the Zn does not get trapped in the melt, avoiding pores and other imperfections. An excessive gap can create an undesirable underfill on the topside of the weld.
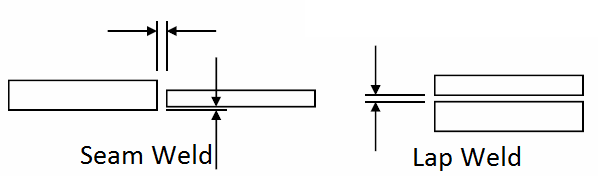
Figure 3: Fit-up requirements for butt joint and lap joint configurations in laser welding.
Studies have shown laser welding Zn-coated steels can be done without using a gap between the overlapped sheets. This is accomplished using dual laser beams. While the first beam is used to heat and evaporate the Zn coating, the second beam performs the welding. The dual laser beam configuration combines two laser-focusing heads using custom-designed fixtures.
AHSS grades can be laser butt-welded and are used in production of tailored products (tailor-welded blanks and tubes). The requirements for edge preparation of AHSS are similar to mild steels – in both cases, a good quality edge and a good fit-up are critical to achieve good quality welds.
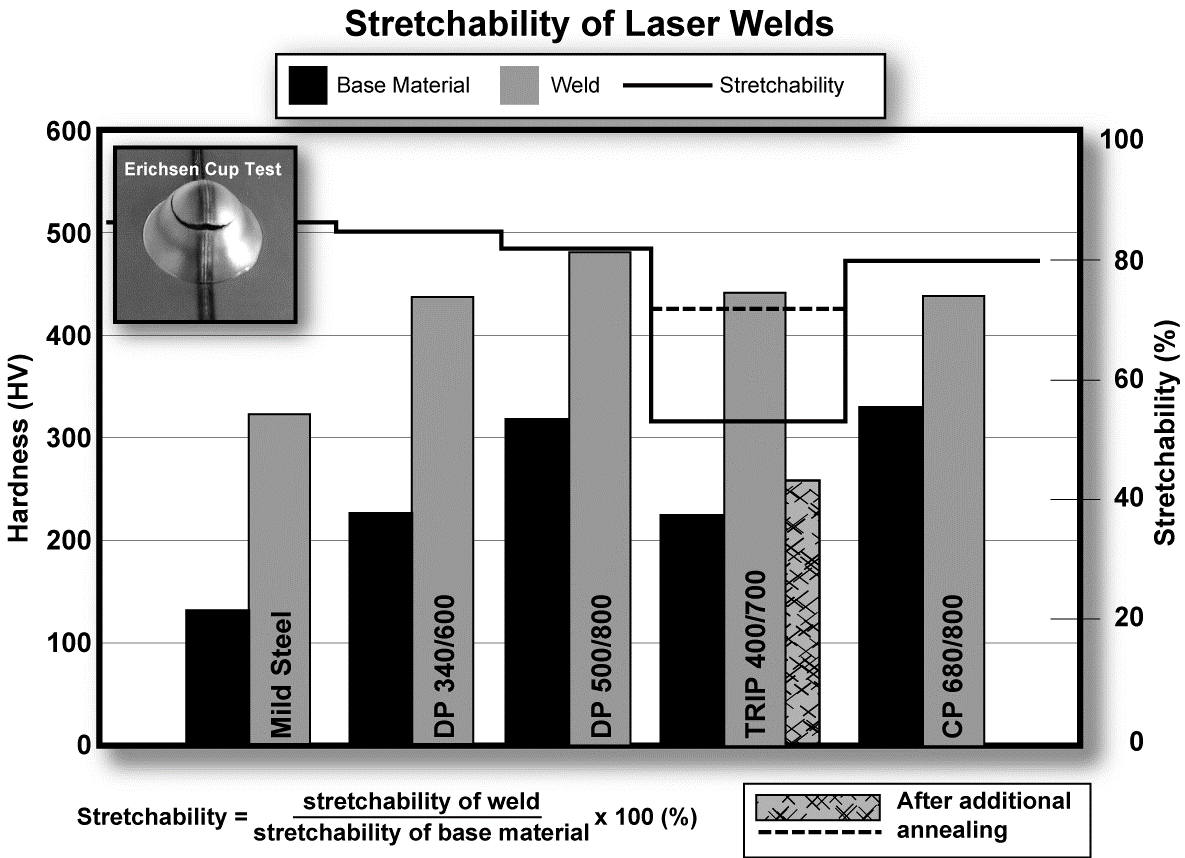
If a tailor-welded product is intended for use in a forming operation, a general stretchability test such as the Erichsen Olsen cup test can be used for assessment of the formability of the laser weld. AHSS with tensile strengths up to 800 MPa show good Erichsen test values (Figure 4).
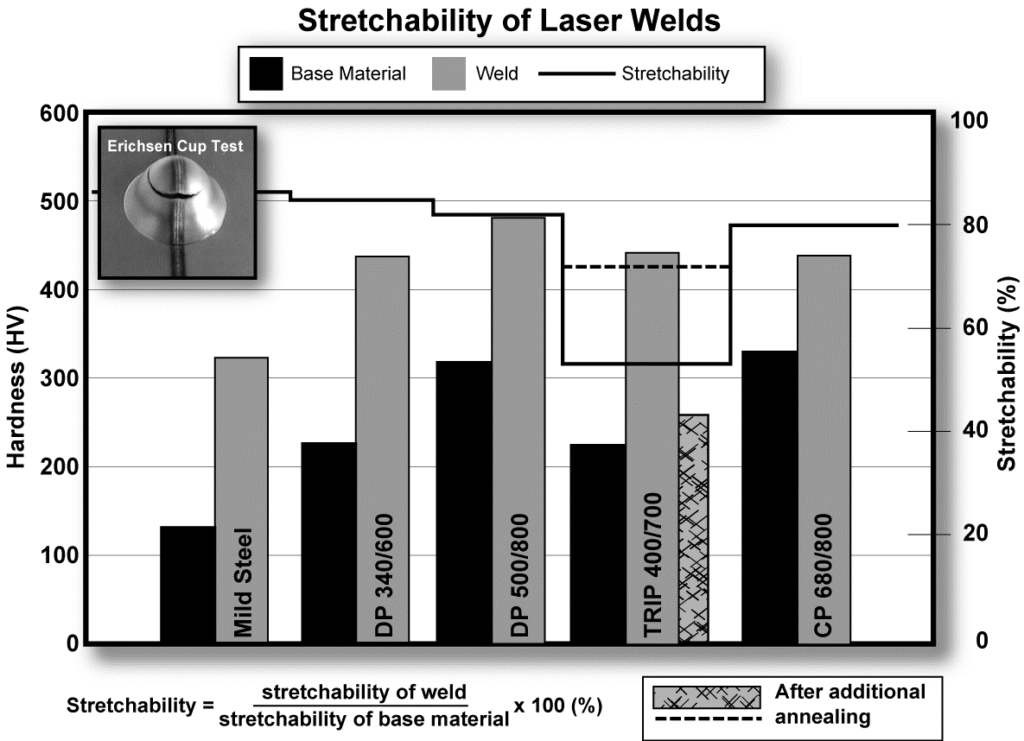
Figure 4: Hardness and stretchability of laser butt welds with two AHSS sheets of the same thickness (Erichsen test values describe the stretchability.)
The hardness of the laser welds for AHSS is higher than for mild steels (Figure 5). However, good stretchability ratios in the Erichsen test can still be achieved when the difference in hardness between weld metal and base metal is only slightly higher for AHSS compared to mild steels. If the hardness of the weld is too high, a post-annealing treatment (using HF-equipment or a second laser scan) may be used to reduce the hardness and improve the stretchability of the weld.
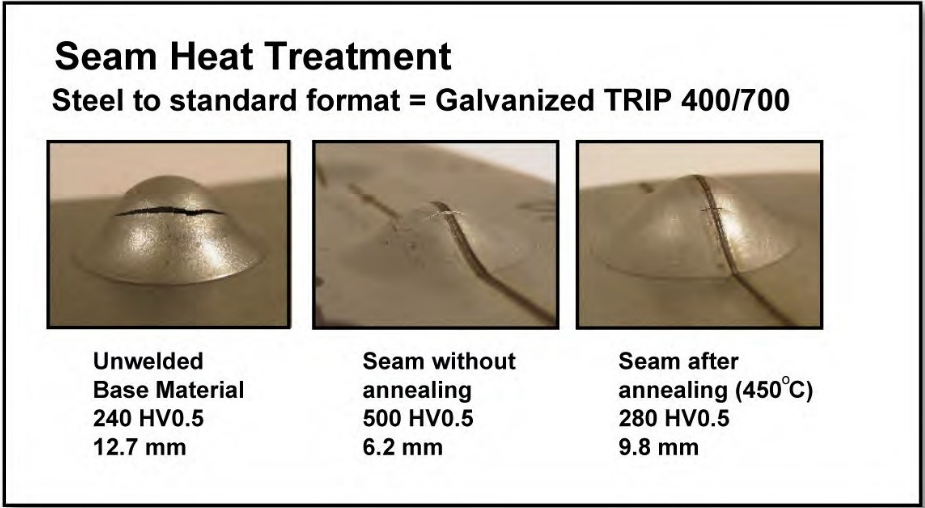
Figure 5: Improved stretchability of AHSS laser welds with an induction heating post-Heat treatment (Testing performed with Erichsen cup test)
Contributed by Menachem Kimchi, Ohio State University
Imagery and work thus represented is provided as follows:
Figure 2 and 3: Courtesy of TRUMPF
Figure 4: H. Beenken, “Joining of AHSS versus Mild Steel,” Processing State-of-the-Art Multi-phase Steel; European Automotive Supplier Conference, Berlin (September 23, 2004).
Figure 5: Courtesy of ThyssenKrupp Stahl.