Blog, main-blog
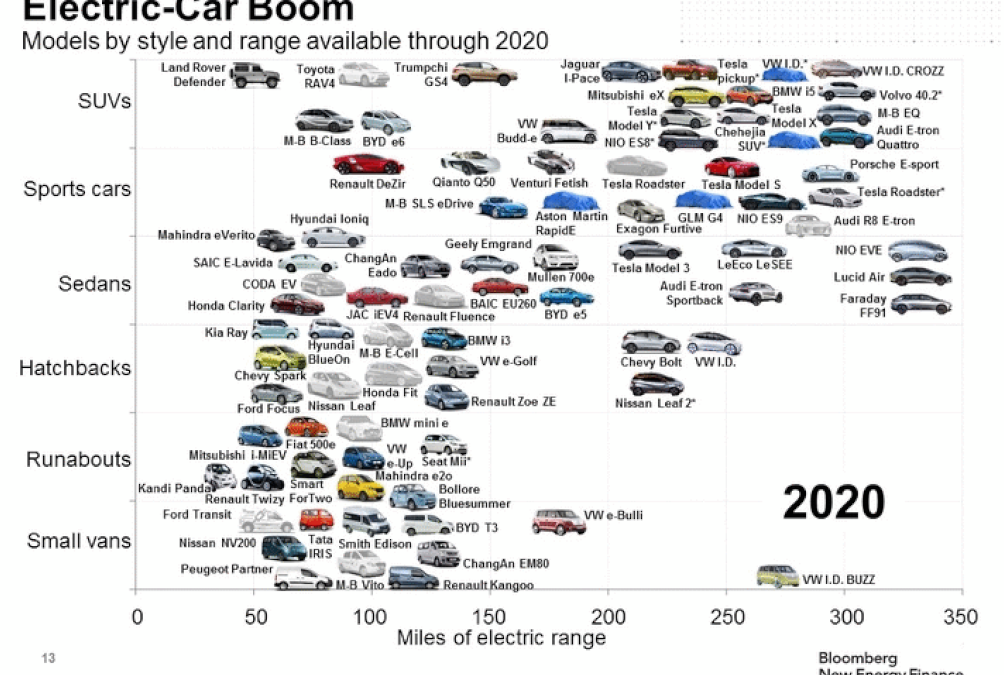
Several recent studies are forecasting that; “Within the next 10 to 15 years, urban transportation will be dominated by Electric and Automated vehicles”.B-50 Meaning most of us will be driving Battery Electric Vehicles (BEVs) in the not-distant future. In 2011, just eight years ago, there were only three BEVs on the market with 70 to 80 miles range on a single charge. These were the first generation BEVs. Since then, the number of EVs on the market has increased, with significant improvements in range (now approaching 300 miles). BEV 2020 vehicles cover all current segments, from small cars to SUV’s and trucks (Figure 1). These vehicles will be available from most OEMs as well as several new start-up companies. The construction material for body structures of these vehicles is predominantly steel, while some of the premium vehicles ($60,000 to $100,000) are aluminium. And the prevailing OEM message seems to be “anything TESLA can do, we can do better”.
So how will this change the vehicle body structure design, choice of construction material, its implications for manufacturing and assembly, and ultimately, the impact on automotive steel?
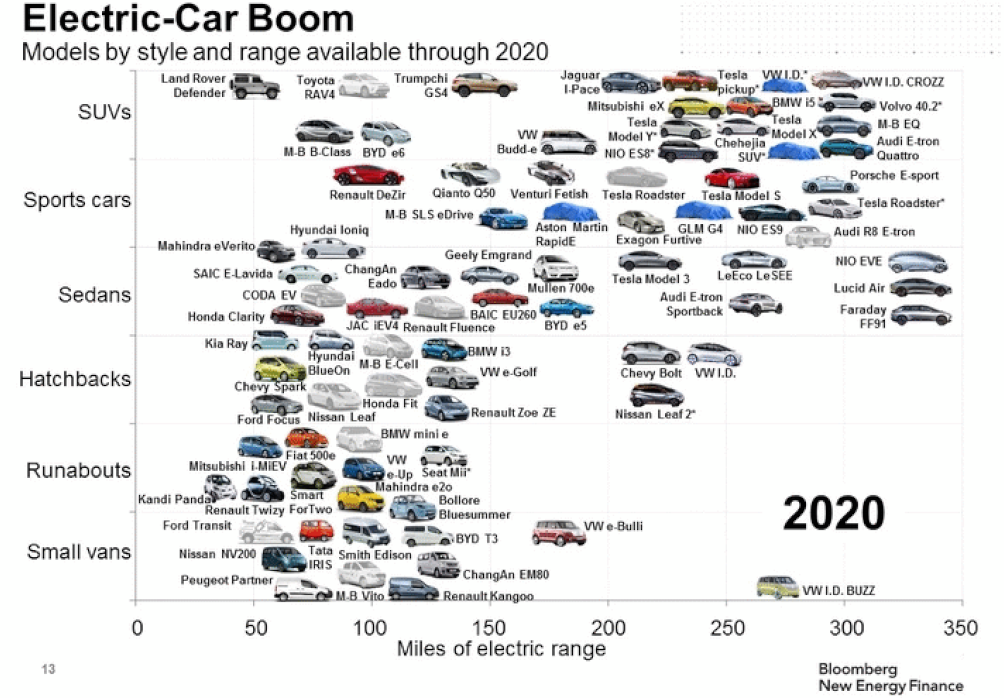
Figure 1: Electric Vehicle Boom – Models by Style and Range Available Through 2020.B-50 CHART SUMMARY: a) Covers all current segments, b) Structures predominantly Steel, c)Some premium vehicles highlight Aluminium, d)Products from most OEMs as well as several new start-up companies.
The driver for this electrification boom is increasing affordability. The upfront cost of BEVs will become competitive on an unsubsidized basis starting in 2024.F-38 By 2030 in the U.S., almost all light duty vehicle segments will reach cost parity as battery prices continue to fall.B-73 Forecasters, such as McKinsey, Morgan Stanley and Bloomberg, predict that about half of all new vehicle production will be electric somewhere between 2035 and 2040. However, Tesla’s CEO Elon Musk’s prediction is much more aggressive. He expects more than half of new vehicles in the U.S. will be electric within the next 10 years, roughly 10 to 15 years ahead of most other predictions.
The Main Drivers of BEV Cost Reduction
- Lithium-ion battery prices have fallen 75% since 2013, hitting $176/kWh in 2018 (Figure 2). Industry-wide prices fell due to the adoption of new cell designs and the availability of higher energy-density cathodes. Prices are expected to drop further in coming years to below $100 per kWh. Besides the reduction in cost, packaging efficiency and the cell energy density also is improving.
- Package space required by other BEV powertrain systems also is being optimized, e.g., motor, transmission, differential and power electronics. This is yielding significant weight and cost reductions, which are then directly reinvested into lower-cost structural materials, such as Advanced High-Strength Steels (AHSS) versus higher cost Aluminium, to keep the overall price of the vehicle low.
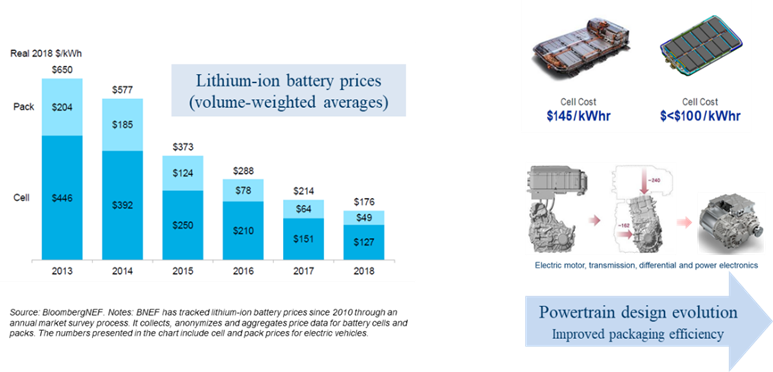
Figure 2: BEV Price Parity with Gas-powered Cars by 2024 – Main Drivers.B-74
BEV to ICE Vehicle Structural Differences and Advantages for Steel
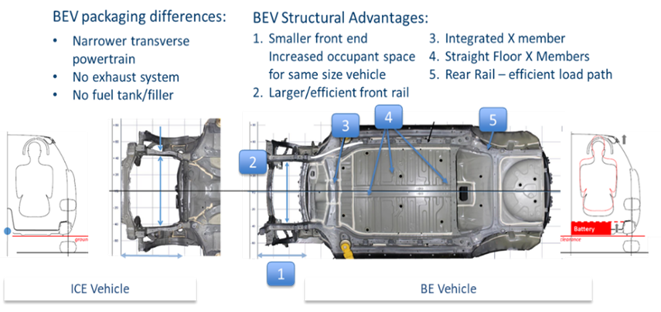
Figure 3: BEV to ICE Vehicle Structural Differences.M-64
BEV packaging differences compared with ICE Vehicles are shown in Figure 3, and include:
- Narrower and compact transverse electric powertrains, leading to shorter front end, with increased occupant space for same size vehicle and larger/efficient front crash rails.
- Lack of an exhaust system eliminates the need for the tunnel, allowing straighter/ efficient cross-members.
- No fuel tank/filler leads to more efficient rear rail load path.
- High voltage electric powertrain and large (300 litres, 500 kg) under-floor battery pack crash protection requirements result in higher safety requirements for BEV front and side structures.
- Safety. The BEV body structure load path requirements are ideal for AHSS application. The floor cross members, without the presence of the tunnel, are straight and can use very high-strength martensitic roll formed sections. Cross members can be stamped from 3rd Generation Steels offering Giga-Pascal strength and over 20% elongation. For frontal crash load management and to minimize passenger/battery compartment intrusions for increased safety, 3rd Generation steels offer the most mass/cost efficient solution. The very high strengths offered by AHSS and UHSS for the safety-critical structural members such as the rocker, rails, cross members and pillars, greatly enhance the required protection of the BEV powertrain and high energy/voltage battery systems. The battery enclosure construction greatly benefits from AHSS usage, providing protection from road-debris impacts from below the vehicle, along with fire protection into the passenger compartment. Advanced steels also enable reduced section sizes for the occupant compartment, required for improved panoramic visibility, without compromising occupant safety and comfort.
- Cost. For widespread adoption of BEVs to occur, the overall cost of the vehicle must be affordable, and its range must be above the ‘range anxiety limit’ of most drivers. Various surveys indicate this range to vary greatly from 75 miles to over 400 miles. Using steel for the vehicle structure leads to the lowest cost BEV, just as with ICE-based vehicles. The vehicle range can be increased through lightweighting and/or by increasing the size of the battery; a cost comparison of these two options is shown in Figure 4. With battery cost reduction approaching $100 per kWh, lightweighting is cost effective at approximately US$2.00 per kg saved. Lightweighting is still very important and the latest steel grades, in particular 3rd Generation steels, offer the most cost-effective lightweighting option. In comparison, if we consider lightweighting with aluminium, the cost is typically in the order of US$6.00 per kg saved. This could be cost effective if the battery cost is over $250 per kWh, which was the case a decade ago. We can see the evidence of this in OEM decisions at that time. For example, the 2011 Nissan Leaf BEV closures were aluminium; but the latest 2019 Nissan leaf BEV closures are steel.

Figure 4: BEV Range Increase – Lightweighting Cost versus Battery Cost 2020 – 2022.M-64
Battery Electric Vehicles – Boom or Bust for AHSS?
For the increased safety required for BEVs to protect the high voltage systems, the structural load paths are ideally suited for the Giga Pascal level strengths offered by AHSS and UHSS. The Battery Enclosure structure offer an additional 85 kg per vehicle opportunity, an increase of approximately 10% sheet metal over ICE vehicles. Also, using advanced steels the BEV structure can take full advantage of well-established body shop practices for manufacturing and assembly, such as stamping, roll forming and spot welding. With future increased focus on BEV affordability, safety and sustainability, steel offers the best solutions and flexibility to address these key challenges.

Blog
We’ve been monitoring the evolution of vehicle legislation in the world closely, advocating for life cycle thinking to be considered for the next generation of regulations. The European Union has been actively pursuing Post 2020 regulations, looking hard at CO2 emissions reduction. On 15 May 2019, the new EU CO2 emission legislation for cars and vans for the post-2021 period entered into force, with the objective of contributing to decarbonisation and modernisation of Europe’s road transport sector in line with the EU’s commitments under the Paris International Climate Agreement. The main instrument to achieve this is a further reduction of tailpipe CO2 emissions from new cars by 37.5% by 2030 compared with the 2021 baseline as well as providing incentives to car manufacturers to sell more low-emission vehicles (<50gCO2/km) in the EU.
The direction of EU policy appears clear: cars need to emit less CO2. Others are questioning the focus on emissions reduction in the use phase of a vehicle and whether this will result in overall emissions savings. In fact, improvements in the driving phase could be cancelled out by increased emissions from the production and later the recycling of the vehicle as manufacturers turn to alternative materials and powertrains that could be more energy intensive to produce.
So, what is the solution?
Perhaps it is already in the recently adopted EU. The legislative text is for all intents and purposes a continuation of the existing CO2 emission legislation with more stringent tailpipe-based targets and verification. Yet it features one notable new element: the idea of reporting on the life cycle emissions of cars.
Article 7 – Monitoring and reporting of average emissions
10. The Commission shall no later than 2023 evaluate the possibility of developing a common Union methodology for the assessment and the consistent data reporting of the full life-cycle CO2 emissions of passenger cars and light commercial vehicles that are placed on the Union market. The Commission shall transmit to the European Parliament and to the Council that evaluation, including, where appropriate, proposals for follow-up measures, such as legislative proposals.
By 2023, the European Commission is tasked with assessing the feasibility of creating an EU methodology for harmonised and consistent reporting of full vehicle life cycle CO2 emissions.
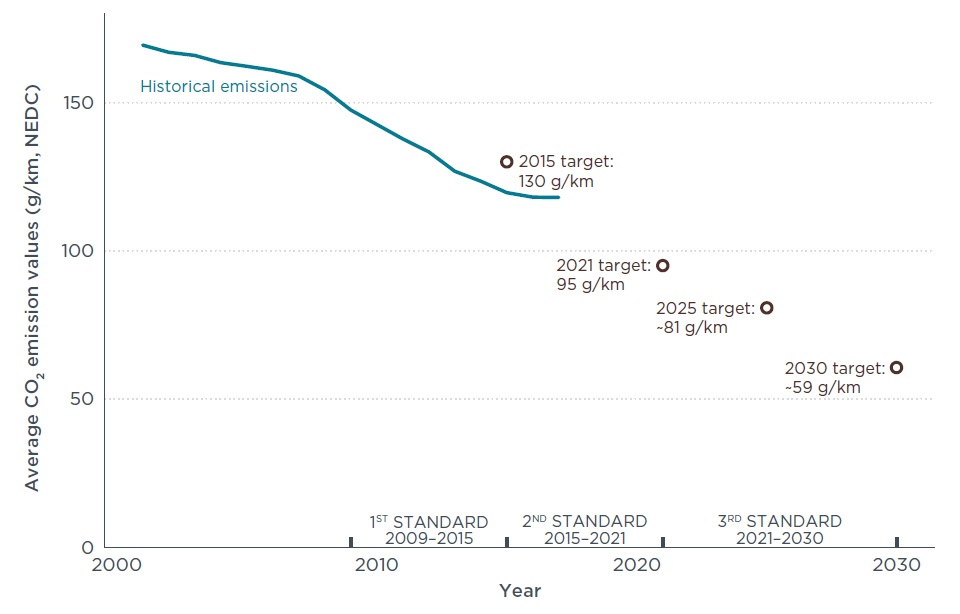
Figure 1: Average historical CO2 emission values and adopted CO2 standards for new passenger cars in the EU. All CO2 values refer to New European Driving Cycle (NEDC) measurements. Source: ICCT
With a reporting framework of this kind, regulators could better anticipate the impact of changes in the vehicle fleet on overall emissions and identify the appropriate policy instruments, thereby being able to future-proof the legislation.
Going forward, the European Commission is expected to undertake a feasibility study to identify possible ways to measure vehicle life cycle emissions in a consistent and harmonised way. The conclusions of this work and any possible recommendations for implementing the methodology into EU law would be part of a report to the European Parliament in time for a review of the Regulation by 2023.
As life cycle assessments are already used by a wide range of stakeholders in the automotive sector, it will also be up to them to contribute to this work and help ensure future debates on the best way to decarbonise the EU road transport sector can draw on their experience.

Blog, main-blog
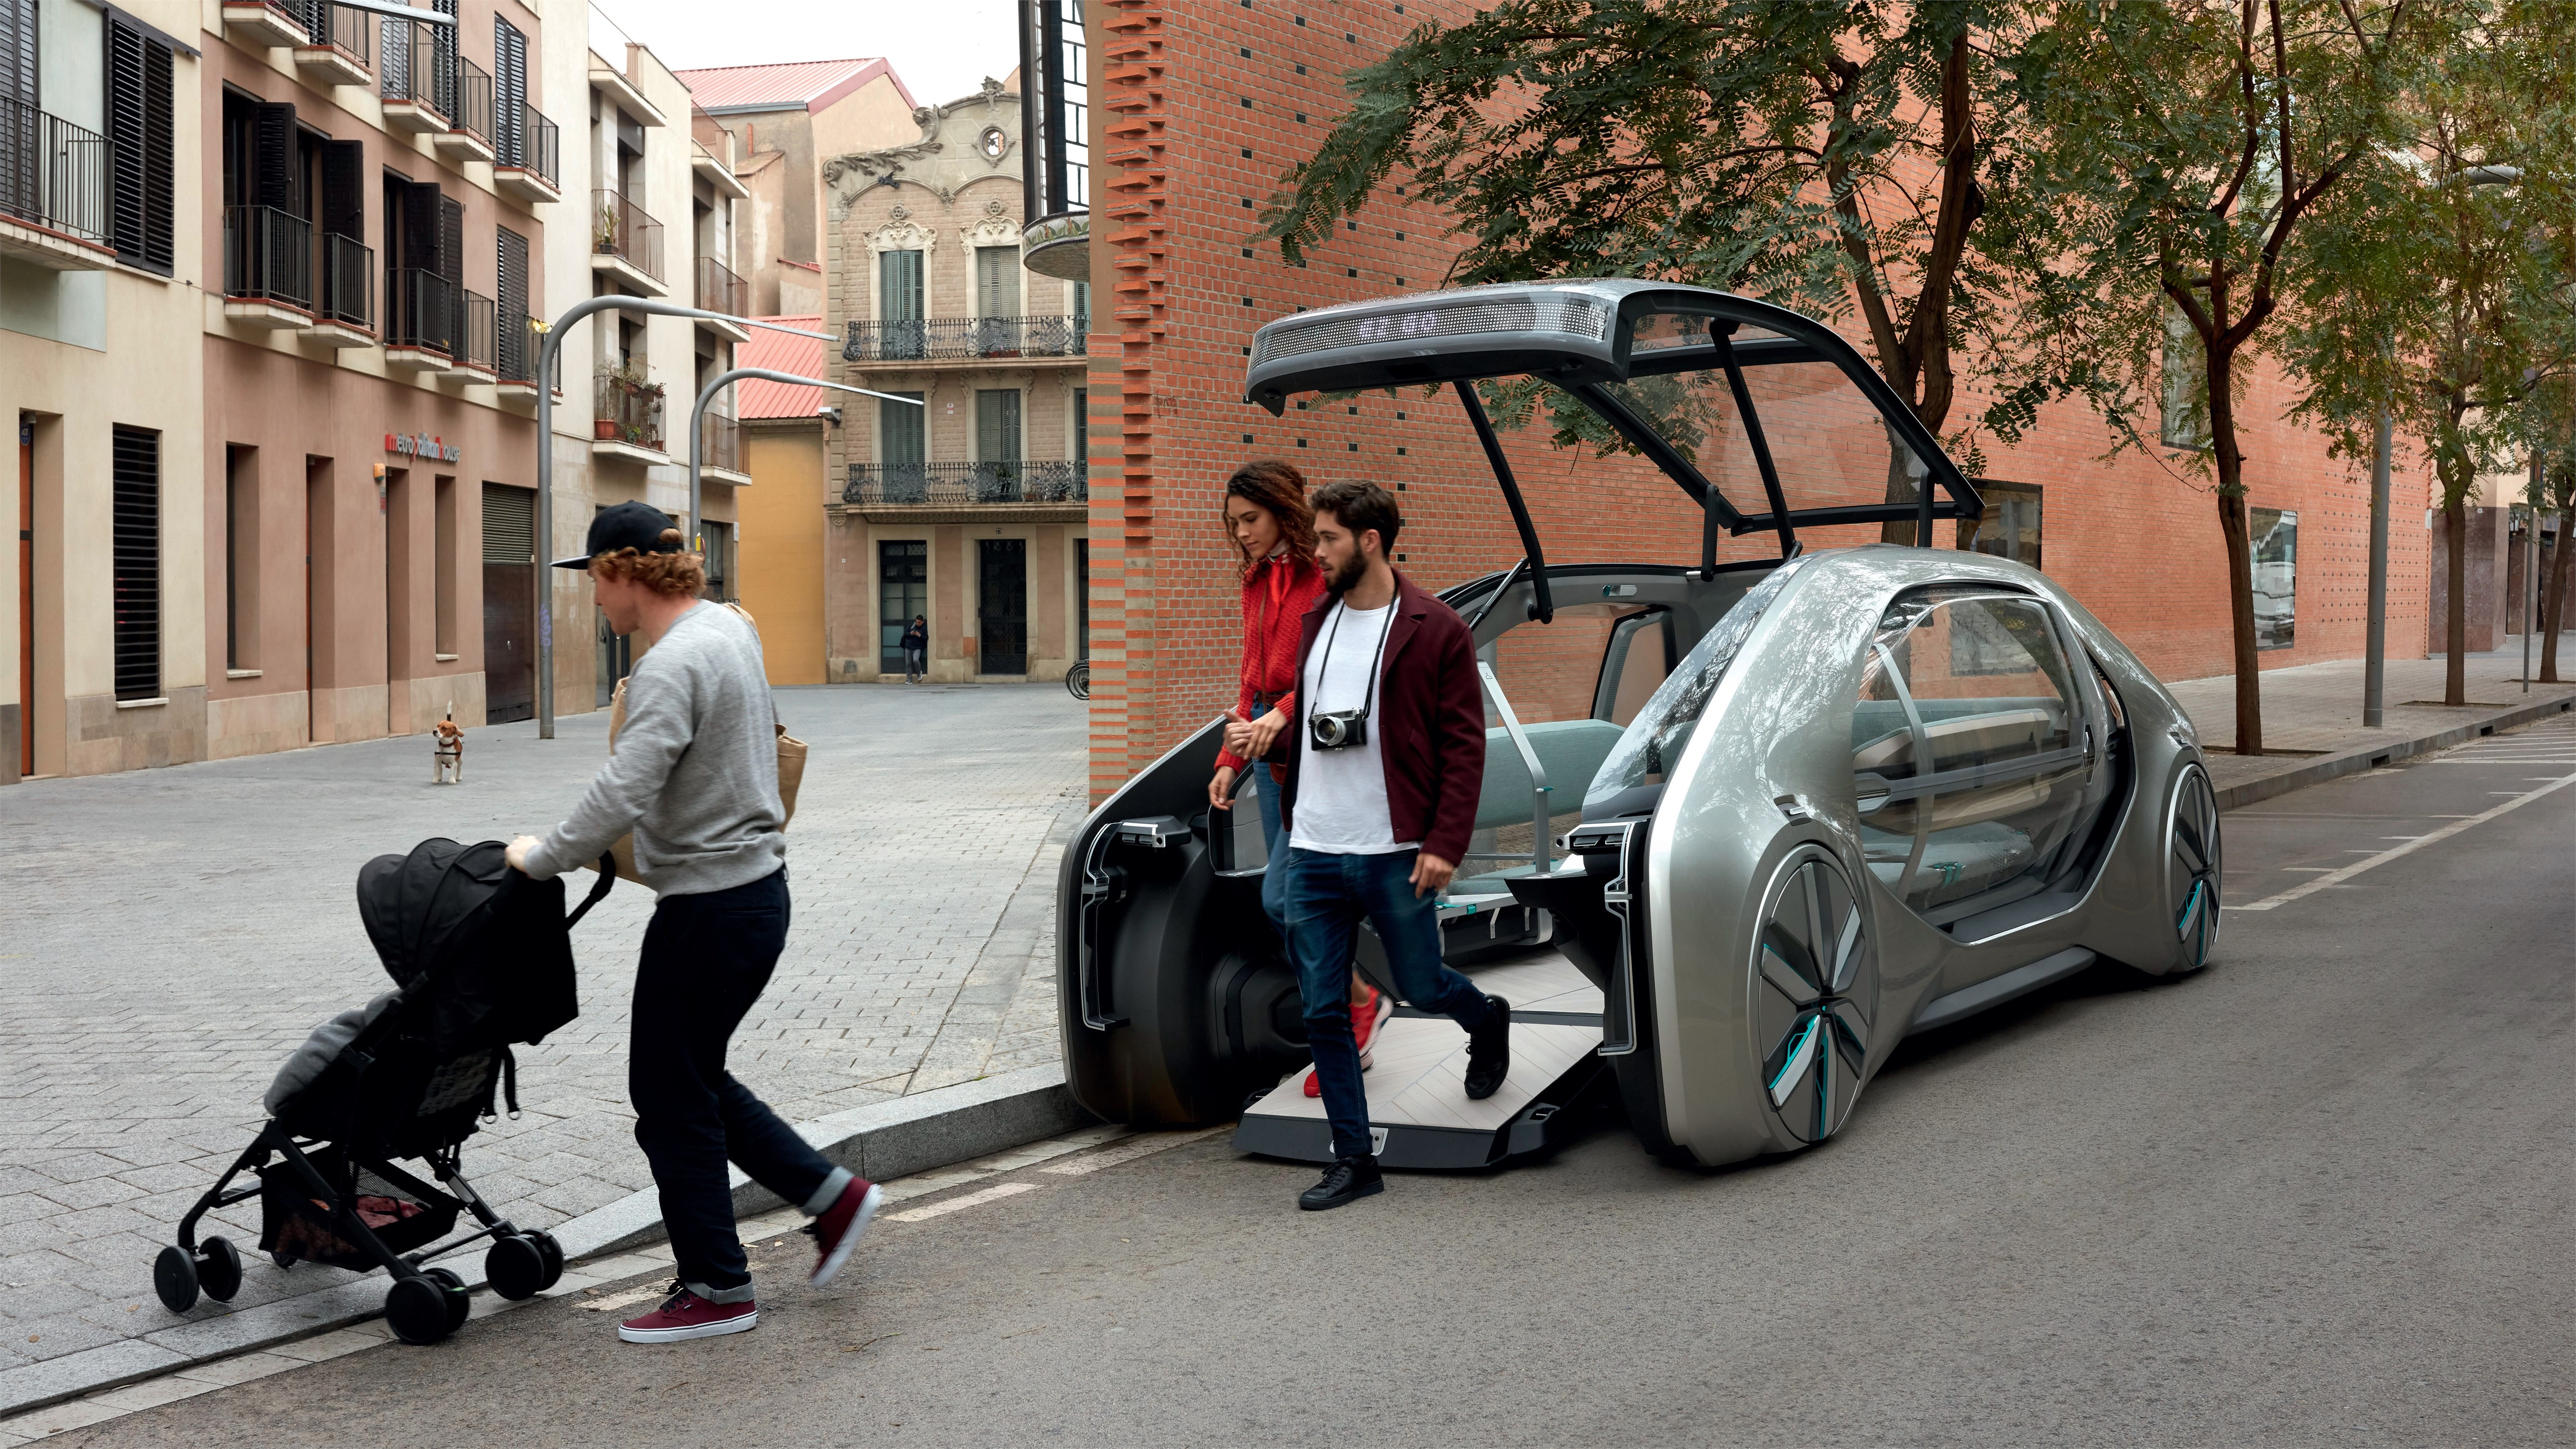
Here at WorldAutoSteel, we have been studying the changes in the automotive industry for several years, focusing particularly on ride sharing, autonomous, electric vehicles and steel’s role in that marketplace. George Coates, Technical Director for WorldAutoSteel and The Phoenix Group, has been leading that effort and today contributes an article on the disruption of future mobility to the industry and the great opportunities we see for steel in meeting the challenges providers will face. We hope you enjoy the read, and we welcome your thoughts and comments. What changes and impacts do you envision for vehicle manufacture? How do you feel about the world of autonomy?
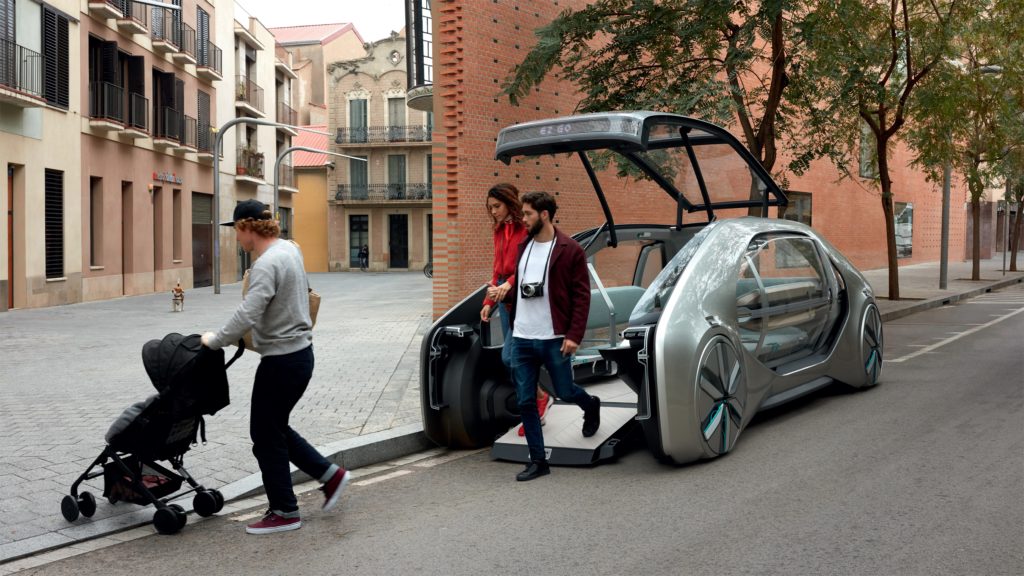
Renault’s Future Mobility concept, the E-Z Go
We’re approaching a critical milestone in automotive history when what we know as normal is about to change significantly. Future Mobility describes the revolution that’s already begun. We’re rethinking transportation from the movement of a vehicle to a more efficient concept for moving people and things. We’re about to discover the social advantages of connected, autonomous, shared and electric vehicles. And we’re completely changing the way we view transportation.
By 2030, electric vehicles (EVs) will be mainstream—not just within the premium segment, as they are today. EV’s will be popular and available across all vehicle variants and prolific in the commercial vehicle industry and in public transportation. Owners and fleet providers will experience the lower costs of electricity, lower maintenance costs, and the lower overall total cost of ownership (TCO). Fully autonomous or self-driving vehicles will introduce design freedom never experienced before, with the removal of the steering wheel, foot pedals and conventional dashboard. Communication and comfort will be re-imagined, with a vehicle that’s no longer designed around the driver but designed to serve the needs and comfort of the occupants, who are now users instead of owners.
With the rise of mobility services such as Uber, Didi, and a host of others, vehicle ownership is fast becoming an option. In a very short time, especially in urban areas such as China’s mega-cities, it is becoming cost-efficient to subscribe to a monthly ride share service for all of your transportation needs.

Bill Russo, CEO, Automobility LTD
Bill Russo, CEO of China-based Automobility, in a December 2018 article, Competing in the Digital Internet of Mobility, notes that the digital connectivity of these vehicles will open up profit opportunities well beyond the vehicle hardware. He says “An expanded understanding of mobility use cases and tailoring of the mobility hardware ‘form factor’ to the particular mobility need will be a way to create a value proposition that is rooted in the unique riding experience. In the user-centric world where users are passengers, the focus shifts from traditional driver-centric design to a user-centric productivity space. Instead of traveling in the cockpit, we will move in business class or economy class, depending on our preferences and budget.” Cities will be re-imagined in new social opportunities associated with autonomy, as these vehicles will serve the under-served, and infrastructures will shift in purpose to move people, as opposed to moving vehicles.
Where does steel fit?
The steel industry plans to be right in the middle of this revolutionary change. Fleet owners who provide ride hailing and ride sharing services need to manage the total cost of ownership, while maximizing the user experience for added revenue. To be profitable, they’ll want durable, lasting structures that are affordable to own, provide the user motion as well as emotional comfort, while being efficient to operate, and environmentally friendly – and steel is the only material that meets all these requirements.
On Camera Now: George Coates, Technical Director, WorldAutoSteel and Phoenix Group from worldautosteel on Vimeo.
As always, steel is needed for the crash safety structures, and now add battery protection. Our market intelligence shows that due to the high cost to municipalities and regional governments, autonomous-only vehicles will be limited to dedicated areas for a long time to come. Meanwhile, vehicle-to-vehicle and vehicle-to-infrastructure connectivity will result in dramatic improvements in accident avoidance and reduced fatalities.
Because it will take many years before all vehicles on the road have these technologies in play, the need for passive safety will remain for the foreseeable future. Developing a structural design for the passenger compartment becomes challenging, since there’s a now a need to strike a balance between occupant safety and the occupant freedom. This is enabled by removing the driver and controls from the interior. Steel will be needed to provide the unique properties of both crash energy absorption and deflection, while also managing the loads associated with passengers in multiple and diverse seating configurations. Steel has the ability to provide needed strength while keeping the material thin, which lends more room in the passenger cabin for new seating arrangements and more seats. And battery housings made from steel will provide structural integrity for crash management, while also preventing battery pack damage and leakage.
Lightweighting will continue to be important in an effort to balance smaller battery sizes with maximum range. The steel industry has been and will continue to develop products, such as the ever-growing family of Advanced High-Strength Steels (AHSS), to meet both the mass reduction and the safety targets, affordably. With content innovation and the amazing flexibility of the Iron (Fe) element, researchers still have vast development possibilities for new steels that are stronger, more formable and cost effective.

Blog
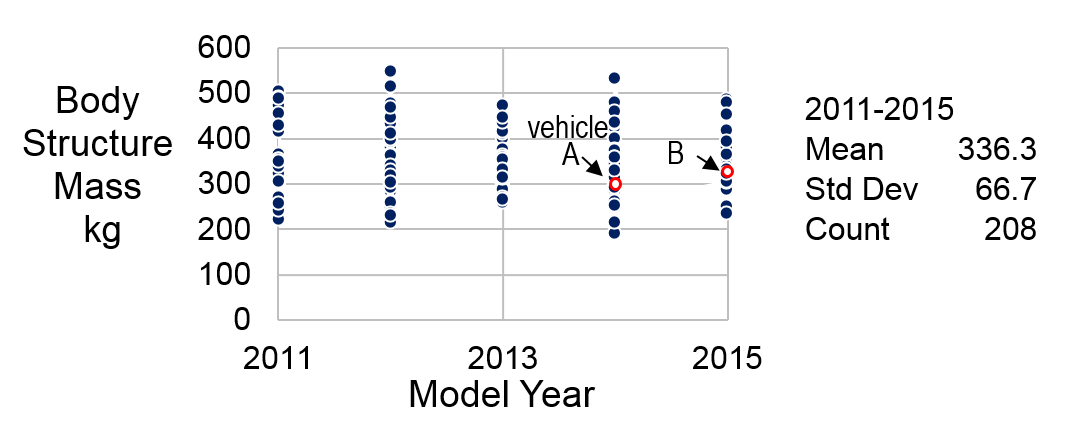
Product benchmarking is the process of measuring and analyzing the performance of competitive products. Data from a benchmarking analysis is used at the early stages of product development where performance targets are being set for a new vehicle. As an example of benchmarking, consider setting the mass target for the body structure of a new vehicle program. We want to set a target that is light weight, but also one that is possible to achieve. We benchmark two competitive body structures to help us set the target, Figure 1.
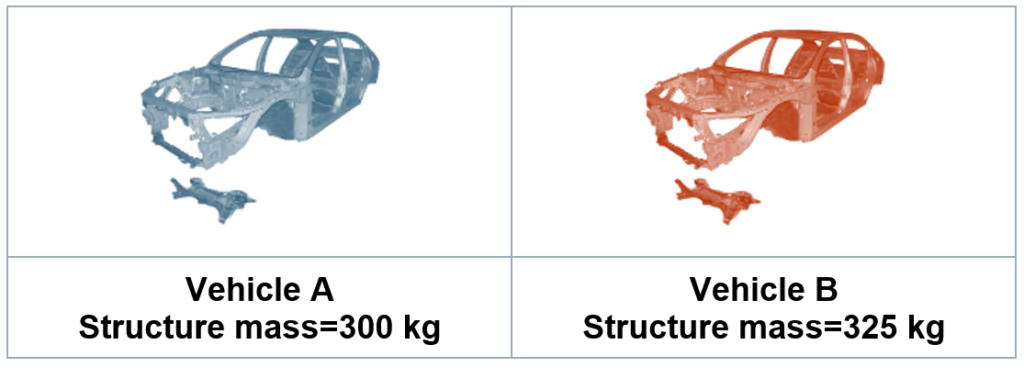
Figure 1: Mass data for two benchmarked vehicles.
From this limited data, it appears a sufficient target for the new program would be 300 kg, the lighter of the two. But there are questions to be resolved: Are these two structures representative of efficient light weighting? Also, if the vehicle under design is of a slightly different size than these two vehicles, how will this affect the applicability of benchmark comparison?
A means to begin to address these concerns is simply to look at more benchmark vehicles. The tear-down database at A2Mac1 Automotive Benchmarking contains mass data for several hundred vehicles. From this database, structure mass for 280 steel sedans is plotted in Figure 2. This expanded data allows us to see a more complete picture of the range of mass exhibited in the market place. Vehicle A and B considered before no longer stand out as exceptional. While this additional data provides an understanding of the average and range of body structure mass, there are concerns with interpreting this chart. Do the lighter structures represent efficient designs or are they just the structures of smaller vehicles?
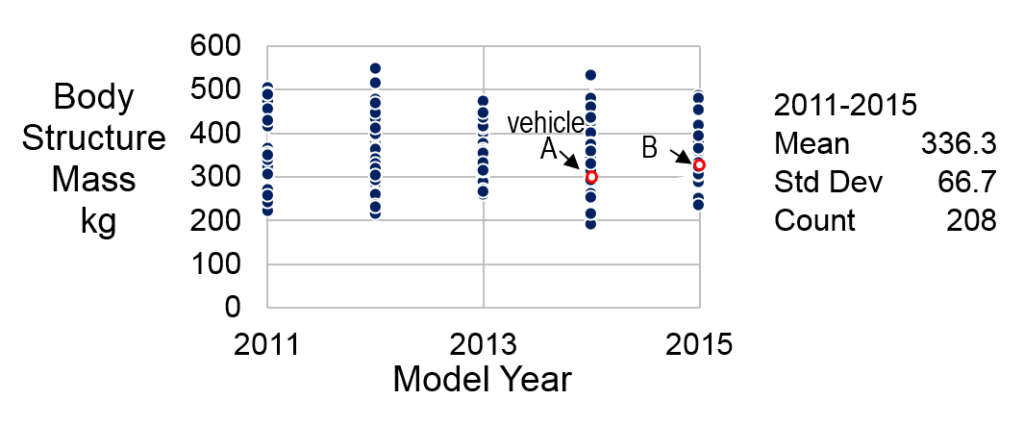
Figure 2: Body structure mass data for 280 benchmarked vehicles.
We can answer this question by investigating how structure mass varies with mass drivers. Two mass drivers for body structure are vehicle size as measured by plan view area, and structural loading taken to depend on the Gross Vehicle Mass. In Figure 3 we use the same vehicles shown in Figure 2, but now plot structure mass versus each mass driver.
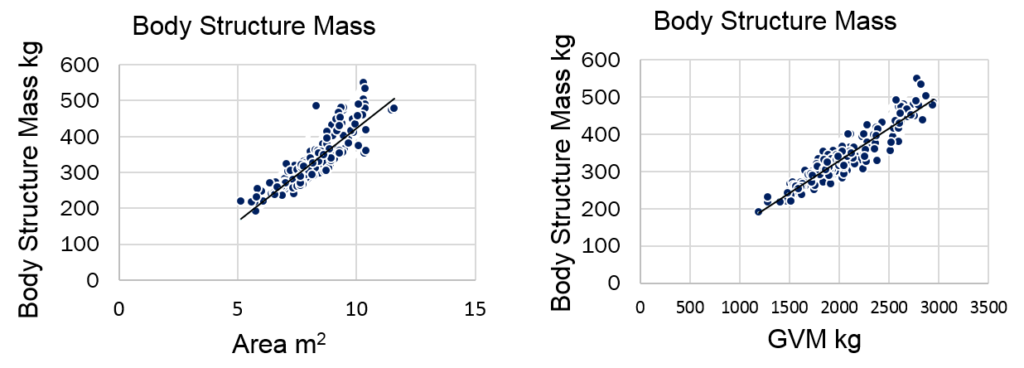
Figure 3: Structure mass vs. vehicle plan view area (left), and gross vehicle mass (right).
The correlation of structure mass for each of these mass drivers is very clearly demonstrated by the trend lines shown: Body structures are heavier for larger cars (left graph), and heavier when they must support greater vehicle mass (right graph). We can quantify these correlations with an equation determined by statistical regression, Equation 1. This equation represents the mass of an average or typical body structure, given its GVM and Area.
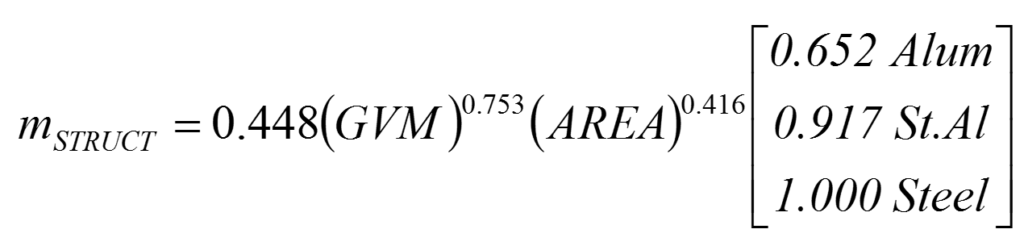
Equation 1
where
mSTRUCT=Mass of body structure (kg)
GVM =Gross vehicle mass (kg)
Area =Plan view area (Length x Width) (m2)
Now for each of the vehicles in our original data set we can calculate the expected structure mass using the vehicle’s GVM and Area. Figure 4 plots the actual measured structure mass vs. the mass expected for that vehicle using Equation 1. The diagonal line indicates those vehicles where the body mass is average or typical. For those structures above the line, body mass is heavier than expected given the area and GVM of the vehicle. And for those below the line, body mass is lighter than expected. This group below the line are the mass efficient body structures that are of interest for fuller analysis.
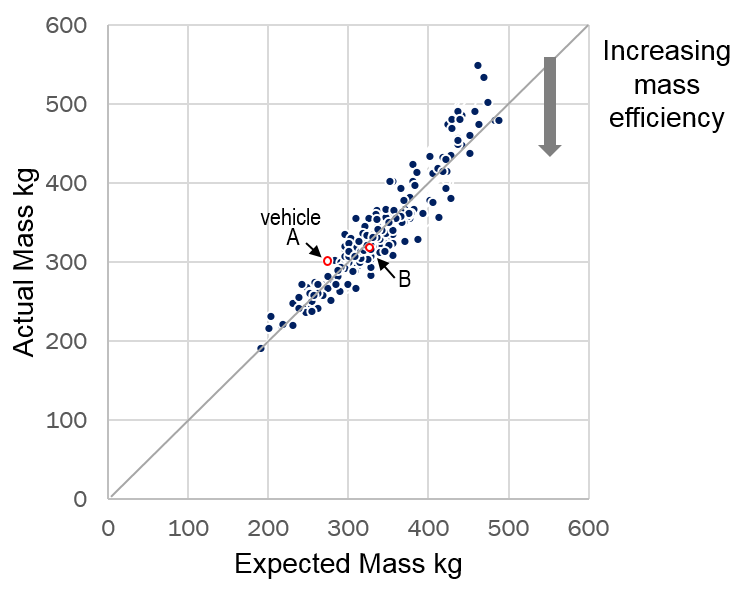
Figure 4: Actual measured structure mass compared to that expected using equation 1.
Note that looking only at structure mass, as in Figure 2, does not lead to understanding which structures are efficient. For example, Vehicle A in Figure 1 is the lighter of the two structures, 300 kg vs. 325 kg. However, after accounting for the two vehicle’s area and GVM, it can be seen from Figure 4 that Vehicle A is above the diagonal line, indicating a heavier than expected structure, while Vehicle B is on the line indicating it has a typical structure mass.
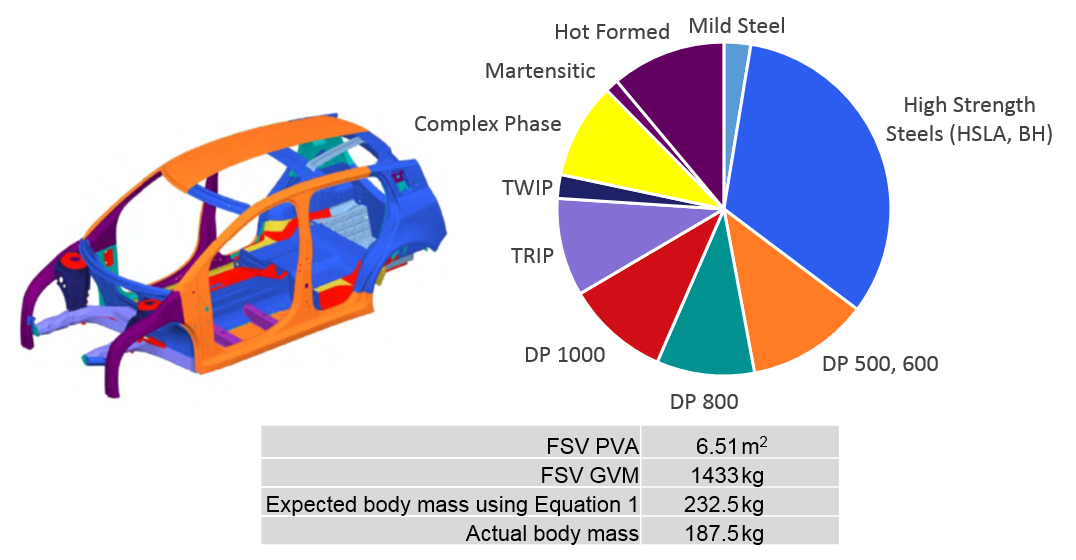
As a further example, consider the WorldAutoSteel FutureSteelVehicle (FSV). The FSV project, completed in 2011, investigated the weight reduction potential enabled with the use of Advanced High-Strength Steels (AHSS), advanced manufacturing processes, and the use of computer optimization. The resulting material use and body structure mass are shown in Figure 5.

Figure 5: FSV material application and resulting body structure mass.
We can now graph the actual FSV structure mass with expected mass, Figure 6. The data point is well below the diagonal line quantifying the exceptional mass reduction enabled through extensive AHSS use.

Figure 6: FSV body structure compared with 280 normalized benchmarked structures.
Finally, statistical benchmarking reveals which current products would benefit most from lightweighting. Looking again at the plot of actual vs. expected body structure mass for a fixed expected mass, in this case 300 kg, Figure 7. For this set of similarly sized vehicles, there is a wide range of variability in actual mass, indicated by the arrow. For the several vehicles above the diagonal, these body structures are heavier than expected and have significant potential for lightweighting.

Figure 7: Variability in structure mass for similar size vehicles.
For more information on the statistical benchmarking method, see the studies referenced in No. 2 and 3 below. Dr. Malen’s statistical benchmarking methodology also is documented in SAE Paper No. 2015-01-0574
References:
1. A2Mac1.com, Automotive benchmarking.
2. Malen, D., Nagaraj, B., Automotive Mass Benchmarking 2017 study
3. Hughes, J. & Malen, D., Statistical Benchmarking of Automotive Closures, Great Designs in Steel, 2015,
4. FutureSteelVehicle Overview Report, April 2011,

Dr. Donald E. Malen University of Michigan
Dr. Donald E. Malen is an adjunct faculty member at the University of Michigan where he teaches graduate level courses in Automobile Body Structure and Product Design. Prior to this, he was an engineer with General Motors Corporation for 35 years. His background at GM was in automotive body structure design and analysis, and systems engineering. While at GM, he worked on many new vehicle programs and has brought this experience to his teaching and writing. Dr. Malen consults and conducts international seminars on Body Engineering, Innovation, Lead Time Reduction, and Decision Making During Preliminary Design. He holds several patents related to automobile body structure and vibration. His education includes a Ph.D. in Mechanical and Industrial Engineering from the University of Michigan, an MS from Massachusetts Institute of Technology, and a BSME from General Motors Institute (Kettering University).
Blog

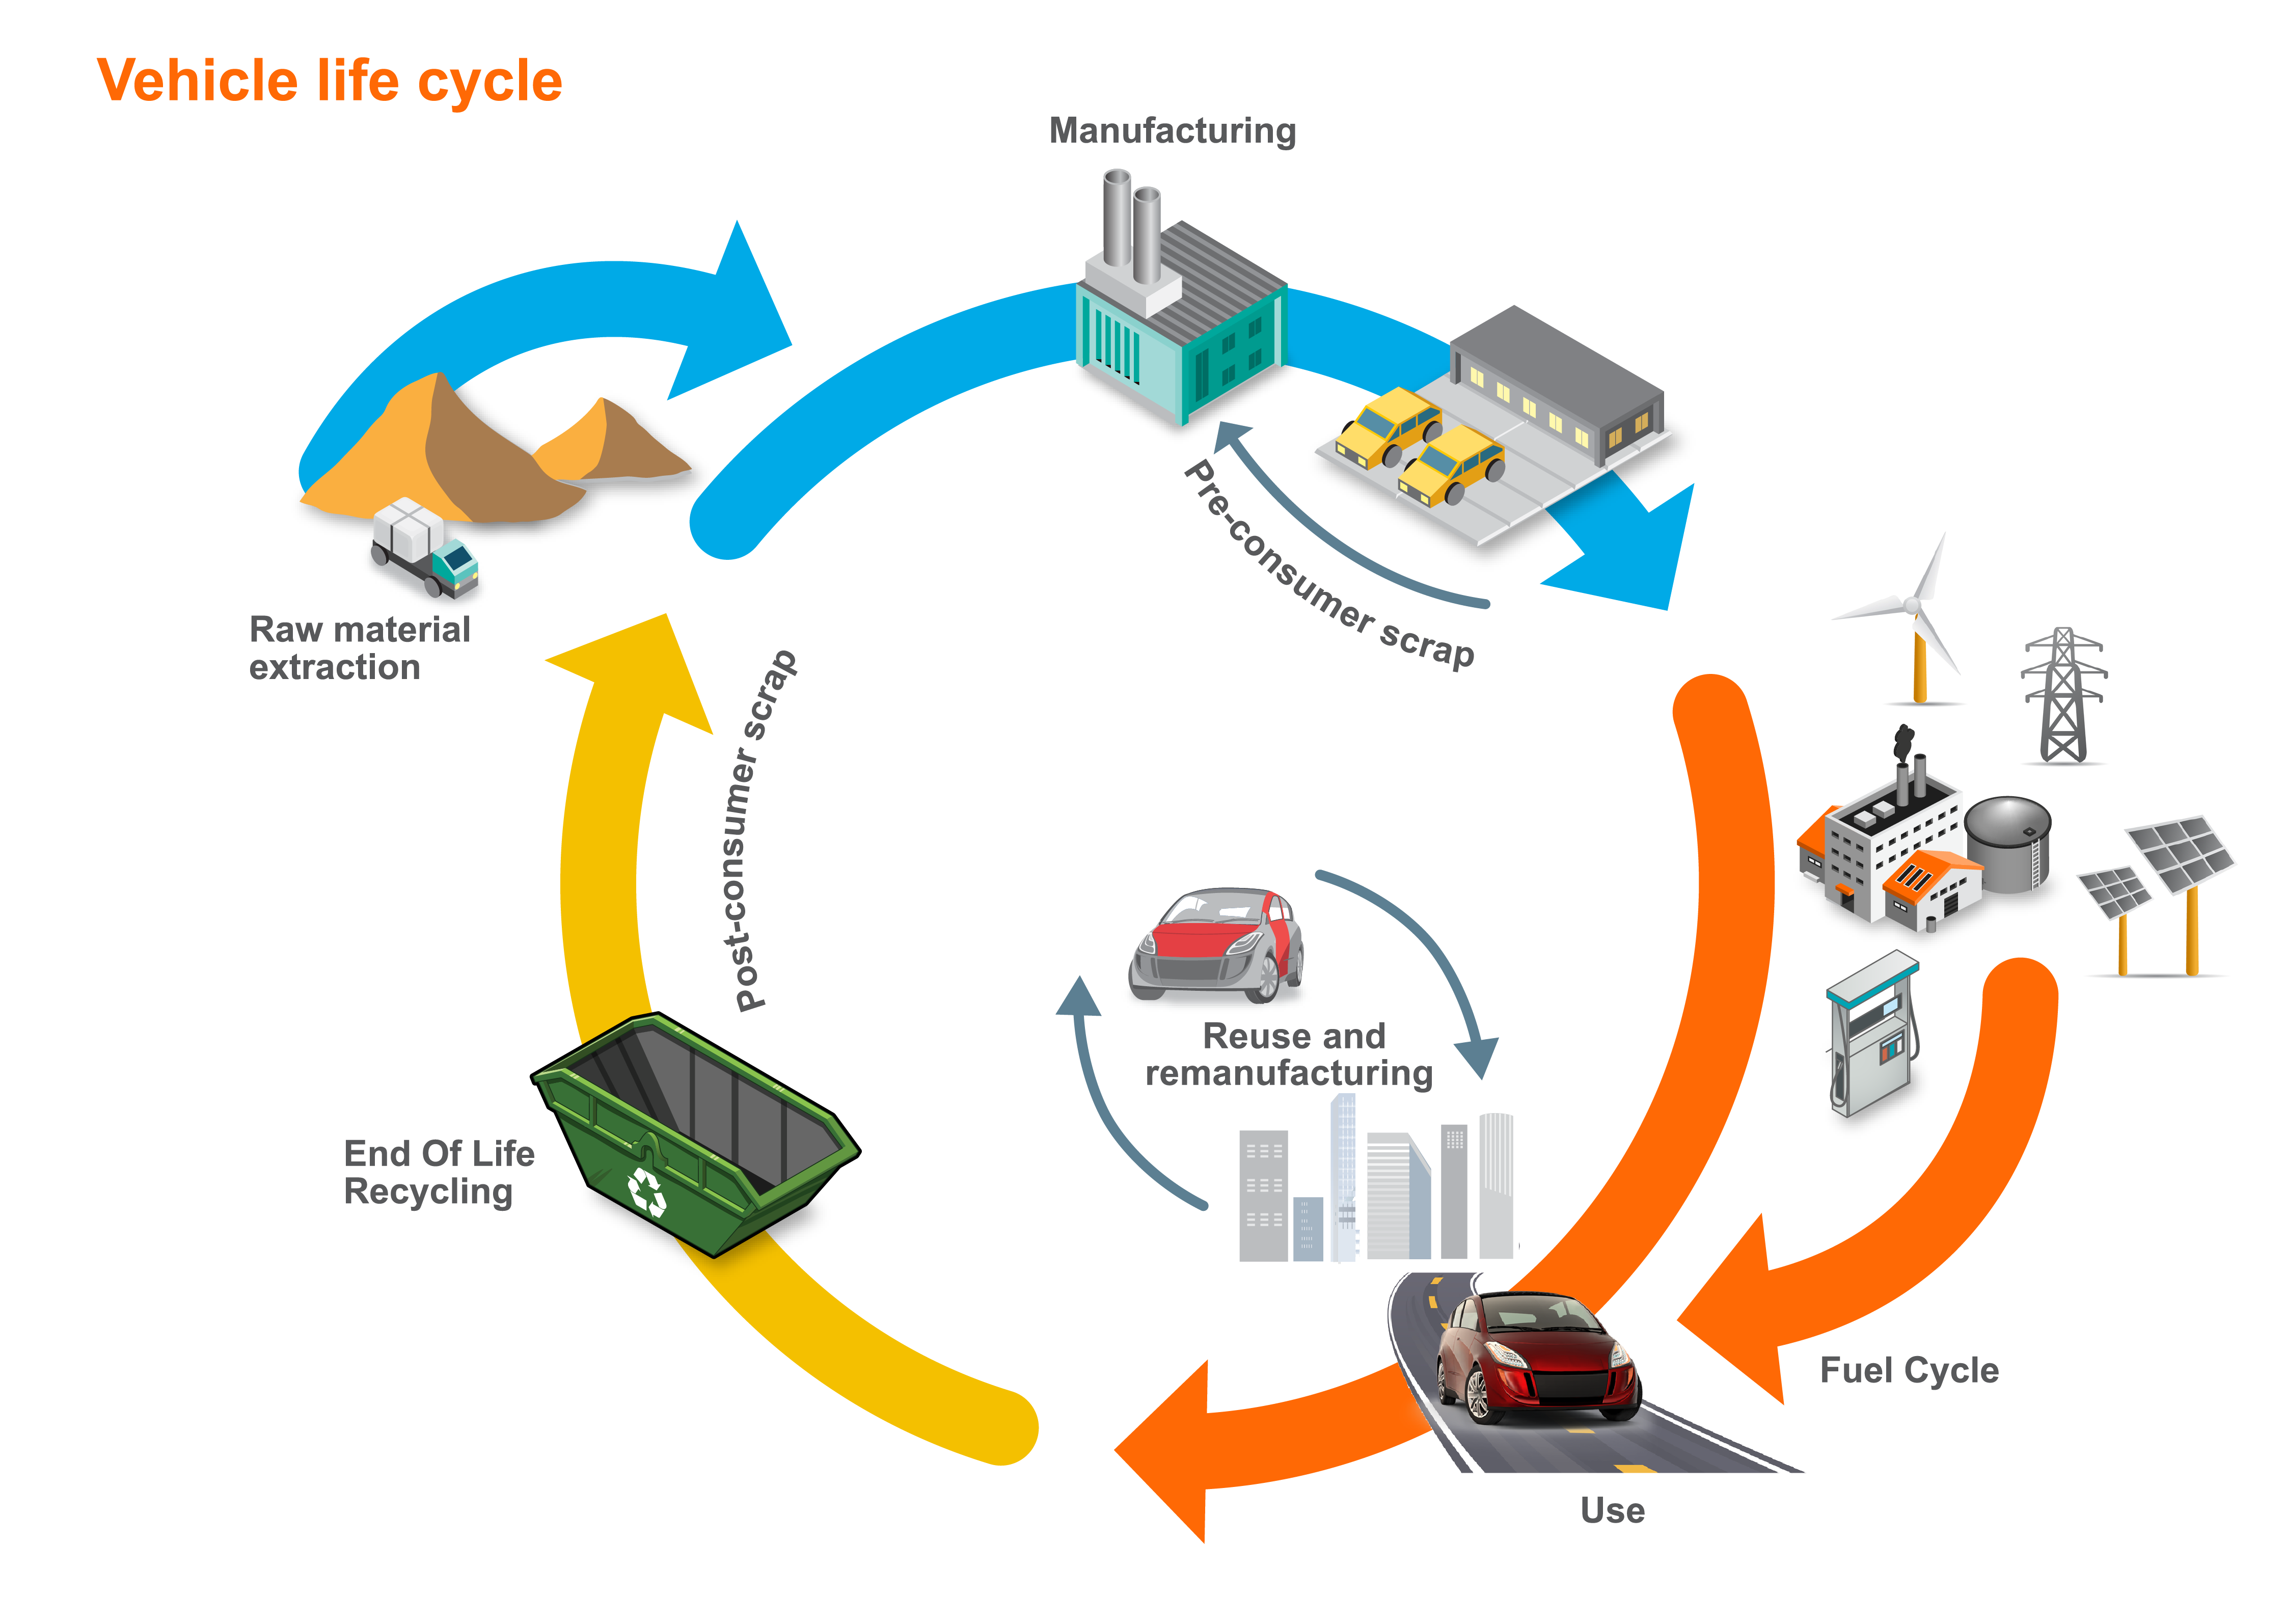
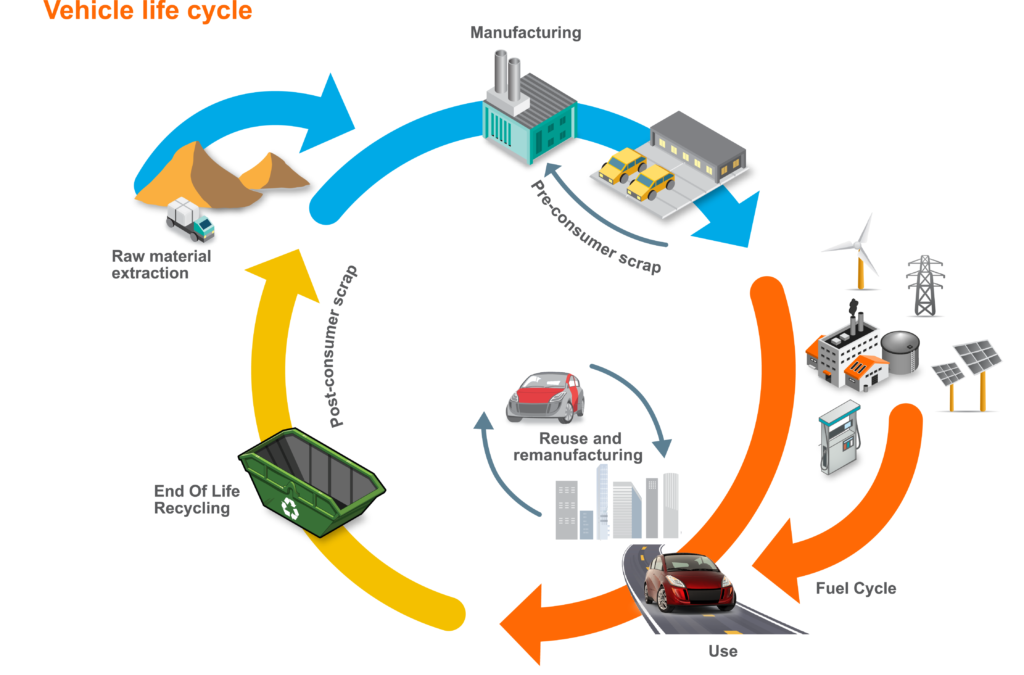
Vehicle LCA encompasses all phases of the product cycle, from raw material extraction to end of life recycling and disposal.
Life Cycle Assessment (LCA) continues to gain traction as the preferred method for assessing the environmental impacts of a product, and we are seeing more and more automotive LCA studies, and claims or conclusions based on LCA, being published. Here are five things to look for in an automotive LCA study. This is not an exhaustive list – there are many more things that need to be considered when conducting an LCA (the international standard that lays out requirements and guidelines for LCA, ISO 14044, lists 14). For a detailed look at LCA, I recommend Environmental Life Cycle Assessment, an excellent textbook published by the American Center for Life Cycle Assessment (ACLCA).
1. Is the study comparing “apples to apples”?
This can sometimes be a bit of a challenge in an automotive LCA, as cars are complex products made up of many systems and sub-systems, with supply chains that reach around the world. It is easy to lose sight of apparently subtle differences.
One such difference arises in material comparisons of an existing product and one at the design stage. Before making choices about which material has the lower impact, it is important to decide if this is a fair comparison. Have both designs been fully optimized? Does the theoretical design meet all the requirements (e.g. crash, NVH) of an existing design that has gone through all the additional steps necessary to get to production?
Functional equivalence is another important factor to consider. For example, it would be inappropriate to compare the “body” of a vehicle with a body-on-frame design with the “body” of a vehicle with a unibody design. Though both systems are casually referred to as the “body”, their functional requirements are very different. Similarly, when comparing an assembly of stamped parts to a single casting, it is important to include all the stamped parts that are required to meet the same functional performance as the cast part.
2. Has the best and most appropriate data been used?
As with any assessment tool, data is key, and there are many factors that can help determine which is the most appropriate to be used in a particular study. There are ten of these factors listed in ISO 14044, but I will only talk about three of them here. If you want more detail, Guidance on Data Quality Assessment for Life Cycle Inventory Data, published by USEPA’s National Risk Management Research Laboratory is a great resource.
Temporal scope – the temporal scope of the data describes when the data was collected, as well as the time period to which the data applies. An often-used rule of thumb is that the data used for the study should be no more than five years old. The goal is to use either data that reflects the time period when the product under study was actually produced or the most recent data that captures the current state of the art (these may of course be the same thing).
Geographical scope – the geographical scope of the data describes the location to which the data applies. This is critical, as the same process may have a very different impact profile in different locations. For example, primary aluminium made largely using electricity from hydropower in Canada will have a much different impact from primary aluminium made in China, where the electricity used comes almost entirely from coal. With automakers increasingly developing global platforms (i.e. using the same parts all over the world, as often as possible), it is important to consider how the results of an LCA might change if a product is produced in a region other than the one studied. The same is true when considering where a product is used. For example, the differences in electricity generation in Canada and China will greatly affect the impact of charging an electric vehicle.
Technological scope – the technological scope of the data describes the technology to which the data applies. Often the same product can be made from a variety of production pathways. Much like production in different regions, production via different pathways can result in much different impacts. An example of this is primary magnesium production. Magnesium produced via the Pidgeon process (a declining, but still-used method) can have a global warming impact more than 1.5 times higher than magnesium produced via the electrolytic method.
3. How sensitive are the results to changes in the choices made?
Because LCA involves choices about things like data and functional requirements (as well as a host of other parameter choices), it is important to understand what happens to the results if different choices are made or underlying conditions change. Inclusion of a sensitivity analysis of this kind allows us to evaluate the results of an LCA and look for areas that might require further study, perhaps by looking for more precise data. It could also affect decisions we might make based on the results. If the results of a study are very sensitive to the location in which the materials are made, we want to evaluate this if we are considering making the product in many different places.
4. What is the fundamental approach taken?
ISO 14040, which lays out the principles and framework for LCA, describes two fundamental approaches to LCA:
- one which assigns elementary flows and potential environmental impacts to a specific product system typically as an account of the history of the product, and
- one which studies the environmental consequences of possible (future) changes between alternative product systems.
It is important to consider which approach was used, and what the chosen approach means in terms of interpreting the results. In a very basic sense, the key lies in the words “history” and “future”. A study that considers the historical impact of a product (i.e. the impact of any product that has already been made) tells us about the impact of that particular product, but may be of limited use in making decisions about what the impact of that same product may be in the future. Studies of the potential future impact of a product, while necessary for decision making, are fraught with all the perils of predicting the future. Both approaches are valuable, and it is important to understand which approach was taken in order to make decisions about how to use the results of the study. The ILCD Handbook: General guide for Life Cycle Assessment, published by the Joint Research Center of the European Commission, provides guidance on when to use each approach in assessing the technological representativeness of LCI data.
5. How broadly can I apply the results?
It is often tempting to apply the results of a study more broadly than is justified. Given all the factors listed above (as well as the many others not included), it is critical that careful consideration be given when making decisions based on the results of automotive LCA studies in order to make sure that the scope of the study is in alignment with the scope of the decision. It is clearly inappropriate to make global decisions based on local studies, or to make future decisions based solely on past conditions. LCA is a valuable, well-developed tool for assessing environmental impacts, but we must be careful to use it appropriately.
The UCSB Automotive Energy and GHG Model, developed on behalf of WorldAutoSteel, is a publicly available, peer-reviewed tool for the assessment of automotive emissions on a life cycle basis. Version 5 of the UCSB Model can be downloaded for free at www.worldautosteel.org. At the UCSB Model page, you’ll find a video workshop at the end featuring Russ Balzer explaining the contents of the Model. A user guide is also available for download.
Does the subject of Life Cycle Assessment confuse you or would you like to learn more? There is a great free online course at our sister organization steeluniversity, “Introduction to LCA”, taught by Dr. Matthias Finkbeiner, head of the department of Sustainability Engineering at Technical University of Berlin, who introduces LCA methodology to analyse the environmental burdens of product and service systems. The course is fun and interactive, and you can finish it at your own pace.

Russ Balzer, LCACP, Technical Director, WorldAutoSteel and Phoenix Group
Russ Balzer is the LCA Technical Director at WorldAutoSteel and Phoenix Group. As Technical Director, Russ manages a variety of engineering projects, and has tactical and strategic responsibilities in WorldAutoSteel’s efforts to use and promote Life Cycle Assessment (LCA). Russ recently achieved LCACP certification and was recognized for his work in the field of LCA with the ACLCA’s Rising Star Award.