Citations
P-8. Andrea Peer, Ying Lu, Tim Abke, Menachem Kimchi, and Wei Zhang “Deformation Behaviors of Subcritical Heat-affected Zone of Ultra-high Strength Steel Resistance Spot Welds.” in 9th International Seminar & Conference on Advances in Resistance Spot Welding. Miami, (3 2016). Paper No. 12.
Resistance Spot Welding, Resistance Welding Processes
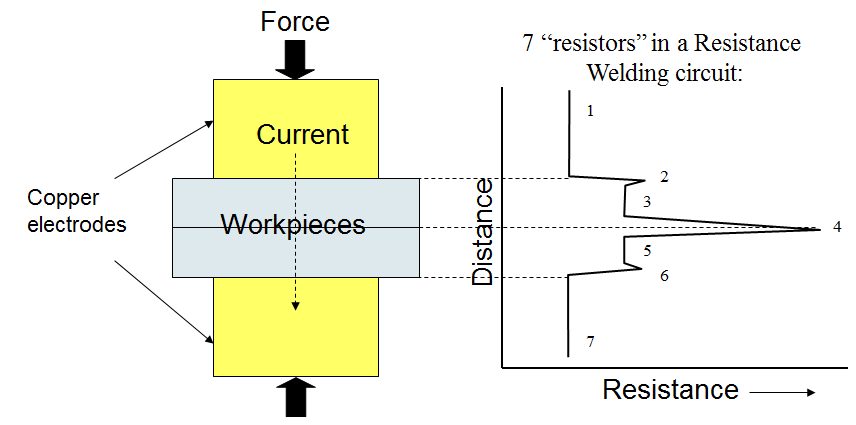
The Resistance Spot Welding (RSW) process is often used as a model to explain the fundamental concepts behind most resistance welding processes. Figure 1 shows a standard Resistance Spot Welding arrangement in which two copper electrodes apply force and pass current through the sheets being welded. If the sheets are steel, the resistance to the flow of current of the sheets will be much higher than the copper electrodes, so the steel will get hot while the electrodes remain relatively cool. But another important characteristic exists that is critical to most resistance welding processes – the contact resistance between the parts (or sheets) being welded. As indicated on the figure, the highest resistance to the flow of current is where the sheets meet (“Resistance” 4). This fact allows a weld nugget to begin forming and grow exactly where it is needed – between the sheets.
The figure depicts the flow of current from one electrode to the other as an electrical circuit that contains seven “resistors”. Resistors 1 and 7 represent the bulk resistance of the copper electrodes, Resistors 2 and 6 represent the contact resistance between the electrodes and the sheets, Resistors 3 and 5 represent the bulk resistance of the sheets, and Resistor 4, as mentioned, represents the contact resistance between the sheets. Another fact that works strongly in the favor of resistance welding of steel is that as the steel is heated, its resistivity relative to copper increases even more. So, the initial contact resistance effectively heats the surrounding area which is in turn heated more rapidly because its resistance is higher since it is hotter. As a result, heating and weld nugget formation can occur quite rapidly. A typical weld time for RSW of steel is approximately 1/5 of a second. The current required in resistance welding is much higher than arc welding, and it is in the range of 8-15 kA.
Figure 1: Resistances associated with steel Resistance Spot Welding.
Most welding processes produce welds that provide strong visible evidence of weld quality, so visual examination is often an important approach to verifying the quality of the weld. However, with most resistance welding processes visible examination is not possible due to the “blind” weld location between the sheets or parts being welded. As a result, maintaining weld quality with processes such as Resistance Spot Welding is highly dependent on what is known as a lobe curve (Figure 2), which is basically a process window for Resistance Spot Welding. The lobe curve represents ranges of weld current and time that will produce a spot weld nugget size that has acceptable mechanical properties for the intended application. So, weld quality monitoring with resistance welding processes relies highly on the ability to monitor parameters such as current and time. During production, if a weld is made with parameters that fall outside of the lobe curve, the weld is considered unacceptable. Ultrasonic testing is also often used in the automotive industry for Nondestructive Testing (NDT) of the blind location of Resistance Spot Welding.
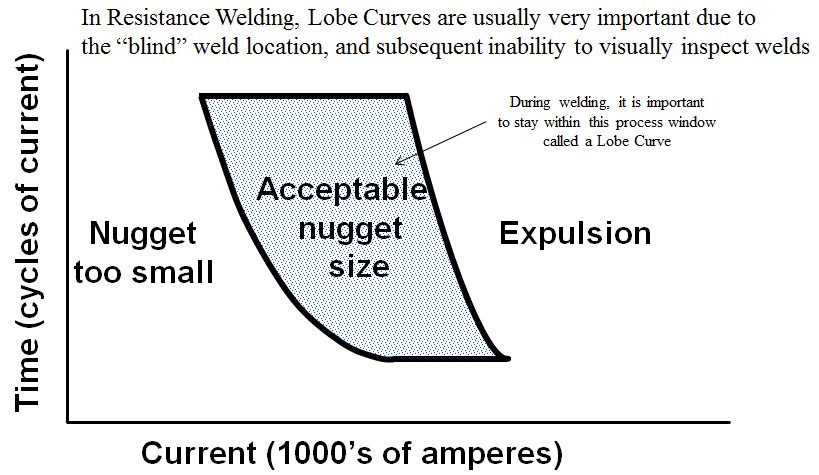
Figure 2: Resistance welding lobe curve.
RSW Electrode Geometry
Electrode geometry is a very important consideration with RSW. Figure 3 shows three common shapes, but there are many more options available including unique custom designs for specific applications. The basic electrode geometry is usually selected to improve the electrical-thermal-mechanical performance of an electrode. This is generally a geometry in which the cross-sectional area increases rapidly with distance from the workpiece, thereby providing a good heat sink. The choice of shape may also include considerations such as accessibility to the part and how much surface marking of the part is acceptable. The diameter of the electrode contact area is also a consideration. Too small an area will produce undersized welds with insufficient strength, while too large an area will lead to unstable and inconsistent weld growth characteristics.
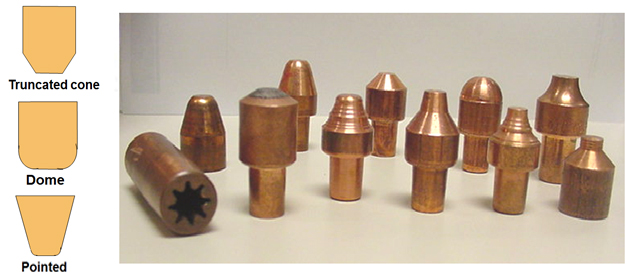
Figure 3: Typical RSW electrode geometries (left), example geometries used by automotive manufacturers (right).
Electrodes must be able to conduct current to the part, mechanically constrain the part, and conduct heat from the part. They must be able to sustain high loads at elevated temperatures, while maintaining adequate thermal and electrical conductivity. The choice of electrode alloy for a given application is often dictated by the need to minimize electrode wear. When electrodes wear, they typically begin to “mushroom”, or grow larger in diameter. Electrode wear is accelerated when there is an alloying reaction between the electrode and the part, a common problem when welding Aluminum (Al) and coated steels. As the electrode diameter increases, the current density decreases, resulting in a decrease in the size of the weld. Since the strength of a spot-welded joint is directly related to the size of the weld nugget, electrode wear can be a big problem.
A range of Copper (Cu)-based or refractory-based electrode materials are used depending on the application. The Resistance Welding Manufacturers Association (RWMA) sorts electrode materials into three groups: A, B, and C. Group A contains the most common Cu-based alloys (see Table 1), Group B contains refractory metals and refractory metal composites, and Group C contains specialty materials such as dispersion-strengthened copper. Within the groups, they are further categorized by a class number. The general rule of thumb is as the class number goes up, the electrode strength goes up but the electrical conductivity goes down. When electrical conductivity goes down, the electrode heats more easily, resulting in premature electrode wear. The choice of electrode material involves many factors, but generally higher strength electrodes will be selected when higher strength materials are being welded. It is also important that the electrical and thermal conductivities of the electrode are much higher than those of the material being welded.
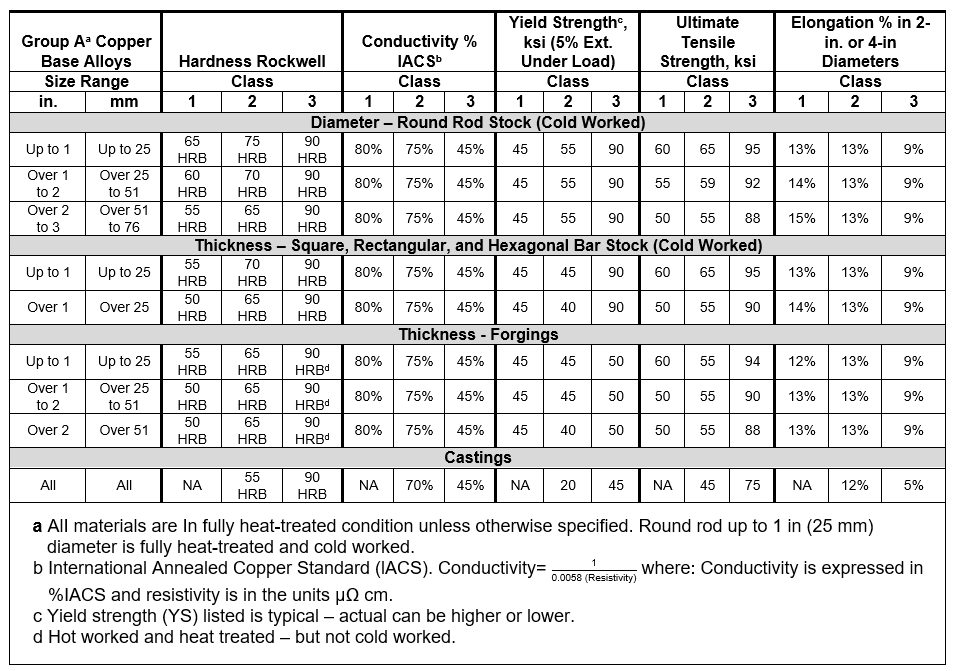
Table 1: Minimum mechanical and physical properties of Cu-based alloys for RWMA electrodes.A-18
The two most commonly used electrodes are the Class 1 and 2 electrodes of Group A. Class 1 electrodes [99% copper, 1% cadmium; 60 ksi UTS (forged); conductivity 92% International Annealed Copper Standard (IACS)] offer the highest electrical and thermal conductivity, and are typically used for spot welding Al alloys, magnesium alloys, brass, and bronze. Class 2 [99.2% copper, 0.8% chromium; 62 ksi UTS (forged), 82% IACS] electrodes are general-purpose electrodes for production spot and seam welding of most materials. IACS refers to a copper standard to which the electrodes are compared. Pure Cu has an IACS number of 100%.A-11, P-6, O-1
Joining, Resistance Welding Processes
Fundamentals and Principles of Resistance Welding
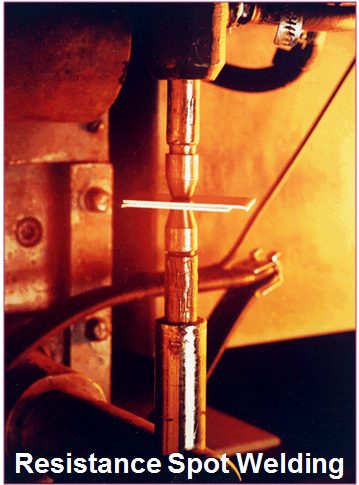
Figure 1: Resistance Spot Welding
Resistance welding processes represent a family of industrial welding processes that produce the heat required for welding through what is known as joule (J = I Rt) heating. Much in the way a piece of wire will heat up when current is passed through it, a resistance weld is based on the heating that occurs due to the resistance of current passing through the parts being welded. Since steel is not a very good conductor of electricity, it is easily heated by the flow of current and is an ideal metal for resistance welding processes. There are many resistance welding processes, but the most common is Resistance Spot Welding (RSW) (Figure 1). All resistance welding processes use three primary process variables – current, time, and pressure (or force). The automotive industry makes extensive use of resistance welding, but it is also used in a variety of other industry sectors including aerospace, medical, light manufacturing, tubing, appliances, and electrical.
Types of Resistance Welding
In addition to RSW, three other common resistance welding processes are Resistance Seam (RSEW), Projection (RPW), and Flash Welding (RFW) (Figure 2). The RSEW process uses two rolling electrodes to produce a continuous-welded seam between two sheets. It is often the process of choice for welding leak tight seams needed for automotive fuel tanks. RPW relies on geometrical features machined or formed on the part known as projections to create the required weld current density. RFW is very different from the other processes in that it relies on a rapid succession of high-current-density short current pulses which create what is known as flashing. During flashing, molten metal is violently expelled as the parts are moved together. The flashing action heats the surrounding material which allows a weld to be created when the parts are later brought together with significant pressure. Other important resistance welding processes which are not shown include High-Frequency Resistance Welding (HFRW) (used for producing the seams in welded pipe), and Resistance Upset Welding (RUW).
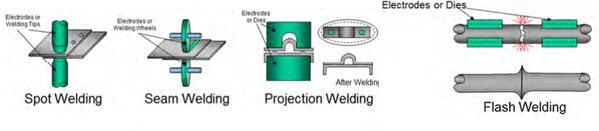
Figure 2: Common resistance welding processes.
In summary, most resistance welding processes offer the following advantages and limitations:
- Advantages:
- Can weld most metals, but works best with steel
- Extremely fast welding speeds are possible (a typical spot weld is produced in 1/5 of a second)
- Very good for automation and production because of the “self-clamping” aspect of the electrodes
- No filler materials required
- RSW and RSEW are ideal for welding of thin sheets
- Limitations:
- Equipment is much more expensive than arc welding equipment
- Welds cannot be visually inspected (except for RFW and RUW welds)
- The requirement for extremely high currents creates high power line demands
- Equipment is not portable
- Mechanical properties such as tensile and fatigue of welds made from processes such as spot welding can be poor due to the sharp geometrical features at the edge of the weld
- Electrode wear
Joining Dissimilar Materials, Resistance Welding Steel to Aluminium
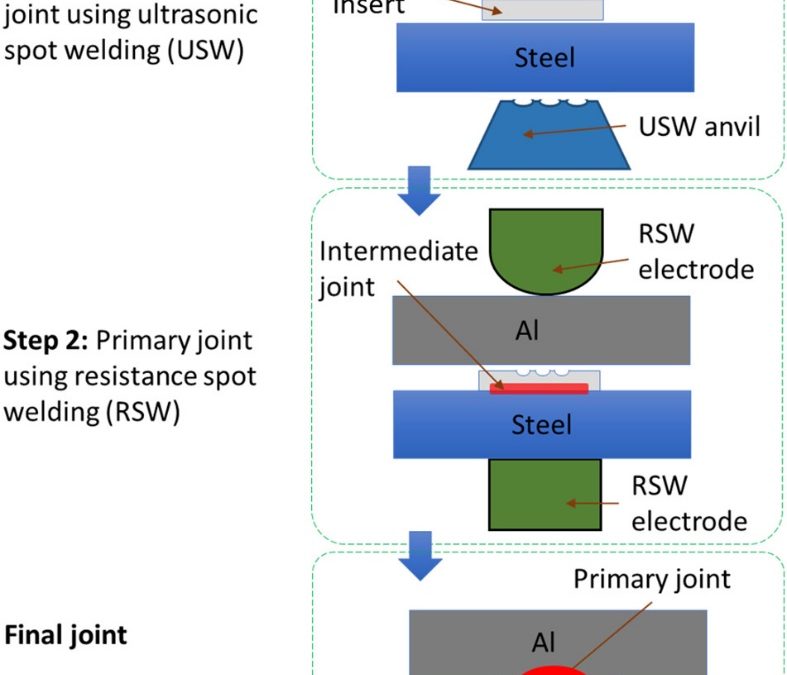
Recently research at the Ohio State University is developing methods that combine the benefits of ultrasonic welding and resistance spot welding. Y. Lu and co-workersL-10 developed the ultrasonic plus resistance spot welding process (U+RSW). In this process thin aluminium sheet was joined with steel sheet via ultrasonic welding, followed by RSW between the aluminium side of previously sheet and aluminium sheet as shown in Figure 1. In this study they used 1-mm-thick AA6061-T6 to 0.9-mm-thick AISI 1008 steel with 0.4-mm-thick AA6061-T6 as the insert.
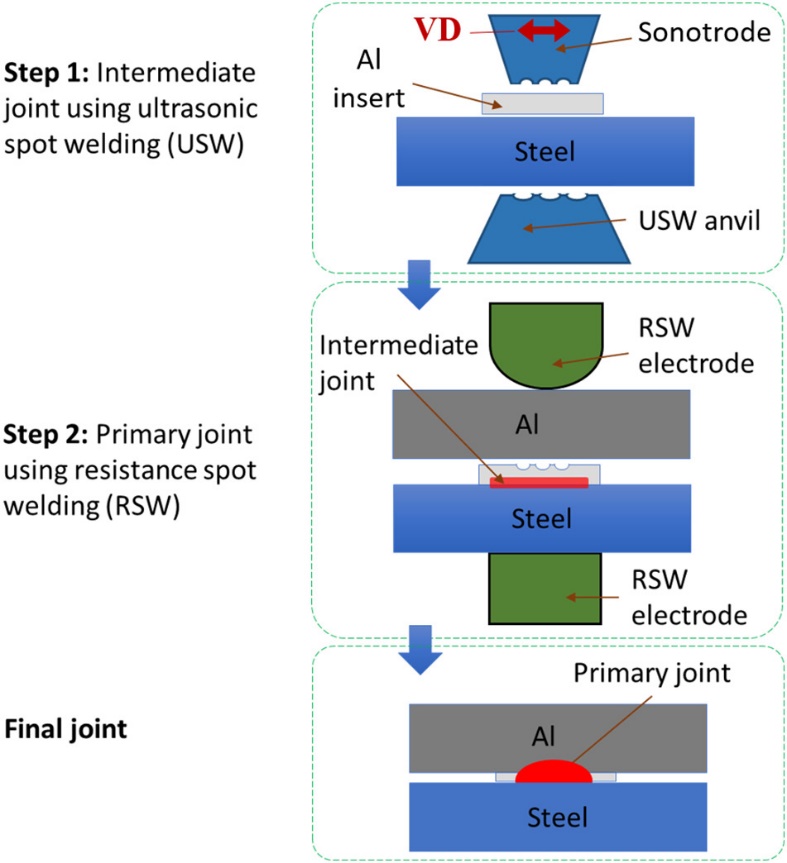
Figure 1: Schematic diagram of U + RSW process. VD is the sonotrode’s vibration direction for USW of intermediate joint.L-10
The U+RSW method showed improved mechanical properties (Figure 2), tensile shear strength and energy absorbed prior to failure. It has shown a relatively thin intermetallic layer.
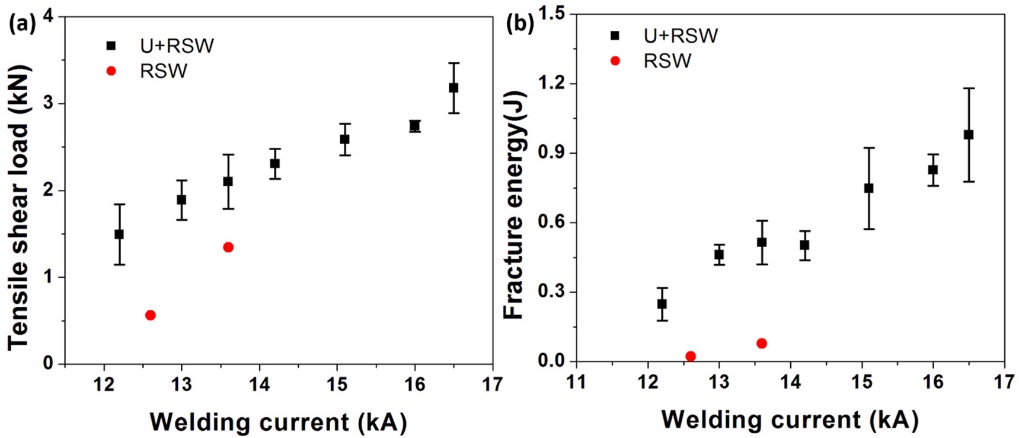
Figure 2: Effect of welding current on tensile shear strength and fracture energy of welded dissimilar joints of AA6061 to AISI 1008 steel. The welding time and the electrode force for RSW were kept constant at 0.083 s and 3.56 kN, respectively.L-10
Another research group have developed ultrasonic resistance welding process (URW), that apply in situ ultrasonic waves during the resistance spot welding process.S-17 The schematics of the process is shown in the Figure 3. Al-6061T6 and electrogalvanized TRIP 780 with dimensions of 70Lx 25Wx 1.6T mm3 and 70Lx 25Wx 1.3T mm3 respectively were used in this study.
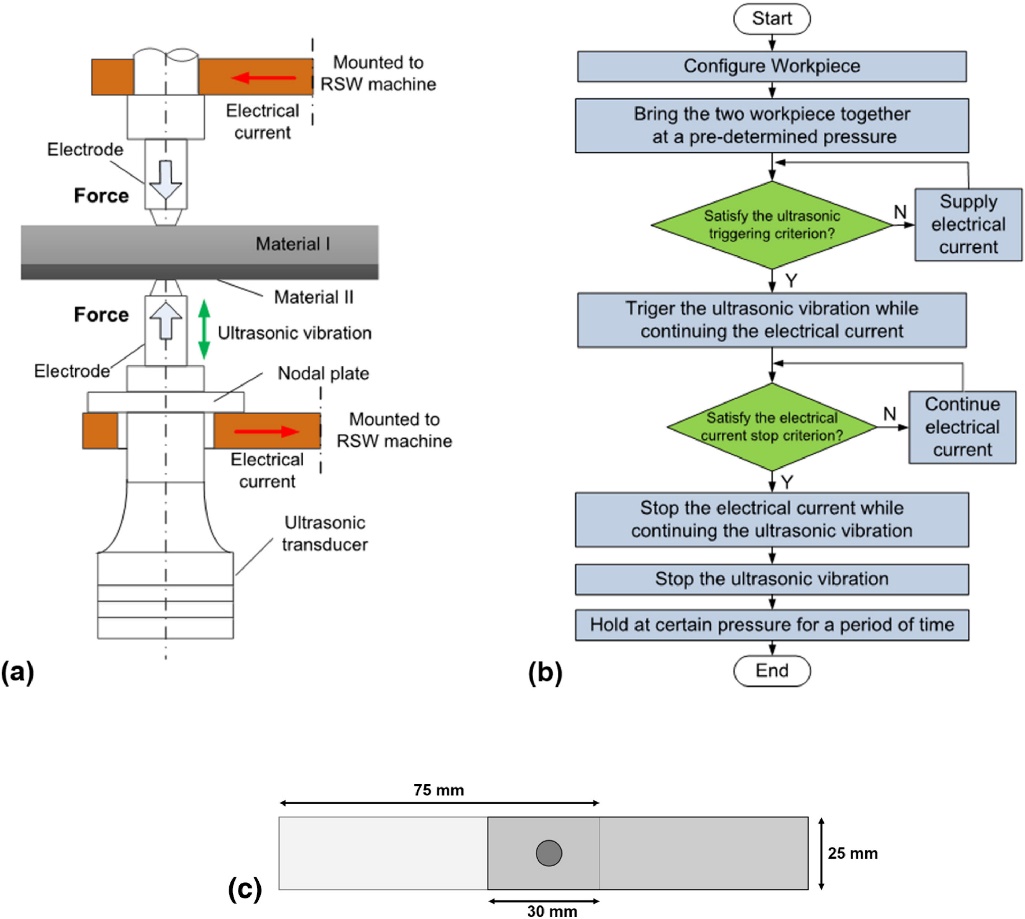
Figure 3: URW Setup (a) Schematic illustration; (b) Flowchart of the URW process.S-17
The URW process have shown improved mechanical properties and defect free interface compared to the RSW process. In situ ultrasonic vibration facilitated the breakdown of the surface oxide and contaminants, which modifies contact resistance and heat generation rate accordingly. If melting occurs, ultrasonic vibration promoted wetting of the molten aluminium over the steel interface and resulted in the formation of defect-free, fully bonded interface as shown in Figure 4. Figure 5 compares the mechanical properties between the RSW & URW process. Comparing URW with traditional RSW, up to 300% increase in strength and more than 150% increase in displacement to failure is reported. SEM images of the fractured surface revealed that ultrasonic waves eliminated the eggcrate morphology generally observed in the RSW welds fractured surface, which is a typical representative of solidification cracking.
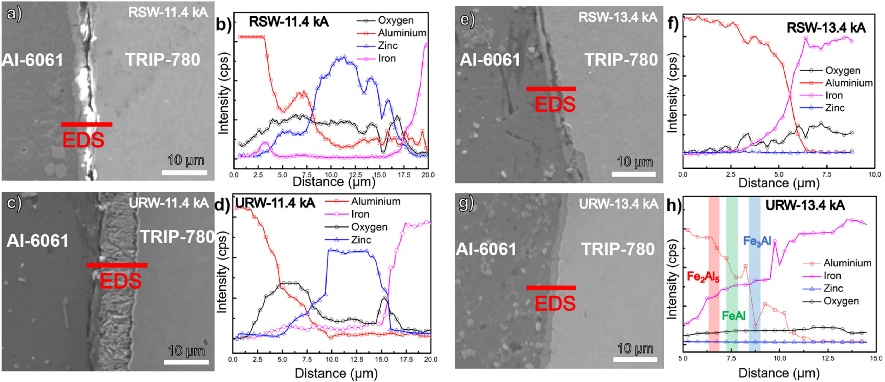
Figure 4: EDS line Scan of Al-6061 & TRIP 780 across interface for RSW at 11.4 kA (a-b) & at 13.4 kA (e-f) and for URW at 11.4 kA (c-d) & at 13.4 kA (g-h).S-17
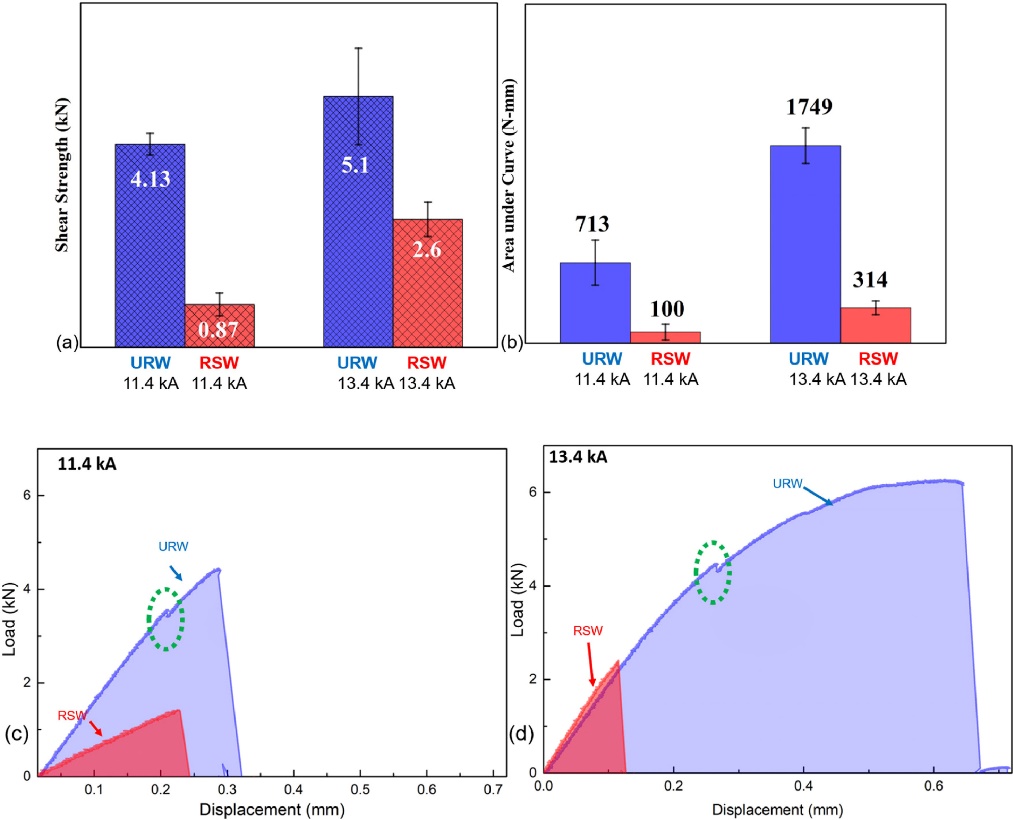
Figure 5: Tensile test results (a) Joint shear strength from 11.4 kA (30 cycles) & 13.4 kA (20 cycles); (b) Energy absorption calculated via area under load-displacement curve for 11.4 kA (30 cycles) & 13.4 kA (20 cycles); (c-d) load-displacement curve for 11.4.S-17
Joining Dissimilar Materials, Resistance Welding Steel to Aluminium
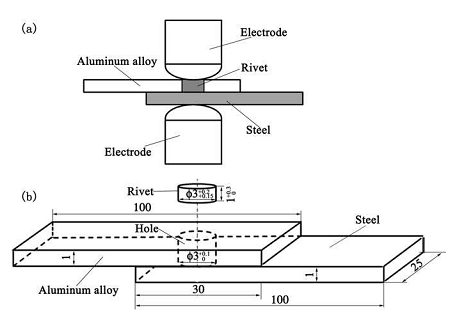
In order to improve the microstructure and mechanical properties of Aluminium/Steel resistance spot weld joints, Qiu et al.Q-6 tried a new welding method called resistance element welding (REM), i.e, resistance spot welding with a rivet. In this joining method, a hole was drilled in the overlap area of aluminium alloy sheet and a steel rivet was inserted into the hole. Then resistance spot welding was conducted on the rivet. The schematic of the setup was shown in Figure 1. A 4 µm-thick FeAl IMC layer formed at the rivet/Al interface, while FeAl3 formed at the Aluminium/Steel interface. Maximum tensile shear strength of 3.85 kN and pull-out failure mode can be obtained with a welding current of 21 kA, which was much higher than without a rivet (2.8 kN). Crack propagated along the Aluminium/Steel interface until it was arrested by the rivet. Then the crack propagated along the Al/rivet interface until failure.
Figure 1: (a) Schematic diagram of resistance spot welding with a rivet; (b) configuration and dimension of the sample (in mm).L-9
Recently, Ling et al.L-9 tried resistance element welding of 2-mm-thick 6061-T6 aluminium alloy with a 1.4-mm-thick galvanized DP780 Dual Phase steel with a 5-mm diameter Q235 steel rivet. With optimum welding conditions, the tensile shear strength of resistance element welded Aluminium/Steel can be 7.368 KN with a fracture energy of 18.9 kN, which were 70% and over 6 times higher than those of RSW joints (Figure 2). The fatigue limit of REM joints was 1.8 kN, which was twice those of RSW joints.
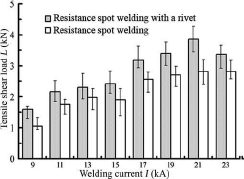
Figure 2: Effect of welding current on the tensile shear load of joints.L-9
