S-1
Citation:
S-1. M. Shi et al, “Formability Performance Comparison between Dual Phase and HSLA Steels,” Proceedings of 43rd Mechanical Working and Steel Processing, Iron & Steel Society, 39, p.165, 2001.

S-1. M. Shi et al, “Formability Performance Comparison between Dual Phase and HSLA Steels,” Proceedings of 43rd Mechanical Working and Steel Processing, Iron & Steel Society, 39, p.165, 2001.
One of the methods by which the coatings are applied to the steel sheet surface is through a process called Hot Dipped Galvanizing (HDG). In this process, continuous coils of steel sheet are pulled at a controlled speed through a bath containing molten Zinc (Zn) at ~ 460° C. The Zn reacts with the steel and forms a bond. The excess liquid metal sticking on the sheet surface as it exits the bath is wiped off using a gas wiping process to achieve a controlled coating weight or thickness per unit area.
As mentioned earlier, AHSS are commercially available with Hot Dipped Galvannealed (HDGA) or Hot Dipped Galvanized (HDGI) coatings. The term “galvanize” comes from the galvanic protection that Zn provides to steel substrate when exposed to a corroding medium. An HDGA coating is obtained by additional heating of the Zn-coated steel at 450-590°C (840-1100°F) immediately after the steel exits the molten Zn bath. This additional heating allows iron (Fe) from the substrate to diffuse into the coating. Due to the diffusion of Fe and alloying with Zn, the final coating contains about 90% Zn and 10% Fe. Due to the alloying of Zn in the coating with diffused Fe, there is no free Zn present in the GA coating.
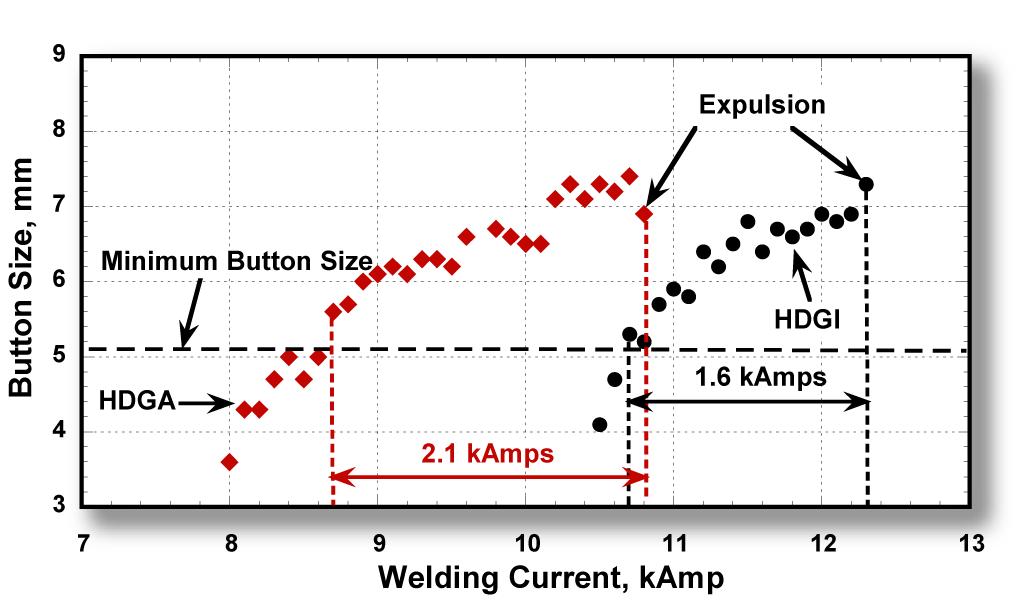
A studyT-7 was undertaken to examine whether differences exist in the RSW behavior of DP 420/800 with a HDGA coating compared to a HDGI coating. The Resistance SW evaluations consisted of determining the welding current ranges for the steels with HDGA and HDGI coatings. Shear and cross-tension tests also were performed on spot welds made on steels with both HDGA and HDGI coatings. Weld cross sections from both types of coatings were examined for weld quality. Weld micro hardness profiles provided hardness variations across the welds. Cross sections of HDGA and HDGI coatings, as well as the electrode tips after welding, were examined using a Scanning Electron Microscope (SEM). Composition profiles across the coating depths were analyzed using a glow-discharge optical emission spectrometer to understand the role of coating in RSW. Contact resistance was measured to examine its contribution to the current required for welding. The results indicated that DP 420/800 showed similar overall welding behavior with HDGA and HDGI coatings. One difference noted between the two coatings was that HDGA required lower welding current to form the minimum nugget size. This may not be an advantage in the industry given the current practice of frequent electrode tip dressing. Welding current range for HDGA was wider than for HDGI. However, the welding current range of 1.6 kA obtained for HDGI coated steel compared to 2.2 kA obtained for the HDGA coated steel is considered sufficiently wide for automotive applications and should not be an issue for consideration of its use (Figure 1).
Figure 1: Welding current ranges for 1.6-mm DP 420/800 with HDGA and HDGI coatings.T-7
As was mentioned briefly in Resistance Spot Welding, electrode wear is a larger issue when welding coated steels. In high-volume automotive production of Zn-coated steels, the rate of electrode wear tends to accelerate compared to the rate when welding uncoated steels. The accelerated electrode wear with coated steel is attributable to two mechanisms. The first mechanism is increasing in the electrode contact area (sometimes referred to as mushrooming effect) that results in decreased current density and smaller weld size. The second mechanism is electrode face erosion/pitting due to chemical interaction of the Zn coating with the Cu alloy electrode, forming various brass layers. These layers tend to break down and extrude out to the edges of the electrode (Figure 2). To overcome this electrode wear issue, the automotive industry is using automated electrode dressing tools and/or weld schedule adjustments via the weld controller. Typical adjustments include increase in welding current and/or increase in electrode force, while producing more welds. Research and development work has been conducted to investigate alternative electrode material and geometries for improving electrode life.
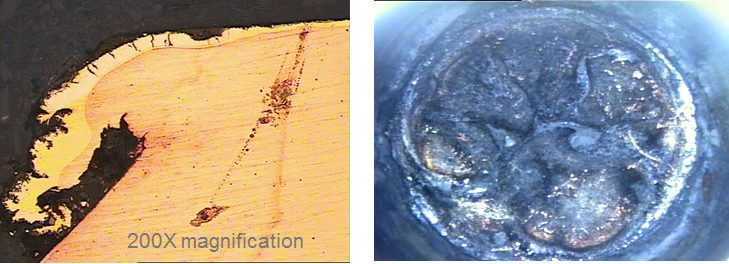
Figure 2: Erosion/pitting and extrusion of brass layers on worn RSW electrode.U-2
The resistance weldability of coated steels can also cause problems. In many applications, more intricate welding schedules are used to ensure welds meet the size and strength requirements. Studies have been conducted to determine the nugget growth and formation mechanisms to properly select parameters for each pulse of a three-pulse welding scheduleJ-2 (Figure 3). The first pulse, high current and short weld time, is used to mitigate the effects of the coating on welding and develop contact area at the sheet-to-sheet interface. The second pulse, low current long weld time, is used to grow the weld nugget and minimize internal defects. The third pulse, medium current and long weld time, is used to grow the weldability current range and maximize the nugget diameter.
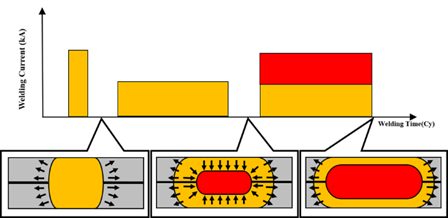
Figure 3: Weld growth mechanism of optimized three-pulse welding condition.J-2
In static or dynamic conditions, the spot weld strength of Advanced High-Strength Steels (AHSS) may be considered as a limiting factor. One solution to improve resistance spot weld strength is to add a high-strength adhesive to the weld. Figure 1 illustrates the strength improvement obtained in static conditions when crash adhesive (in this case, Betamate 1496 from Dow Automotive) is added. The trials were performed with 45-mm-wide and 16-mm adhesive bead samples.
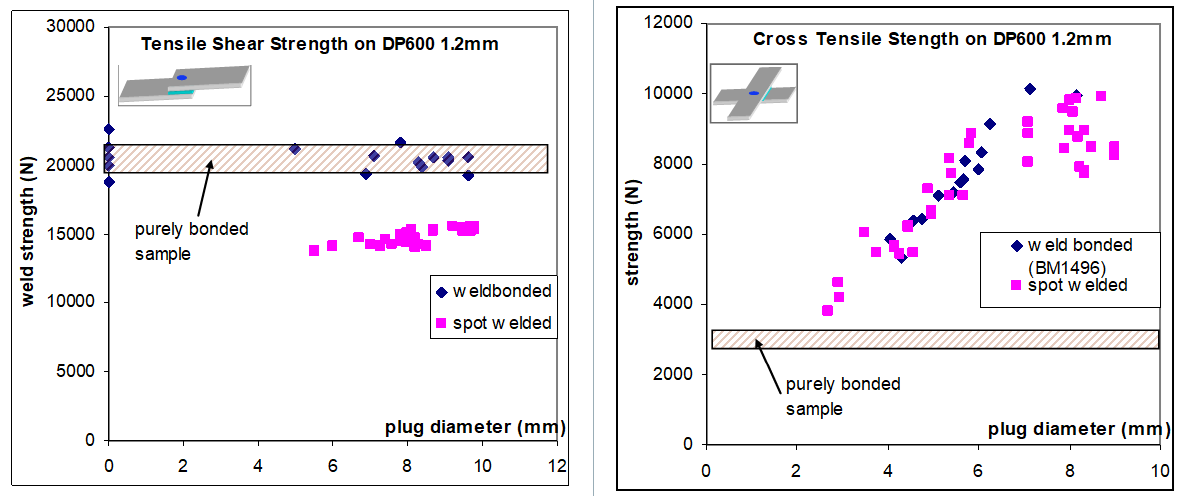
Figure 1: Tensile Shear Strength and Cross Tensile Strength on DP 600.A-16
Another approach to improve the strength of welds is done by using laser welding instead of spot welding. Compared to spot welding, the main advantage of laser welding, with respect to the mechanical properties of the joint, is the possibility to adjust the weld dimension to the requirement. One may assume that, in tensile shear conditions, the weld strength depends linearly on the weld length as indicated in the results of a trial A-16, shown in Figure 2.
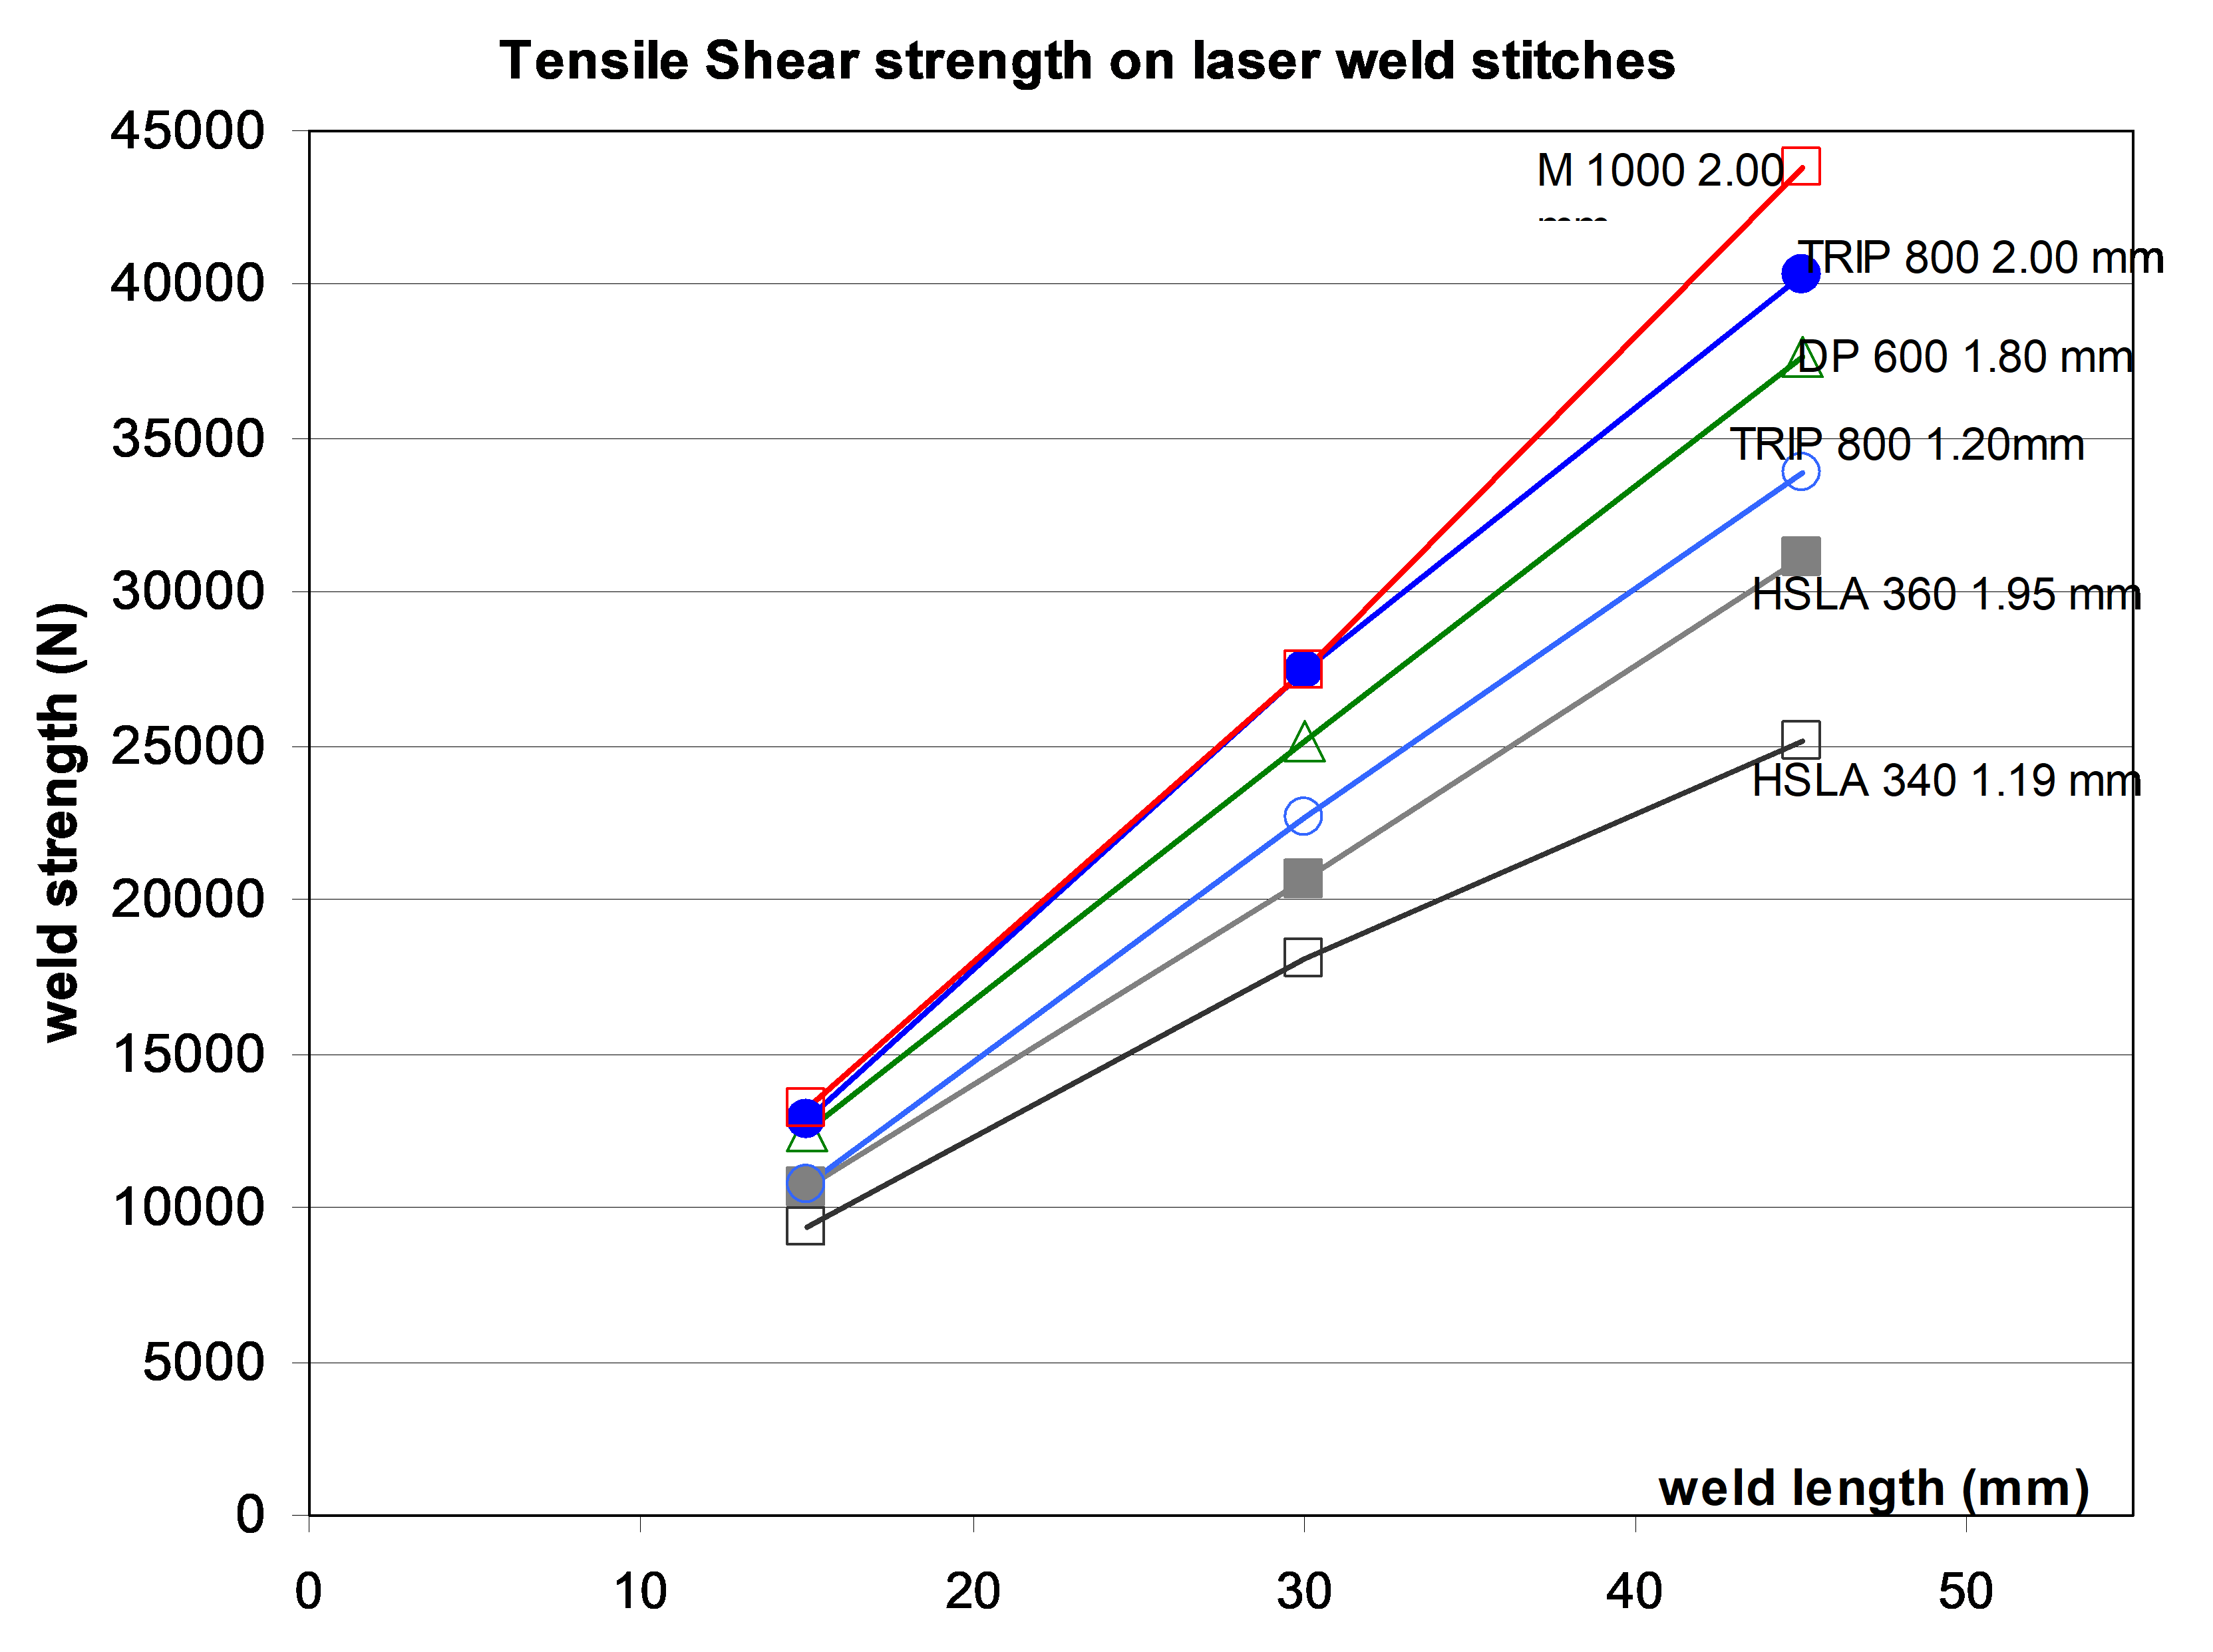
Figure 2: Tensile-shear strength on laser weld stitches of different length.A-16
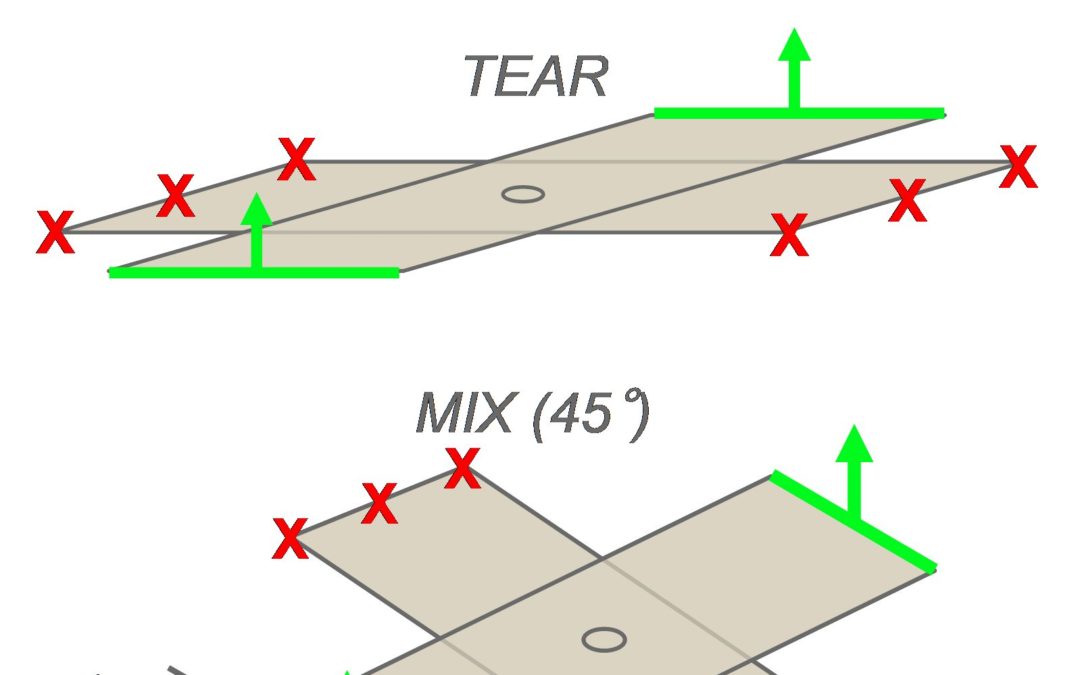
However, a comparison of spot weld to laser weld strength cannot be restricted to the basic tensile shear test. Tests were also conducted to evaluate the weld strength in both quasi-static and dynamic conditions under different solicitations, on various AHSS combinations. The trials were performed on a high-speed testing machine, at 5 mm/min for the quasi-static tests and 0.5 m/s for the dynamic tests (pure shear, pure tear or mixed solicitation, as shown in Figure 3). The strength at failure and the energy absorbed during the trial were measured. Laser stitches were done at 27mm length. C- and S-shape welds were performed with the same overall weld length.
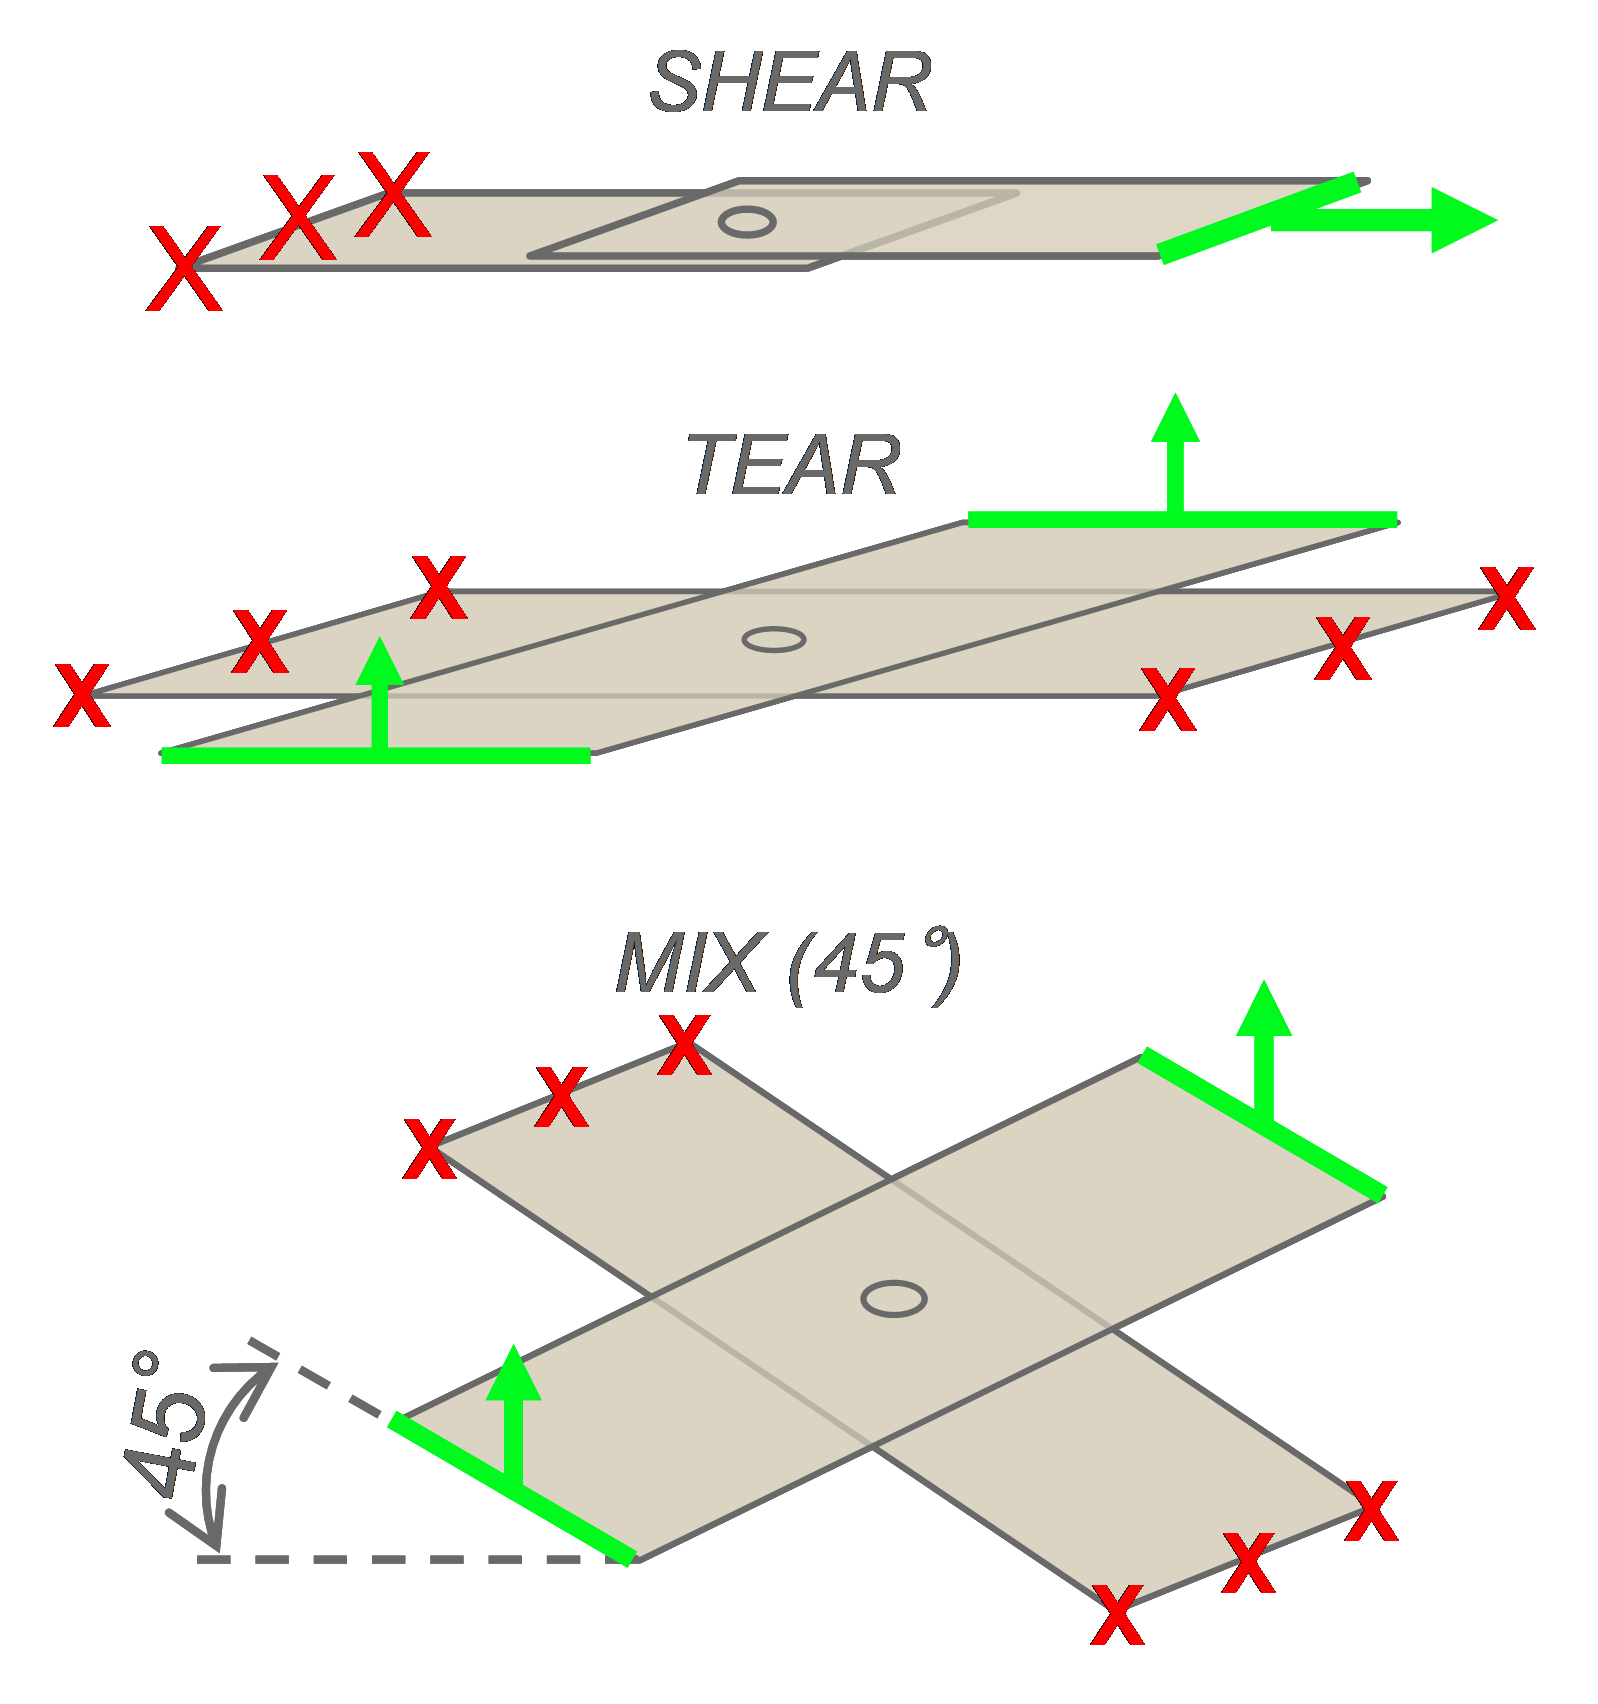
Figure 3: Sample geometry for quasi-static and dynamic tests.A-16
The weld strength at failure is described in Figure 4, where major axes represent pure shear and tear (Figure 4). For a reference spot weld corresponding to the upper limit of the weldability range, globally similar weld properties can be obtained with 27mm laser welds. The spot weld equivalent length of 25-30 mm has been confirmed on other test cases on AHSS in the 1.5- to 2 mm thickness range. It has also been noticed that the spot weld equivalent length is shorter on thin mild steel (approximately 15-20 mm). This must be considered when shifting from spot to laser welding on a given structure. There is no major strain rate influence on the weld strength; the same order of magnitude is obtained in quasi-static and dynamic conditions.
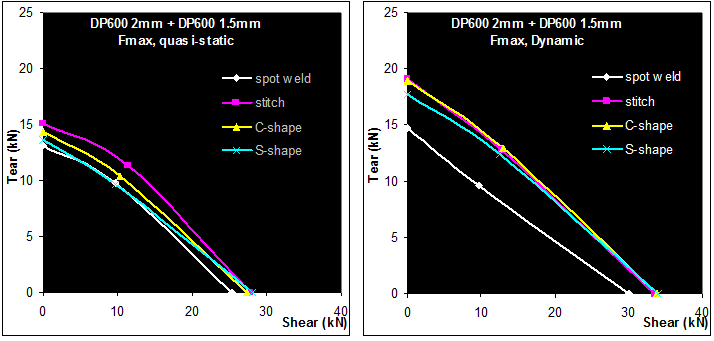
Figure 4: Quasi-static and dynamic strength of welds, DP 600 2 mm+1.5 mm.A-16
The results in terms of energy absorbed by the sample are seen in Figure 5. In tearing conditions, both the strength at fracture and energy are lower for the spot weld than for the various laser welding procedures. In shear conditions, the strength at fracture is equivalent for all the welding processes. However, the energy absorption is more favorable to spot welds. This is due to the different fracture modes of the welds; for example, interfacial fracture is observed on the laser welds under shearing solicitation. Even if the strength at failure is as high as for the spot welds, this severe failure mode leads to lower total energy absorption.
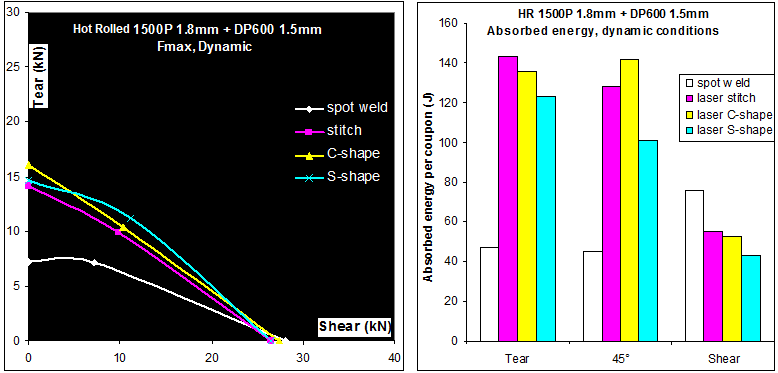
Figure 5: Strength at fracture and energy absorption of Hot Rolled 1500 1.8-mm + DP 600 1.5-mm samples for various welding conditions.A-16
Figure 6 represents the energy absorbed by omega-shaped structures and the corresponding number of welds that fail during the frontal crash test (here on TRIP 800 grade). It appears clearly that laser stitches have the highest rate of fracture during the crash test (33%). In standard spot welding, some weld fractures also occur. It is known that AHSS are more prone to partial interfacial fracture on coupons, and some welds fail as well during crash tests. By using either Weld-Bonding or adapted laser welding shapes, weld fractures are mitigated, even in the case of severe deformation. As a consequence, higher energy absorption is also observed.
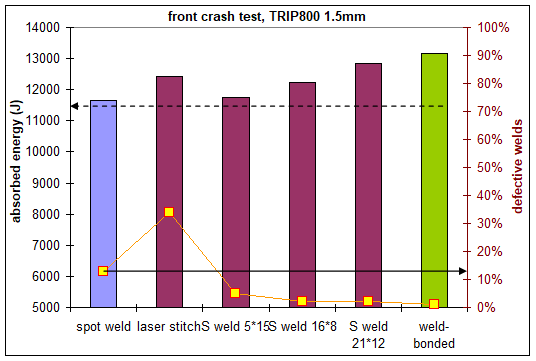
Figure 6: Welding process and weld shape influence on the energy absorption and weld integrity on frontal crash tests.A-16
Up to a 20% improvement can be achieved in torsional stiffness, where the best results reflected the combination of laser welds and adhesives. Adhesive bonding and weld- bonding lead to the same stiffness improvement results due to the adhesive rather than the additional welds. Figure 7 shows the evolution of the torsional stiffness with the joining process. Optimized laser joining design leads to the same performances as a weld bonded sample in fracture modes, shown in Figure 8.
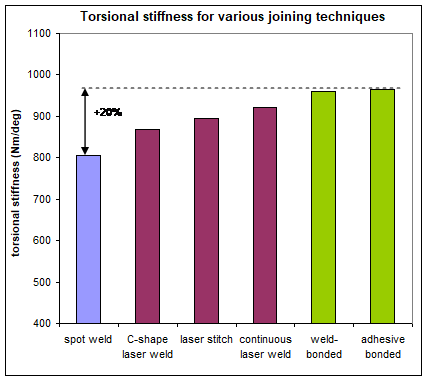
Figure 7: Evolution of the torsional stiffness with the joining process.A-16
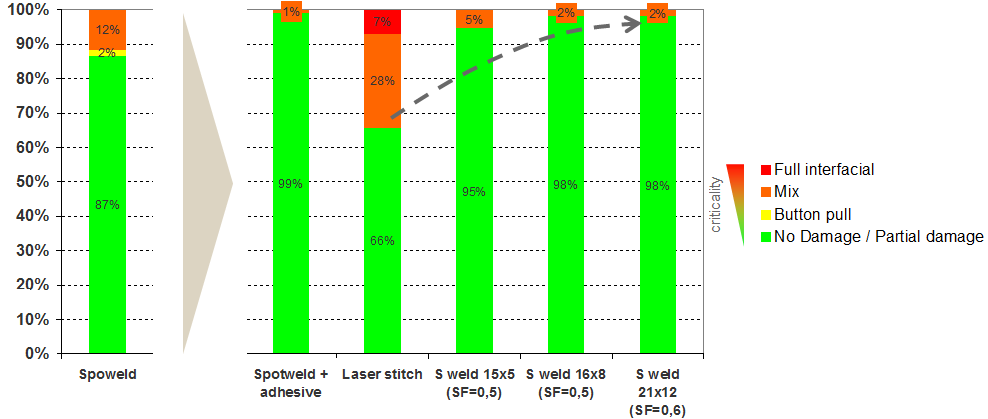
Figure 8: Validation test case 1.2-mmTRIP 800/1.2-mm hat-shaped TRIP 800.
Top-hat crash boxes were tested across a range of AHSS materials including DP 1000. The spot weld’s energy absorption increased linearly with increasing material strength. The adhesives were not suitable for crash applications as the adhesive peels open along the entire length of the joint. The weld bonded samples perform much better than conventional spot welds. Across the entire range of materials there was a 20-30% increase in mean force when weld bonding was used; the implications suggesting a similarly significant improvement in crash performance. Furthermore, results show that a 600 MPa weld bonded steel can achieve the same crash performance as a 1000 MPa spot-welded steel. It is also possible that some down gauging of materials could be achieved, but as the strength of the crash structure is highly dependent upon sheet thickness, only small gauge reductions would be possible. Figure 9 shows the crash results for spot-welded and weld bonded AHSS.
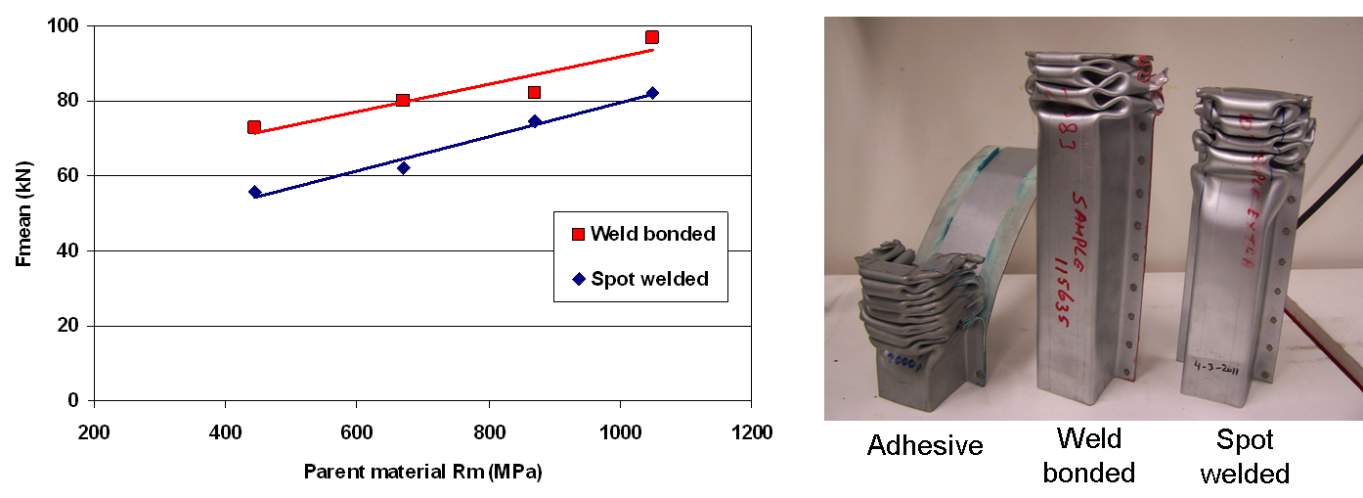
Figure 9: Crash results for spot-welded and weld bonded AHSS.
J-2. C. Ji, M. Kimchi, Y. Kim and Y. Park, “The application of pulsed current in resistance spot welding of zn-coated hot-stamped boron steels,” in Advances in Resistance Welding, Miami, FL, 2016.
In general, if any type of AHSS [Dual-Phase (DP), Transformation-Induced Plasticity (TRIP), Complex Phase (CP), Ferrite Bainite (FB), or Martensitic (MS)] is used for the first time, the user should take the welding schedules applied to mild steel and then:
If these changes are insufficient, try these additional changes:
When resistance welded, AHSS require less current than conventional mild steel or HSLA because AHSS have higher electrical resistivity. Therefore, current levels for AHSS are not increased and may even need to be reduced depending on material chemical composition. However, most AHSS grades may require higher electrode forces for equivalent thickness of mild steels because electrode force depends on material strength. If thick mild steel or HSLA steel (of the same thickness) is replaced by an equivalent thickness of AHSS, the same forces may be required during assembly welding.
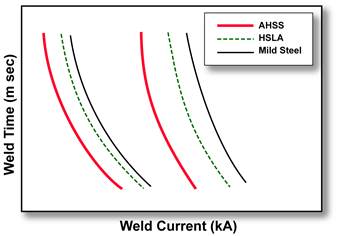
AHSS often have tighter weld windows (welding parameters that give acceptable welds) when compared to mild steels, as shown in the Figure 1.
Figure 1: Schematic weld lobes for AHSS, HSLA, and mild steel with a shift to lower currents with increased strength.
The current range (kA) for AHSS of 600-1400MPa during RSW is shown in Figures 2 and 3. The process window for Resistance Spot Welding of AHSS is influenced by the electrode force and welding time used in a major way. The current range increases by an average of 500 A for every additional 500 N of electrode force (Figure 2). The current range also increases by an average of 250 A for each additional 40 ms of welding time (Figure 3). Extra amounts of electrode force and welding time lead to increased current range, allowing for a wider process window.
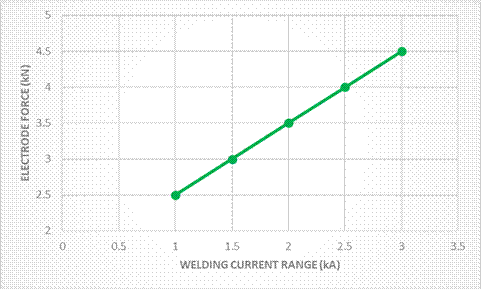
Figure 2: RSW with AHSS, current range for varying electrode force (Cap Type B 16/6, 6-mm tip diameter, single pulse, 340-ms weld time, 250-ms hold time, plug failures.).I-6
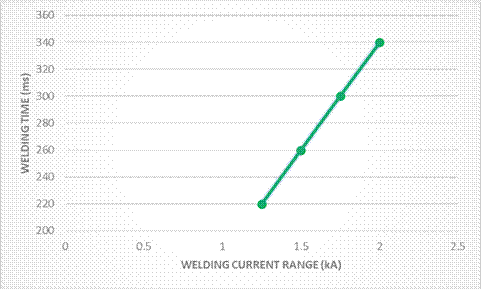
Figure 3: RSW with AHSS, current range for varying weld time (Cap Type B 16/6, 6-mm tip diameter, single pulse, 3.5-kN electrode force, 250-ms hold time, plug failures.).O-1
A more extensive weld studyT-5 of three DP HDGA (45/45 g/m2) coated steels showed similar welding behavior for all three steels. The 1.6-mm-thick steels were DP 340/590, DP 420/780, and DP 550/980. To characterize the welding behavior of the steels, useful current ranges and static weld tensile tests were performed. The useful current range is the difference between the welding current required to produce a minimum button size (Imin) and the current that causes expulsion of weld metal (Imax). In this study, the 4√t as the minimum button diameter was used, where “t” is the nominal sheet thickness. This is generally used in the automotive and steel industries. The weld current range was 2.2 kA for the DP 340/590 and DP 420/780 and 2.5 kA for the DP 550/980 steel (Figure 4). These current ranges are sufficiently wide to weld successfully the DP steels. The study also found no weld imperfections, which means these three DP steels are weldable with simple, easy to use welding parameters.
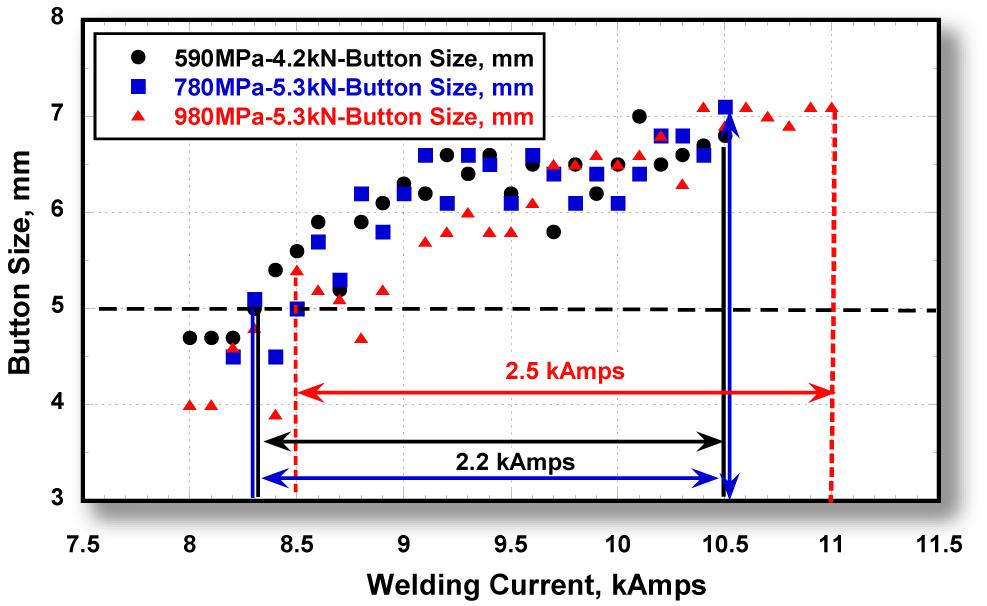
Figure 4: Welding current ranges for 1.6-mm DP HDGA steels with minimum tensile strengths of 590, 780, and 980 MPa.T-5
Average reported weld hardness was 380 HV (Vickers Hardness) for the DP 340/590 and 415 HV for the other two. Again, all three DP steels had similar weld hardness distributions. The study also concluded that weld fracture mode alone is not a good indicator of weld integrity and performance. The load to fracture should be considered more important in judging weld integrity.
A second studyT-6 compared two 1.6-mm-thick HDGA (45/45 g/m2) steels: DP 420/700 and TRIP 420/700. The weld current range for 18 cycles weld time was similar: 1.4 kA for the DP 420/700 and 1.5 kA for the TRIP 420/700. The average weld hardness was 400 HV for both steels. The study concluded that acceptable welds with no imperfections can be produced in both steel grades. Both steel grades are readily weldable with easily adoptable welding parameters. Weld tensile strength differences between the two steels were small and not considered statistically significant.
Weld schedules (Figure 5) with pulsed current profiles for AHSS can have weld-current ranges similar to mild steel. Even though there is no increased tendency for weld expulsion with AHSS avoiding weld expulsion is highly desirable with AHSS. Loss of nugget material can affect weld-nugget size and strength.
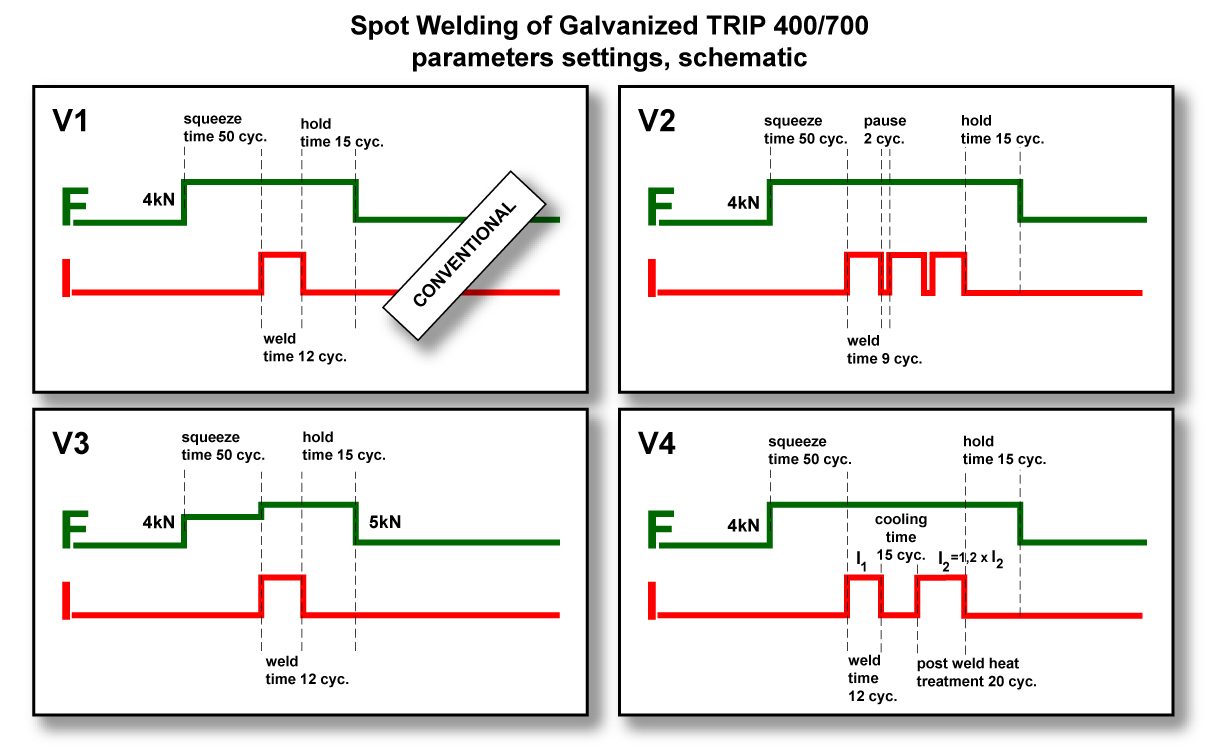
Figure 5: Schematics of optimized weld schedules for AHSS.B-1
Post annealing (tempering pulse weld schedule) of TRIP steel may alter weld fracture mode and weld current range (Figure 6). However, since studies have shown that the occurrence of partial or IF fractures does not necessarily indicate poor weld quality, the use of pulsed current is not required to improve weld quality. Further, the effect of current pulsing on tensile and fatigue properties, as well as the electrode tip life, is not known. Therefore, users should perform their own evaluations regarding the suitability of such modified parameters.
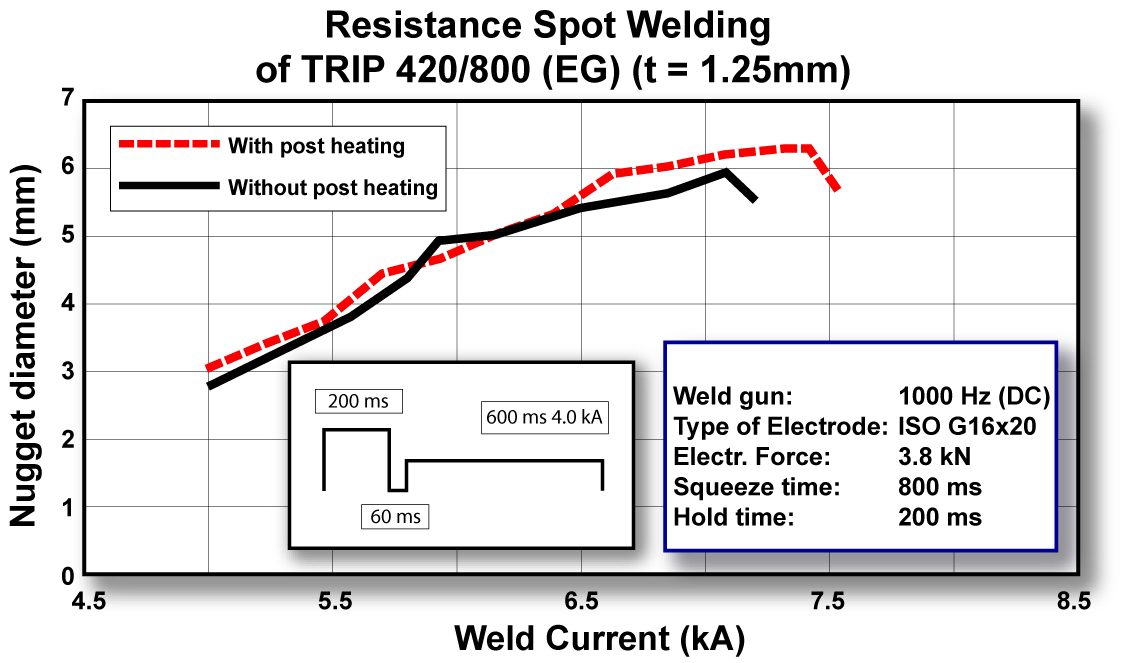
Figure 6: Post annealing may enlarge weld current range.B-1
Additional work using Quench and Partition (Q&P) 980 showed less current required than conventional steels because it has higher electrical resistivity. Due to ultra-high base metal (BM) strength, it needs higher electrode force than conventional steels which have equivalent thickness. The weld lobe of 1.6-mm Q&P 980 is shown in Figure 7 with the pulsed weld time and force of 5.8 kN. The yellow zone of this figure shows the fracture mode of full button (FBF) when peel tested. Some pictures of these weld spots’ fracture mode are captured in Figure 8, for diameters of 6.0 to 7.7 mm.
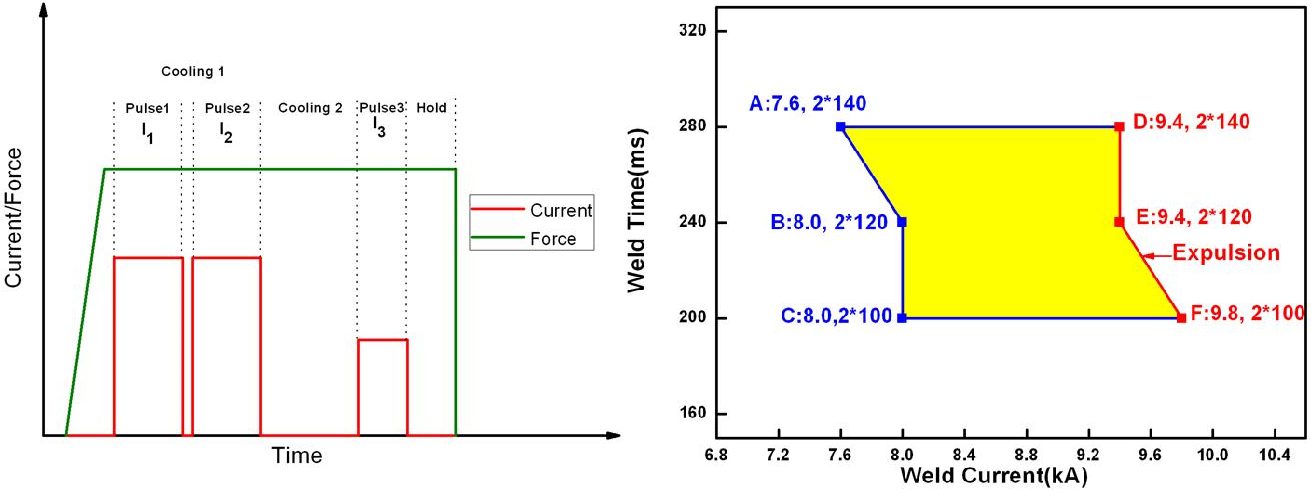
Figure 7: Pulsed current profile and weld lobe of 1_6-mm Q&P 980.B-4
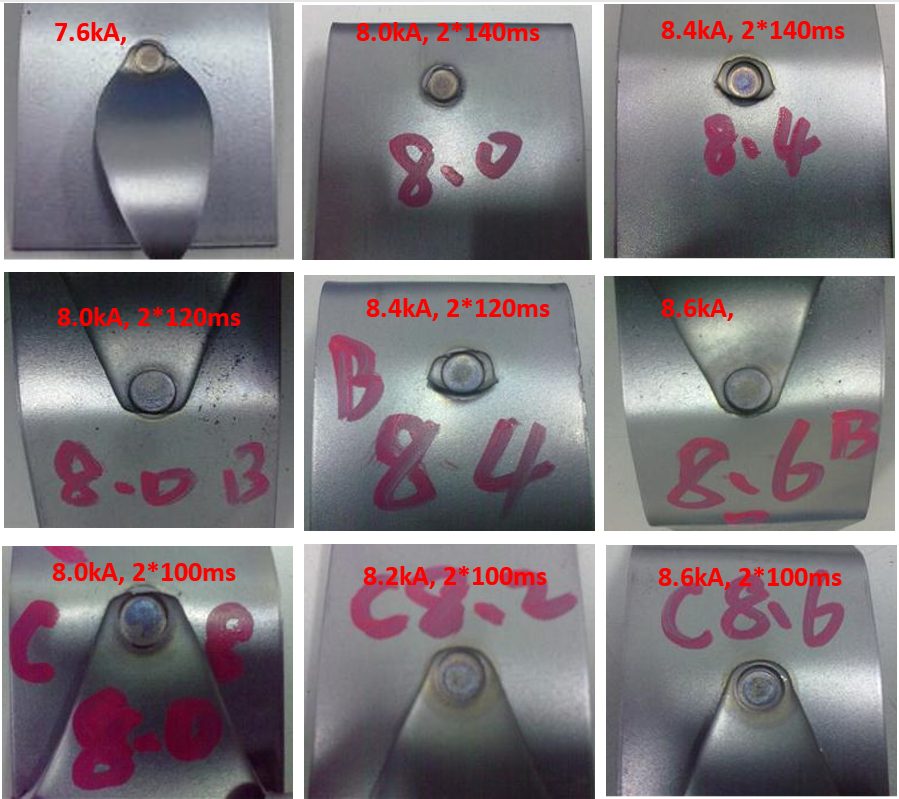
Figure 8: Fracture mode of weld spots in yellow zone.B-4
Hardness measurements and cross sections through the spot weld different zones can be identified as depicted in Figure 9. In a first step, the spot-welded joint can be subdivided into three zones: weld, Heat Affected Zone (HAZ), and BM. The weld is covered by the HAZ, where the melting temperature is not reached but high enough to change the microstructure. This region is dominated by inhomogeneous properties due to the different temperature and cooling gradients. Considering the hardness measurements of AHSS 3 sample, even a softening in the HAZ compared to the BM can be observed. Finally, the HAZ is surrounded by the BM, which does not show any local changes within the structure. These modifications of microstructure in the HAZ and weld are essential for the load-bearing capacity because the strength and ductility are drastically changed in comparison to the BM. Normally a high hardness is related to high strength and less ductility.
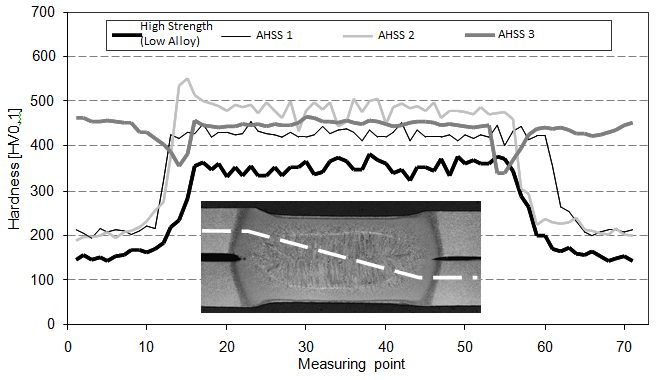
Figure 9: Hardness distribution through spot welds of various strength steels.P-7
Weld spot micrograph and microhardness of 1.6-mm Q&P 980 is shown in Figure 10, in which no weld defects, such as cracks, shrinkage void, pore, no fusion, deep indentation, etc. were found. Hardness testing is typically performed as shown in Figure 11 (diagonal traverse across the weld from BM of top coupon to BM of bottom coupon) using a suitable instrument for micro-indentation hardness testing (Vickers or Knoop).
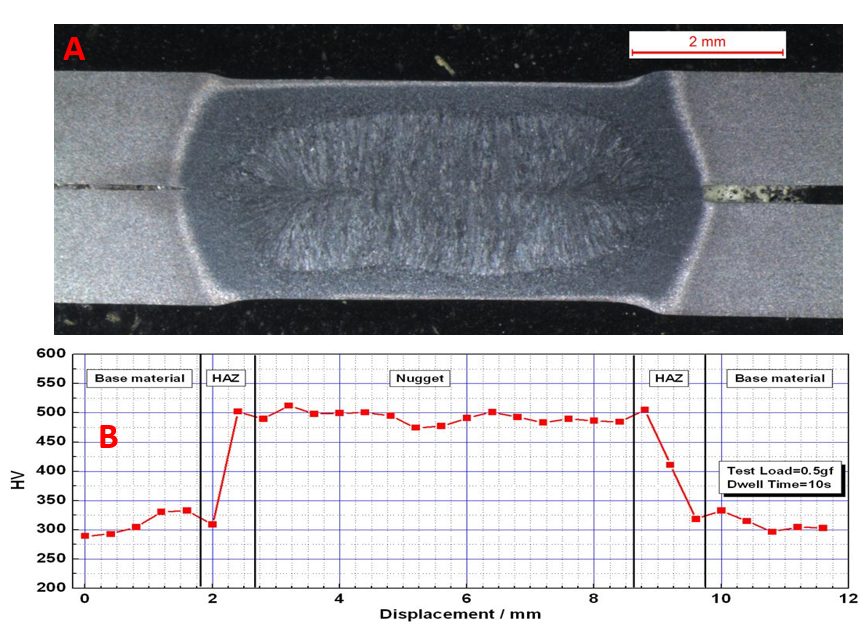
Figure 10: Weld spot micrograph and microhardness of 1.6-mm DP 980.B-4
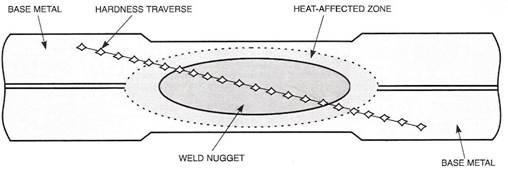
Figure 11: Typical cross-sectioned weld and hardness traverse.A-13
The different hardness values seen in a typical cross-sectioned weld depict different microstructural regions.P-8 Figure 12 shows the temperature distribution of a typical 2T weldment of hot stamped boron steel. At the solidified weld nugget, we see the highest temperatures and steadily decrease toward the unaffected base metal. The weld metal, coarse grain heat affected zone, fine grain heat affected zone, and unaffected base metal are made up of martensitic microstructure. The base metal has this microstructure due to the heat treatment (hot stamping) process. The weld metal, coarse grain heat affected zone, and fine grain heat affected zone are exposed to austenitizing temperature upon welding and are cooled rapidly reforming the martensite microstructure. The subcritical heat affected zone has a unique microstructure of over-tempered martensite. In this region, the peak temperature re below the Ac1, causing the base metal martensitic microstructure to decompose into ferrite and cementite. Micrographs of the different weld regions can be seen in Figure 13.
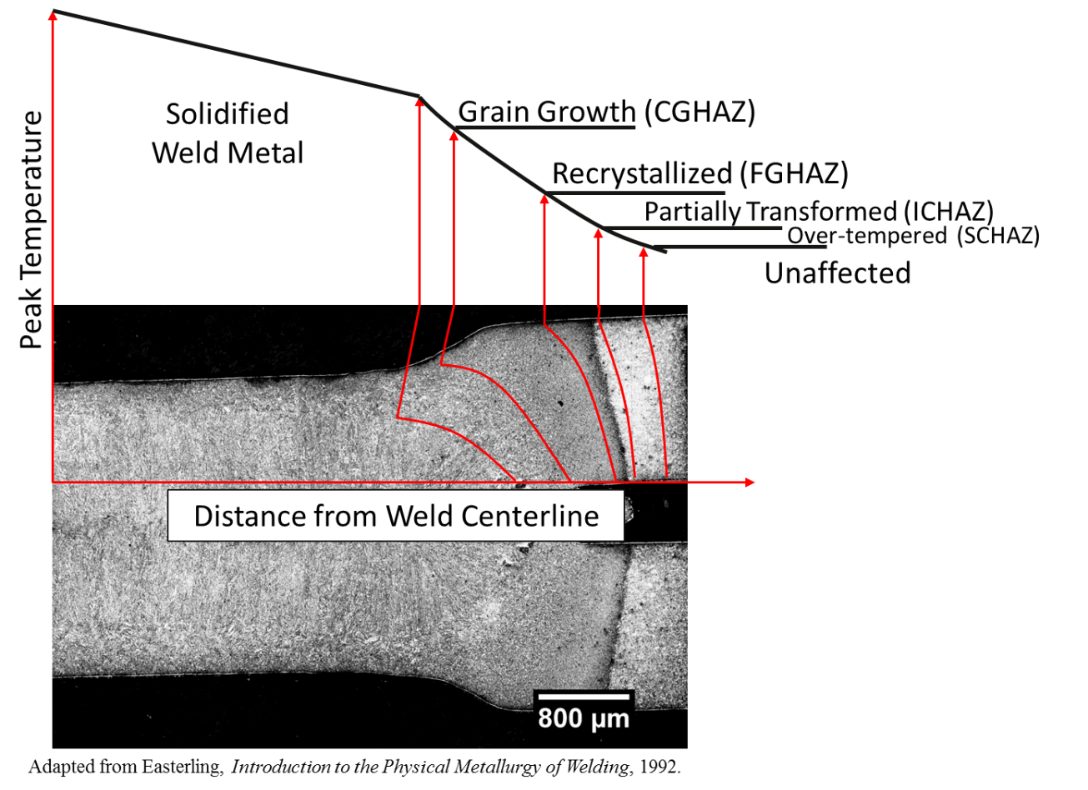
Figure 12: Temperature distribution of a typical 2T RSW of hot stamped boron steel.P-8
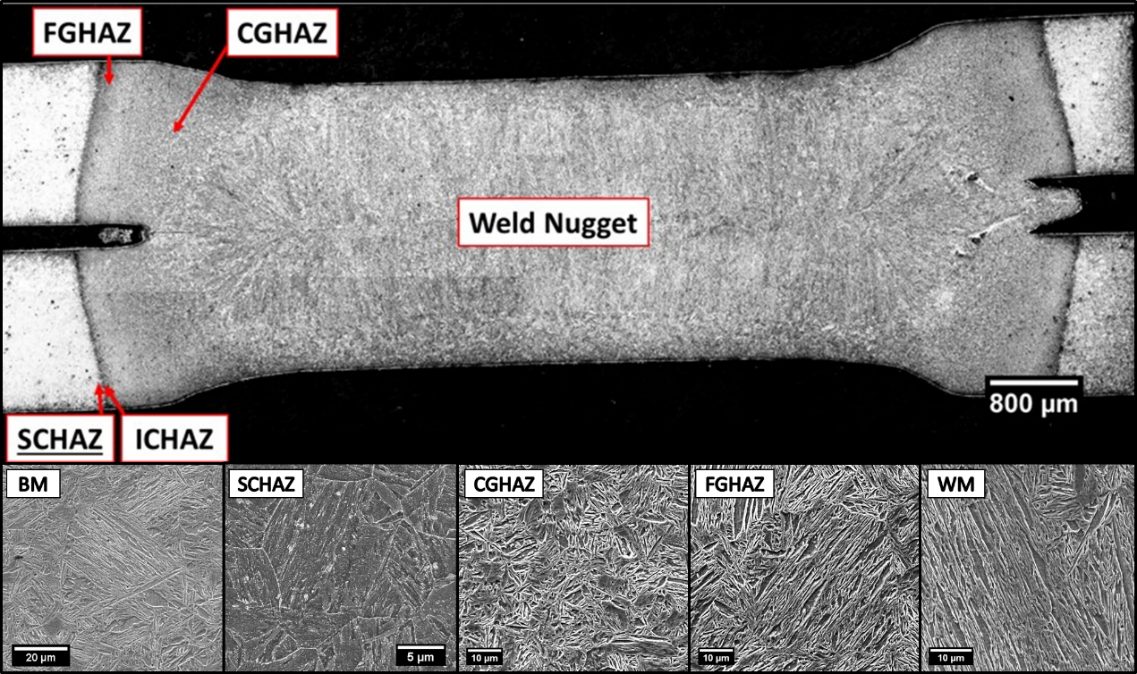
Figure 13: Different microstructures seen throughout the HAZ of a 2T hot stamped boron steel joint.P-8