One of the methods by which the coatings are applied to the steel sheet surface is through a process called Hot Dipped Galvanizing (HDG). In this process, continuous coils of steel sheet are pulled at a controlled speed through a bath containing molten Zinc (Zn) at ~...
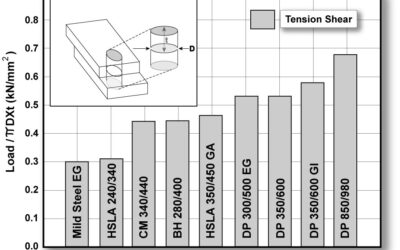
Coating Effects
read more