Joining, Laser Welding
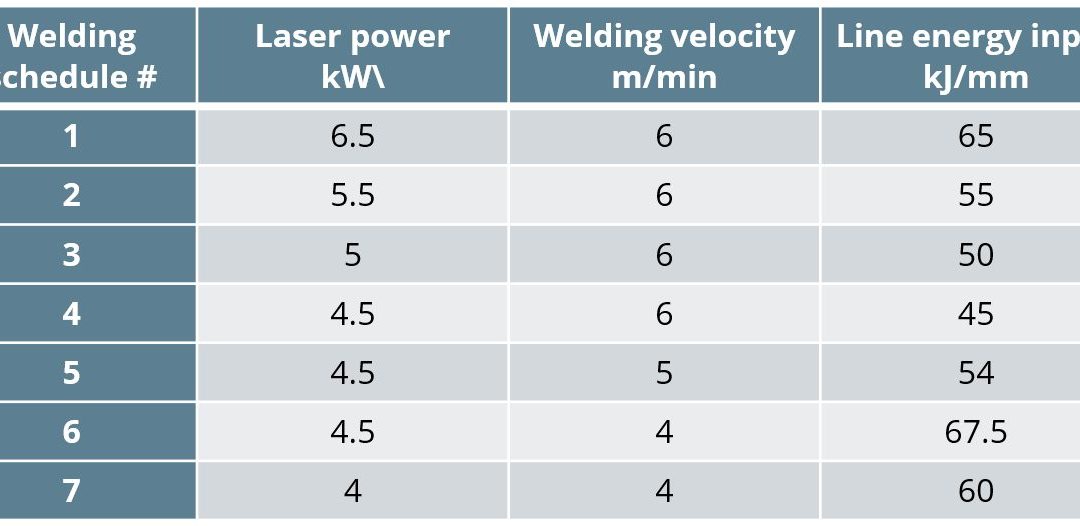
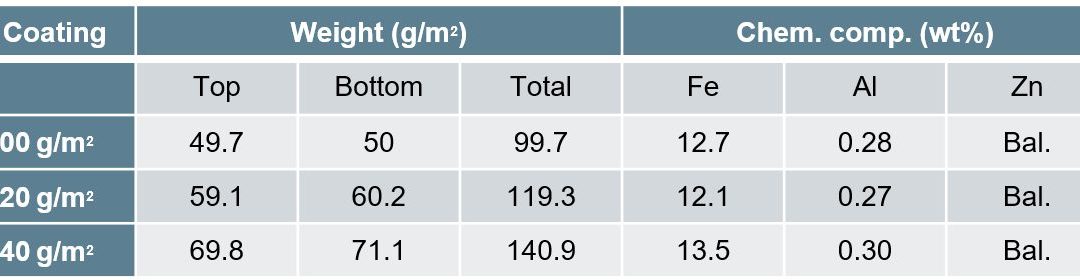
In this study by Shanghai Jiao Tong University and General Motors Company on liquid metal Embrittlement (LME)Z-11, hot dipped 1.2mm galvanized QP980 steel sheets with a 6 micron thick zinc rich coating on top of a 2 micron thick transition zone to the base metal were used. The laser welder is tilted 5º ahead of weld pool to avoid back reflection. The welding velocity was varied from 4-6 m/min and laser power from 4-6.5 kW. Referencing Table 1, Schedules #1–4 were intended to investigate effects of laser power on LME cracks using 6 m/min. schedules #4–6 varied velocity with the laser power staying constant at 4.5 kW. In addition, schedules #6 and #7 varied laser power at a relatively lower welding velocity of 4 m/min.
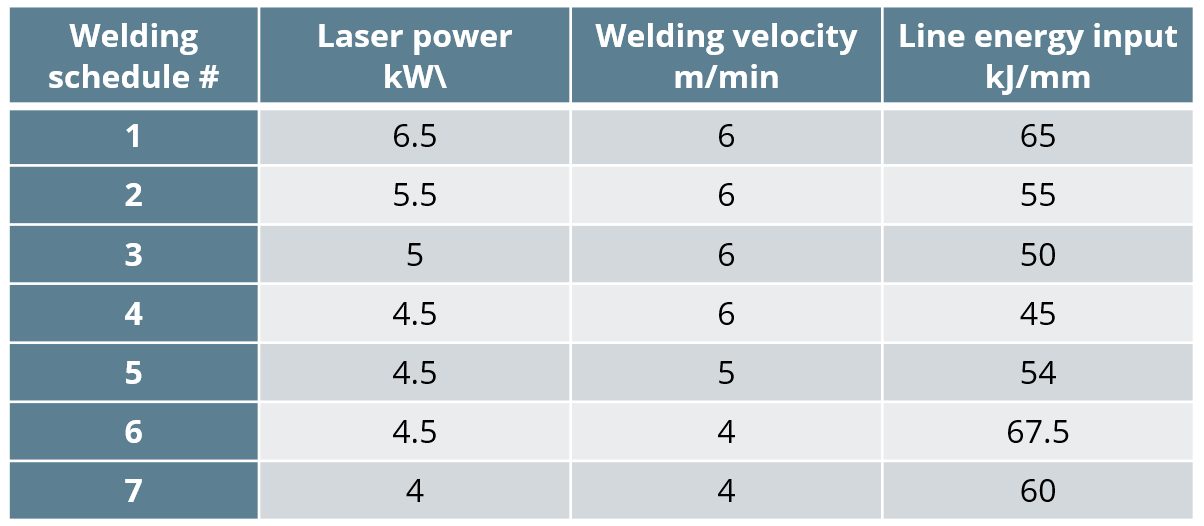
Table 1: Process Parameters.Z-11
Full penetration welds did not result in cracking while partial penetration welds with lower energy density did. The lowest energy density welds resulted in no cracking but the penetration was barely beyond the faying surface. Cracks resembles an inverse “Y” where the cracks initiated at the faying surface and propagated along the direction of solidification towards the weld centerline. Cracks at notch root were wider than centerline crack indicating grain boundary separation. The fracture method is characteristic of quasi-cleavage indicating that the grain boundaries were embrittled by Fe-Zn intermetallics. Crack initiation at the faying surface can be explained by the residual stresses that form highest at the faying surface during cooling. This stress concentration is eliminated with full penetration weld pass as well as in wide and shallow passes as seen in Figure 1.
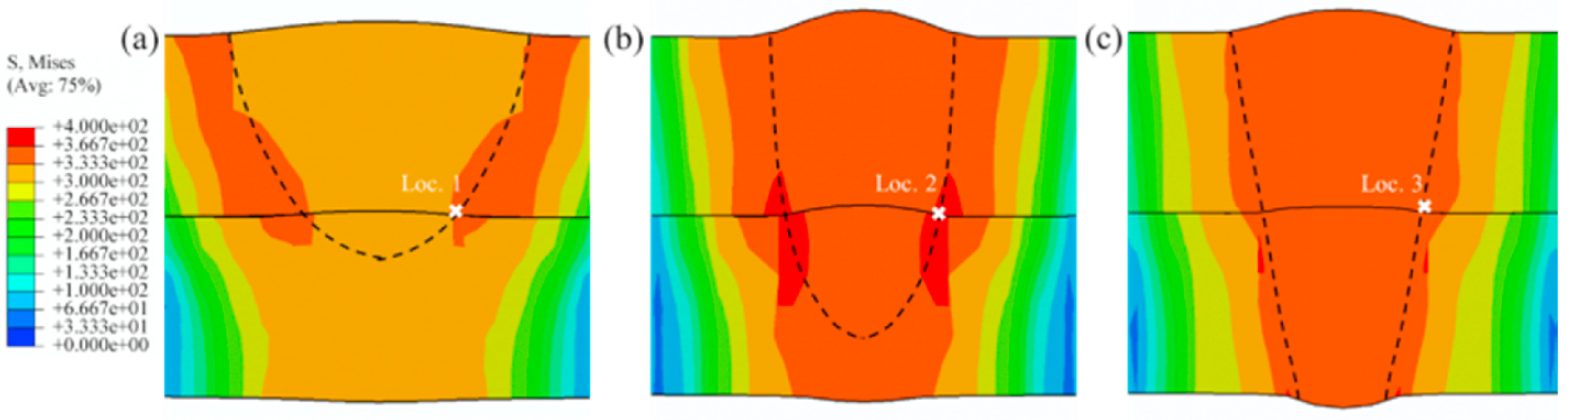
Figure 1: Von Mises Stress Distribution.Z-11
Because the process of laser welding is so short, the vaporized zinc and intermetallics do not have time to outgas completely. The liquid zinc diffuses along the austenite grain boundaries and stabilize ferrite given ferrite has a higher solubility of Zn compared to austenite. The remaining liquid Zn reacts with the ferrite to form the solid Γ-Fe3Zn10 which is a hard brittle intermetallic that can easily induce cracking. Another peritectic reaction occurs with Γ-Fe3Zn10 and liquid zinc forming another brittle intermetallic δ-FeZn10. The stabilized ferrite and intermetallics occur before austenite transform to martensite and remains even after this reaction occurs.
The formation of the intermetallics between the grain boundaries decreases ductility and with the combination of the high residual stress and stress concentration at the faying surface, the crack initiates and propagates. The cracking follows the grain growth to the center of the weld. Liquid Zn accumulates at the center of the weld and results in Fe-Zn intermetallics with low ductility that can eventually propagate cracking that occurs at the edge of the weld. Welds that result in a smaller cross-sectional area on the faying surface benefit from the reduction in vaporized Zn that cannot be outgassed while full penetration welds with keyhole mode can allow Zn to out gas from both the top and bottom of the weld as well as increased nugget size decreasing the Zn concentration to where brittle Fe-Zn phases do not form. Full penetration welds are recommended to reduce residual stress as well as allow sufficient outgassing of vaporized Zn in the weld pool.
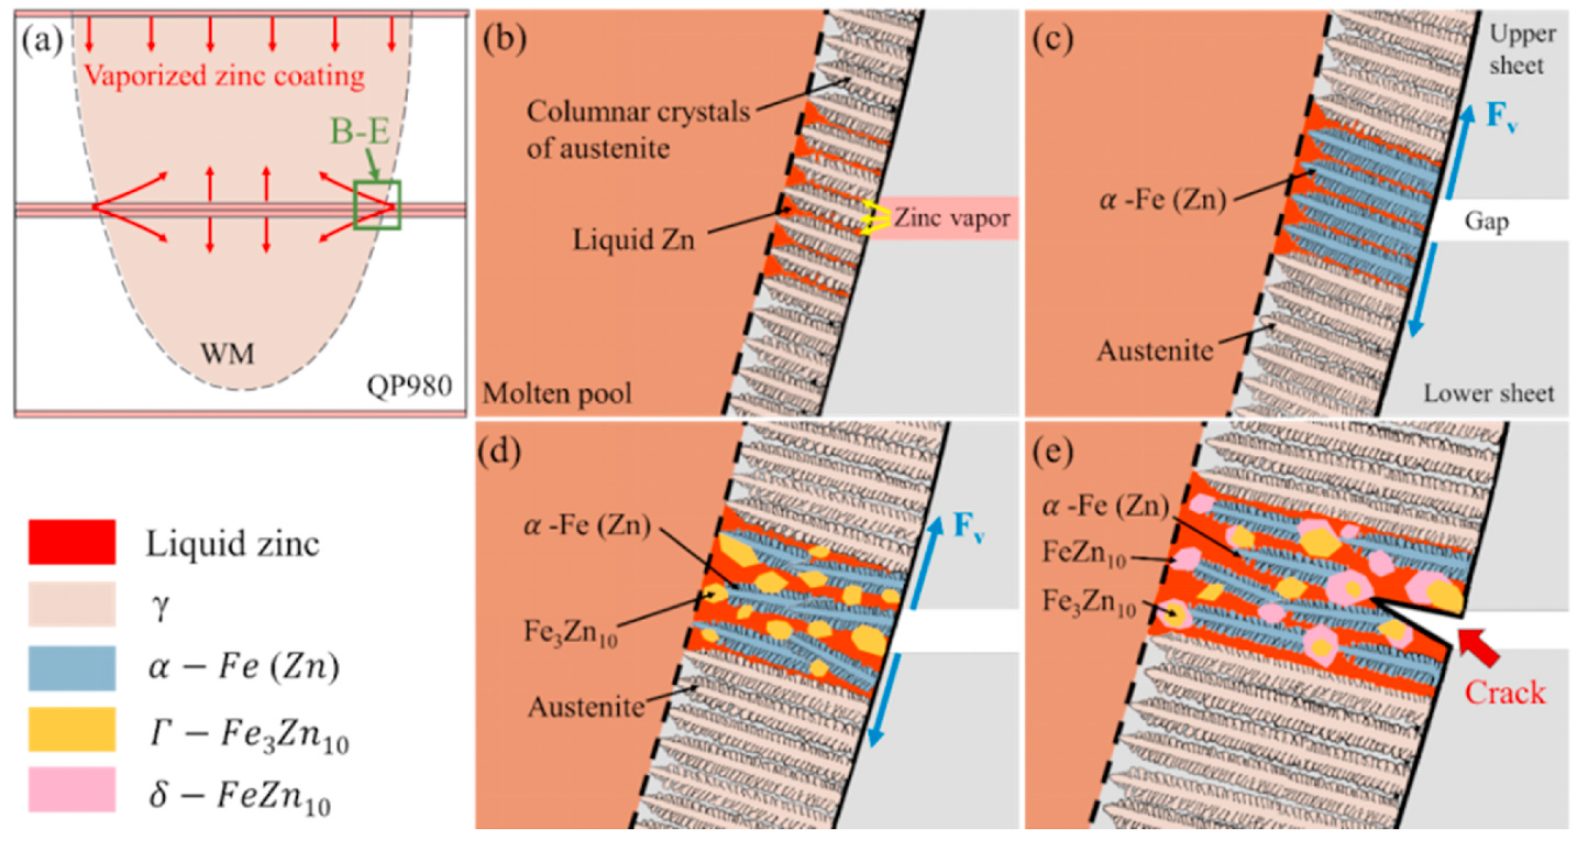
Figure 2: LME illustration.Z-11
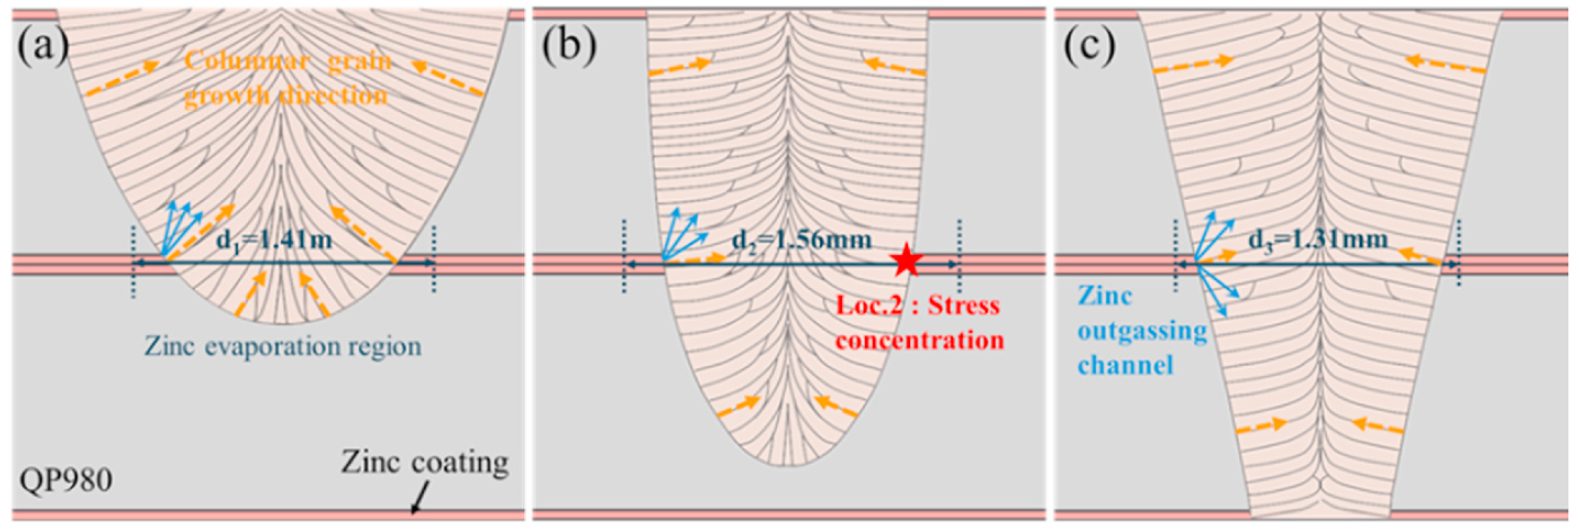
Figure 3: Zn diffusion.Z-11
Summary
LME cracks initiated at the weld notch root on the faying surface and propagated towards the center of the weld along the direction of columnar growth. Brittle intermetallic help induce cracking in the weld metal in addition to restraint from the weld joint. Full penetration welds were found to reduce Zn content from the weld in addition to reducing restraint as compared to partial penetration welds. The full penetration weld allowed for zinc to be outgassed from the weld on both sides reducing the Zn content in the weld to an acceptable level. Full penetration welds also reduced the residual stresses that formed during partial penetration welds due to the restraint on the root side of the weld.
Citations
Citation:
Z-11. Yuanjing Zhu, Hui-Ping Wang, Yaqi Wang, Yu Hao, Blair E. Carlson, Fenggui Lu, “Formation mechanism of liquid metal embrittlement in laser lap welding of zinc-coated GEN3 steels”, Materials Science and Engineering: A, Volume 800, 2021, 140229, ISSN 0921-5093, doi.org/10.1016/j.msea.2020.140229.
Joining, Laser Welding, Press Hardened Steels
This studyR-25, conducted by the Centre for Advanced Materials Joining, Department of Mechanical & Mechatronics Engineering, University of Waterloo, and ArcelorMittal Global Research, utilized 2mm thick 22MnB5 steel with three different coating thicknesses, given in Table 1. The fiber laser welder used 0.3mm core diameter, 0.6mm spot size, and 200mm beam focal length. The trials were done with a 25° head angle with no shielding gas but high pressure air was applied to protect optics. Welding passes were performed using 3-6kW power increasing by 1 kW and 8-22m/min welding speed increasing by 4m/min. Compared to the base metal composition of mostly ferrite with colonies of pearlite, laser welding created complete martensitic composition in the FZ and fully austenized HAZ while the ICHAZ contained martensite in the intergranular regions where austenization occurred.
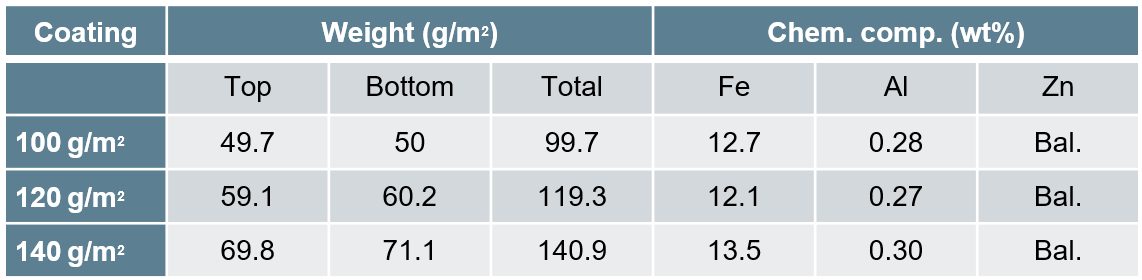
Table 1: Galvanneal Coatings.R-25
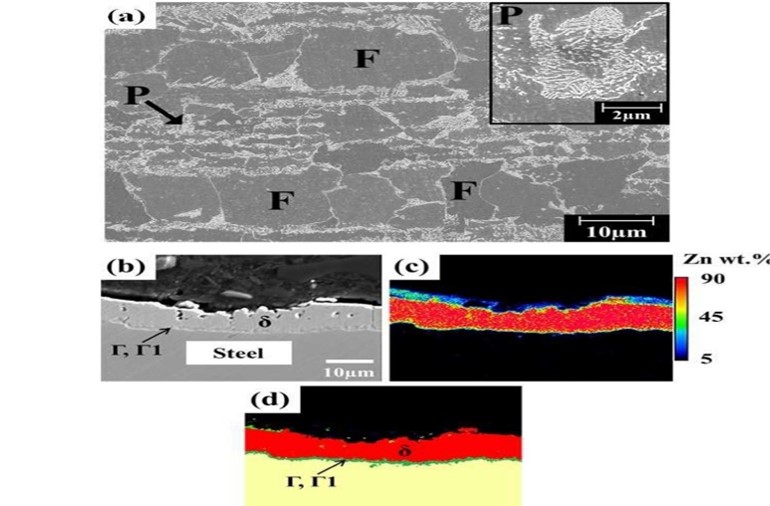
Figure 1: Base metal microstructure(P=pearlite, F=ferrite, Γ=Fe3Zn10, Γ1=Fe5Zn21 and δ=FeZn10).R-25
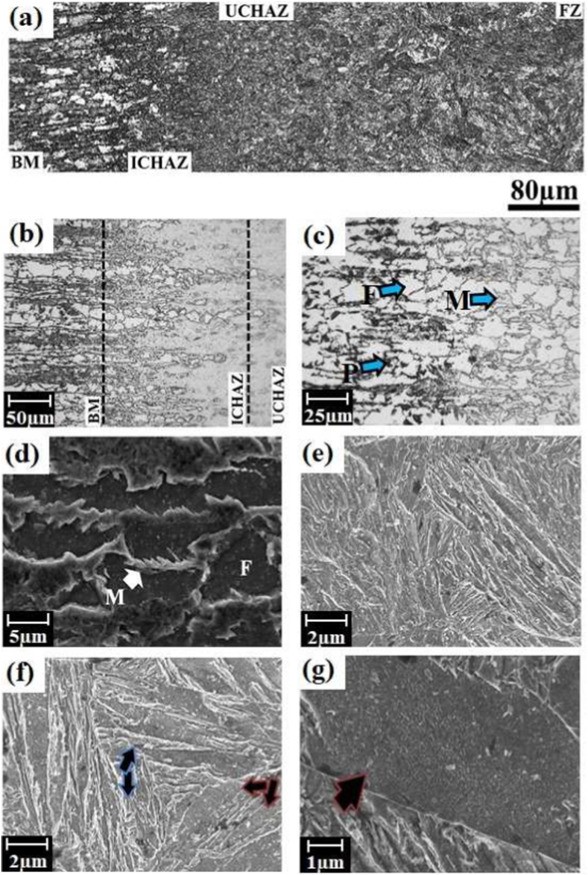
Figure 2: Welded microstructure — (a) overall view, (b) HAZ, (c) ICHAZ at low and (d) high magnifications, (e) UCHAZ (f) FZ, and (g) coarse-lath martensitic structure (where M; martensite, P: pearlite, F: ferrite).R-25
Given the lower boiling temperature of Zn at 900 °C as compared to Fe, the interaction of the laser with the Zn plasma that forms upon welding affects energy deliverance and depth of penetration. Lower coating weight of (100 g/m2) resulted in a larger process window as compared to (140 g/m2). Increased coating weight will reduce process window and need higher power and lower speeds in order to achieved proper penetration as shown in Figure 3 and Figure 4. Depth of penetration due to varying welding parameters was developed:
d=(H-8.6+0.08C)/(0.09C-4.8)
[d= depth of penetration(mm), H= heat input per unit thickness(J/mm2), C= coating weight(g/m2)]
Given the reduction in power deliverance, with an increase in coating weight there will be an expected drop in FZ and HAZ width. Regardless of the coating thickness, the HAZ maintained its hardness between BM and FZ. No direct correlation between coating thickness and YS, UTS, and elongation to fracture levels were observed. This is mainly due to the failure location being in the BM.
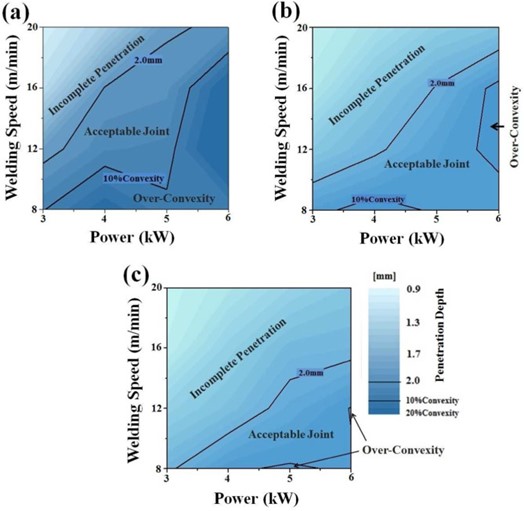
Figure 3: Process map of the welding window at coating weight of (a) 100 g/m2, (b) 120 g/m2, and (c) 140 g/m2.R-25
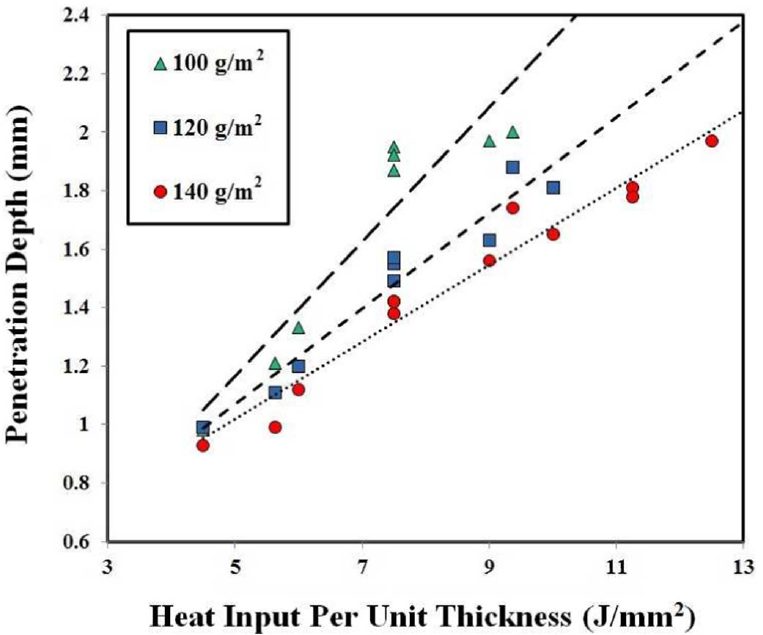
Figure 4: Heat input per unit thickness vs depth of penetration.R-25
Citations
Citation:
R-25. M.H. Razmpoosh, A. Macwan, E. Biro, Y. Zhou, “Effect of coating weight on fiber laser welding of Galvanneal-coated 22MnB5 press hardening steel”, Surface and Coatings Technology, Volume 337, 2018, Pages 536-543, ISSN 0257-8972, doi.org/10.1016/j.surfcoat.2018.01.053.
Joining Dissimilar Materials, Laser Welding
Given the use of many different metals in the Body in White construction, it is important to understand the effects of dissimilar welding AHSS. Researchers at Indian Institute of Technology Madras in Chennai, India and Centre of Laser Processing of Materials in Hyderabad, India developed tests to study the resulting microstructure from laser welding 2.5 mm thick DP600 steel to 3 mm thick AA6061 aluminium alloy using a laser beam diameter of 1.5 mm.I-1 They discovered a softening in the steel HAZ due to a tempering effect and an increase in hardness in the aluminum HAZ due to the presence of aluminium intermetallic phases present. Maximum shear strength was observed when the thickness of intermetallics was reduced to 8-11 microns. They concluded that best quality welds were made under power densities and interaction times of 1.98kW/mm2, 0.15s and 2.26 kW/mm2, 0.187s.
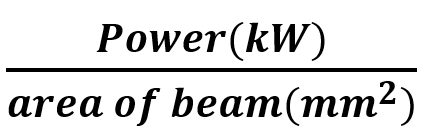
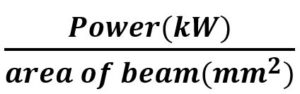
The laser power was varied from 3 kW to 4.5 kW and the scanning speed of 8 mm/s, 10 mm/s, and 12 mm/s. Power density and interaction time were two parameters they used to compare trials where:
| Power density (Pd) = |
|
and
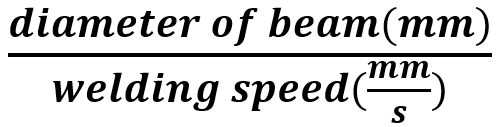
| interaction time (It) = |
 |
The resulting welding parameters are shown in Table 1 below. Figure 1 shows the microstructure of the fusion boundary and HAZ on the DP600 side of the welded joint. Figure 2 shows the microstructure of the weld interface on the AA 6061 side. Figure 3 displays the hardness data with (a) representing 3.5 kW and 10 mm/s, (b) representing 3.5 kW and 8 mm/s, and (c) representing 4 kW and 8 mm/s. Figure 4 represents the Shear Stress-Strain of the welds given different IMC thickness.
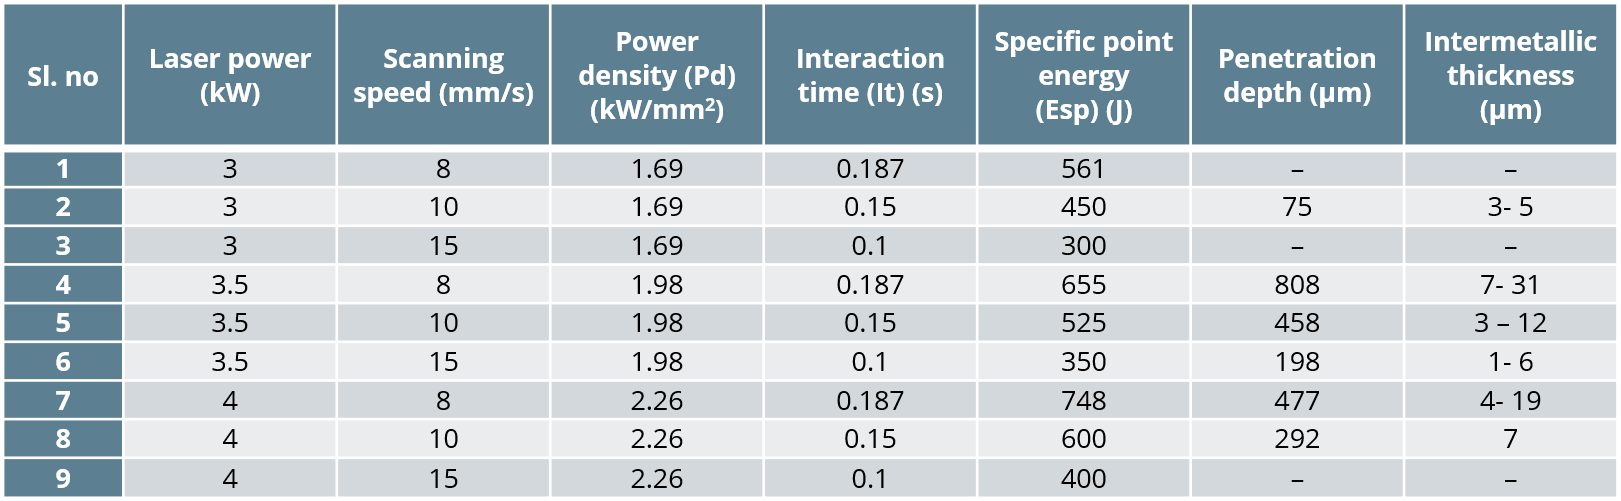
Table 1: Welding Parameters.I-1
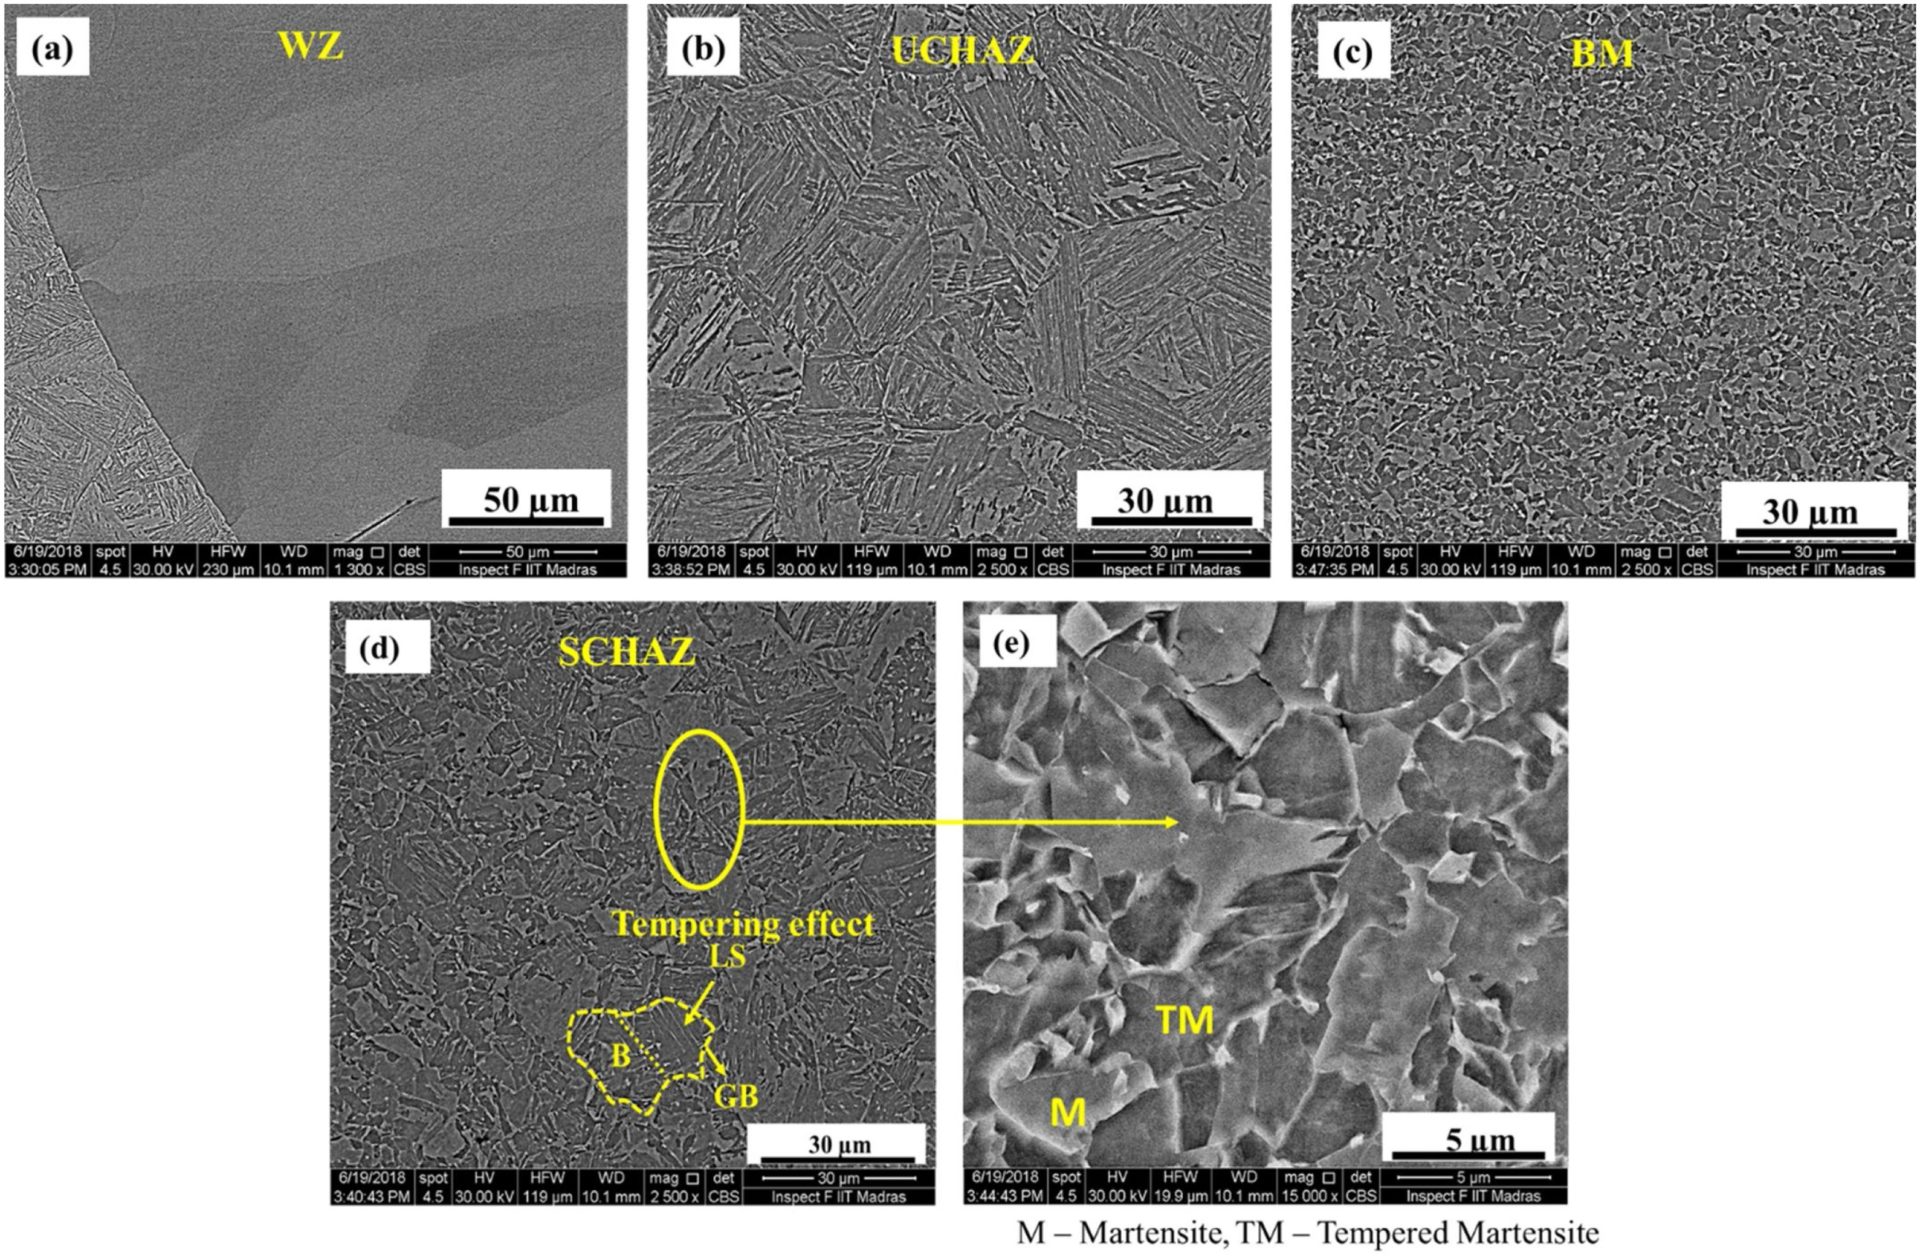
Figure 1: Weld Metal, DP 600 Base Metal and HAZ microstructure.I-1
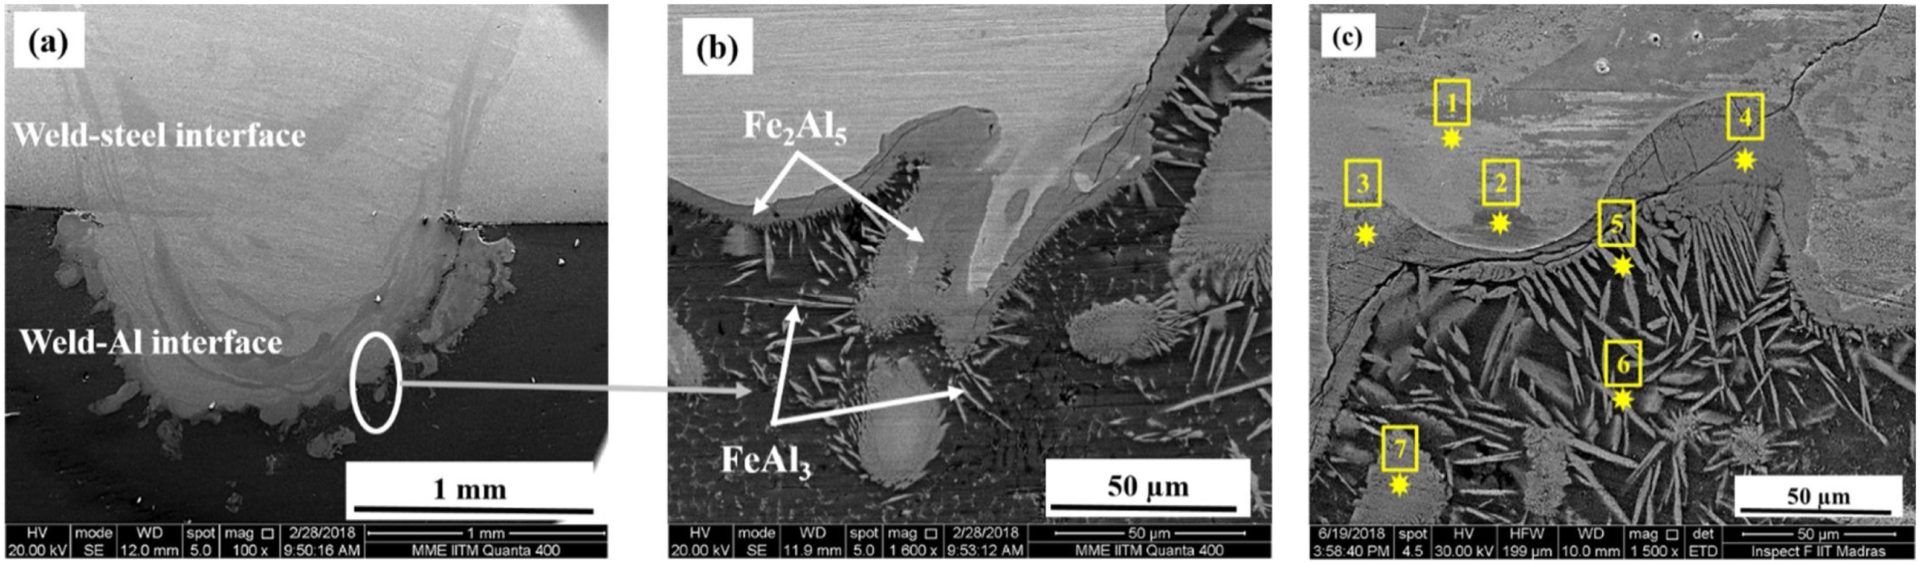
Figure 2: Fe-Al interface microstructure.I-1
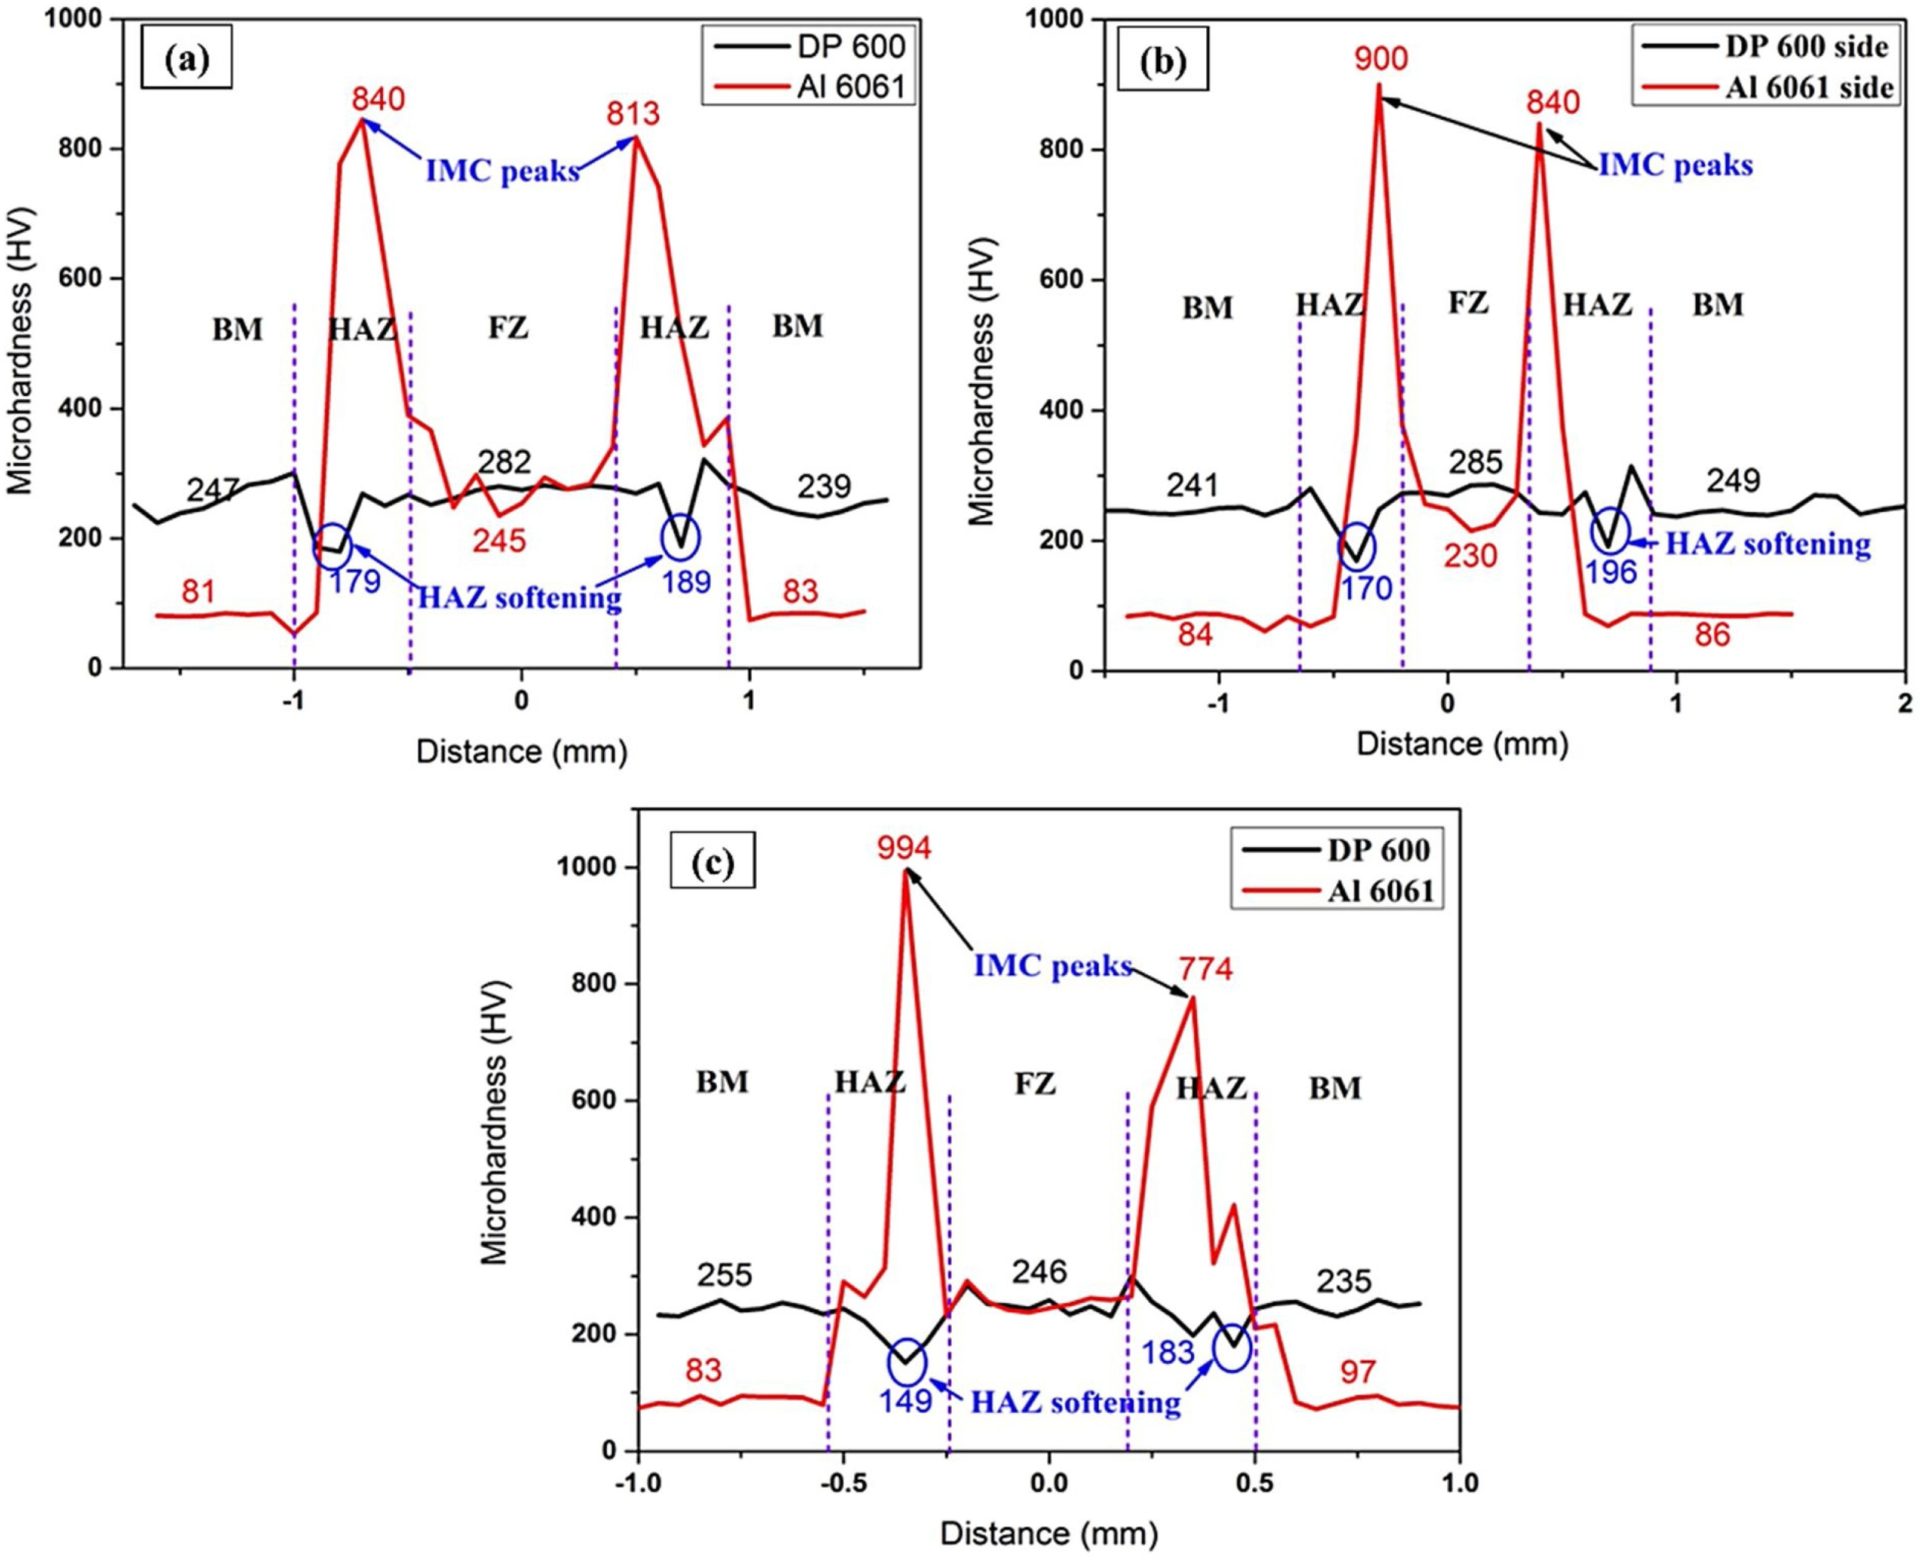
Figure 3: Microhardness Plot.I-1
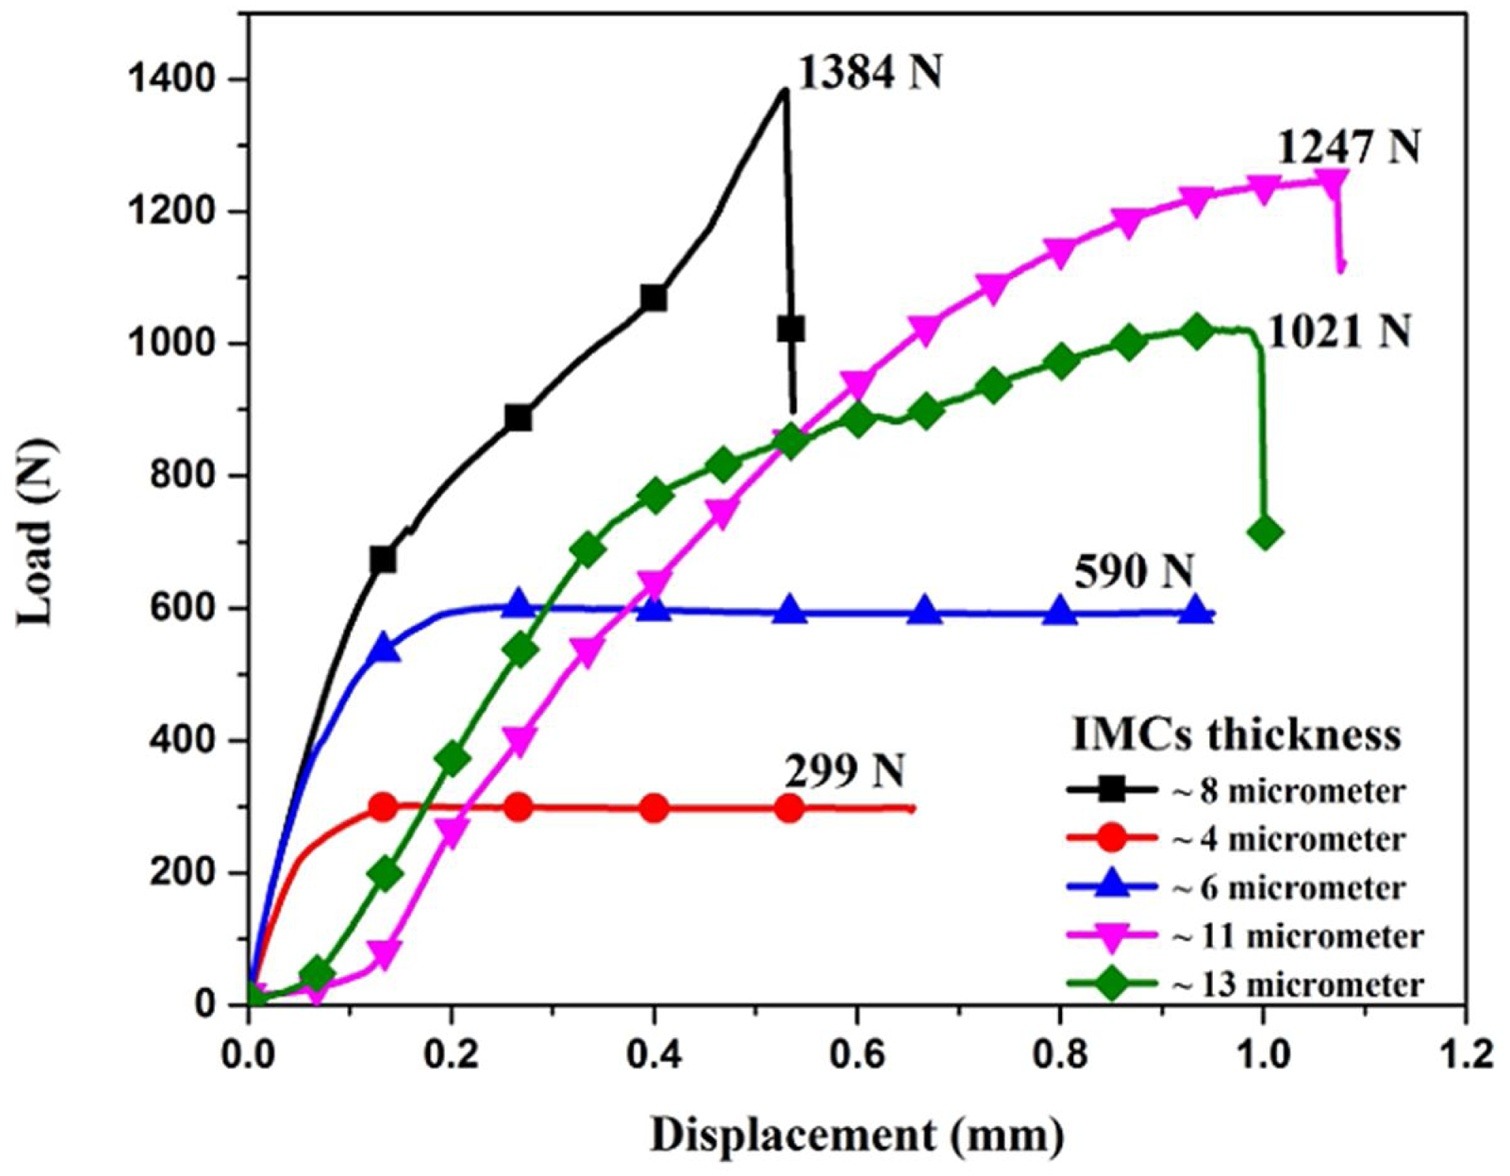
Figure 4: Load vs. Displacement.I-1