![Elastic Modulus]()
Mechanical Properties
Elastic Modulus (Young’s Modulus)
When a punch initially contacts a sheet metal blank, the forces produced move the sheet metal atoms away from their neutral state and the blank begins to deform. At the atomic level, these forces are called elastic stresses and the deformation is called elastic strain. Forces within the atomic cell are extremely strong: high values of elastic stress results in only small magnitudes of elastic strain. If the force is removed while causing only elastic strain, atoms return to their original lattice position, with no permanent or plastic deformation. The stresses and strains are now at zero.
A stress-strain curve plots stress on the vertical axis, while strain is shown on the horizontal axis (see Figure 2 in Mechanical Properties). At the beginning of this curve, all metals have a characteristic linear relationship between stress and strain. In this linear region, the slope of elastic stress plotted against elastic strain is called the Elastic Modulus or Young’s Modulus or the Modulus of Elasticity, and is typically abbreviated as E. There is a proportional relationship between stress and strain in this section of the stress-strain curve; the strain becomes non-proportional with the onset of plastic (permanent) deformation (see Figure 1).

Figure 1: The Elastic Modulus is the Slope of the Stress-Strain Curve before plastic deformation begins.
The slope of the modulus line depends on the atomic structure of the metal. Most steels have an atomic unit cell of nine iron atoms – one on each corner of the cube and one in the center of the cube. This is described as a Body Centered Cubic (BCC) structure. The common value for the slope of steel is 210 GPa (30 million psi). In contrast, aluminum and many other non-ferrous metals have 14 atoms as part of the atomic unit cell – one on each corner of the cube and one on each face of the cube. This is referred to as a Face Centered Cubic (FCC) atomic structure. Many aluminum alloys have an elastic modulus of approximately 70 GPa (10 million psi).
Under full press load at bottom dead center, the deformed panel shape is the result of the combination of elastic stress and strain and plastic stress and strain. Removing the forming forces allows the elastic stress and strain to return to zero. The permanent deformation of the sheet metal blank is the formed part coming out of the press, with the release of the elastic stress and strain being the root cause of the detrimental shape phenomenon known as springback. Minimizing or eliminating springback is critical to achieve consistent stamping shape and dimensions.
Depending on panel and process design, some elastic stresses may not be eliminated when the draw panel is removed from the draw press. The elastic stress remaining in the stamping is called residual stress or trapped stress. Any additional change to the stamped panel condition (like trimming, hole punching, bracket welding, reshaping, or other plastic deformation) may change the amount and distribution of residual stresses and therefore potentially change the stamping shape and dimensions.
The amount of springback is inversely proportional to the modulus of elasticity. Therefore, for the same yield stress, steel with three times the modulus of aluminum will have one-third the amount of springback.
Elastic Modulus Variation and Degradation
Analysts often treat the Elastic Modulus as a constant. However, Elastic Modulus varies as a function of orientation relative to the rolling direction (Figure 2). Complicating matters is that this effect changes based on the selected metal grade.

Figure 2: Modulus of Elasticity as a Function of Orientation for Several Grades (Drawing Steel, DP 590, DP 980, DP 1180, and MS 1700) D-11
It is well known that the Bauschinger Effect leads to changes in the Elastic Modulus, and therefore impacts springback. Elastic Modulus determined in the loading portion of the stress-strain curve differs from that determined in the unloading portion. In addition, increasing prestrain lowers the Elastic Modulus, with significant implications for forming and springback simulation accuracy. In DP780, 11% strain resulted in a 28% decrease in the Elastic Modulus, as shown in Figure 3.K-7

Figure 3: Variation of the loading and unloading apparent modulus with strain for DP780K-7
Another study documented the modulus degradation for many steel grades, including mild steel, conventional high strength steels, and several AHSS products.W-10 Data in some of the grades is limited to small plastic strains, since valid data can be obtained from uniaxial tensile testing only through uniform elongation.
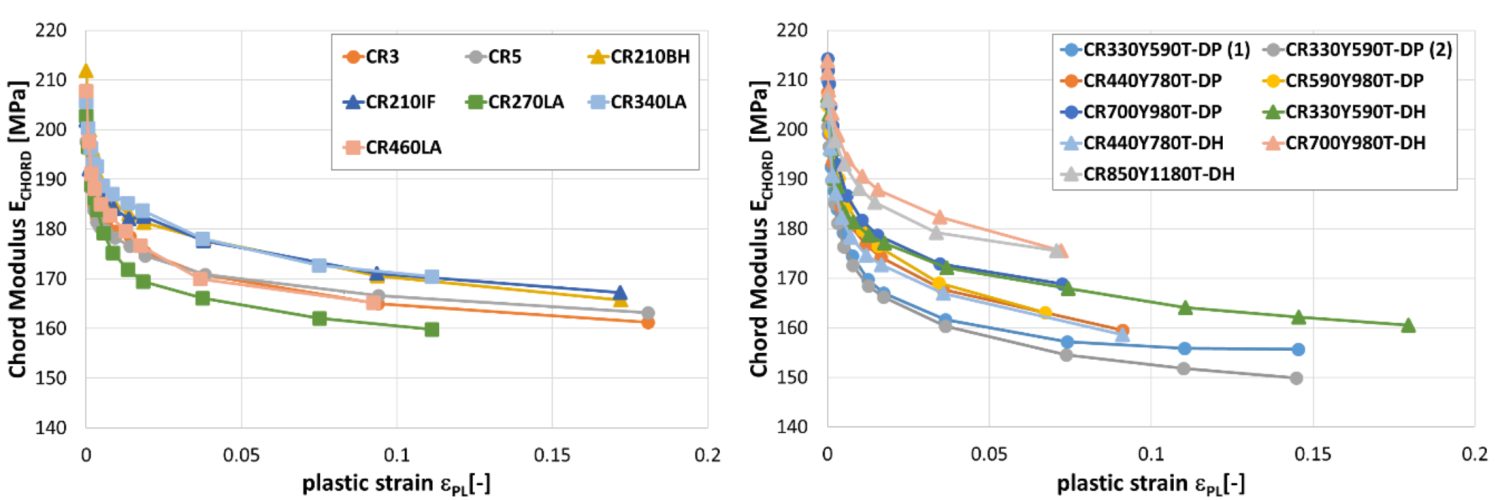
Reduction in chord modulus for mild steels and conventional high strength steels (left) and for DP and DH steels (right).W-10
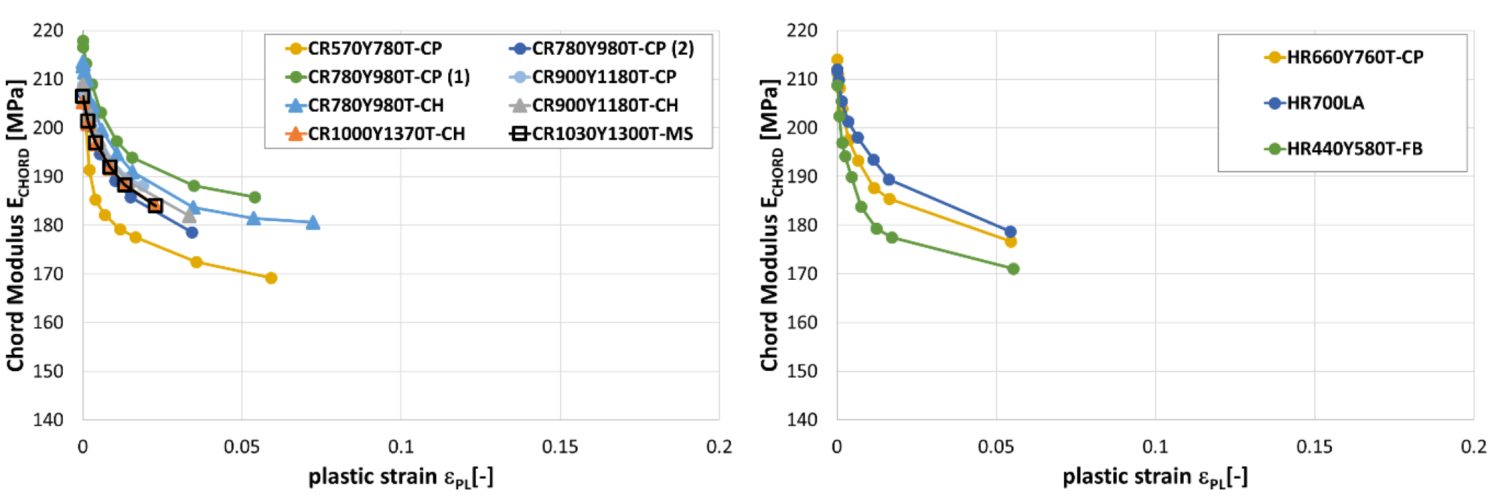
Reduction in chord modulus for CP, CH and MS steels (left) and for a selected of hot rolled steels (right).W-10
![Elastic Modulus]()
Testing and Characterization
topofpage
Tensile testing characterizes the forming and structural behavior of sheet metals. The test involves loading a sample with a well-defined shape along the axis in tension, generally to fracture, and recording the resultant load and displacement to calculate several mechanical properties. Global standardsI-7, A-24, D-19, J-15 prescribe the conditions under which tests must occur.
Sample Size and Shape
Full-size samples for tensile testing of metal sheets have a rectangular section at the edges for gripping by the test machine. Reducing the width in the central area promotes fracture in the monitored region. These geometrical features result in a sample shape which resembles a dogbone, leading to a descriptive term applied to test samples.
Dimensions of the dogbone samples are associated with tensile test standard from which they apply. ISO I, II, and III (described in Citation I-7) corresponds to the ASTMA-24, DIND-19, and JISJ-15 shapes, respectively. Figure 1 shows the dogbone shapes, highlighting the critical dimensions of width and gauge length. Refer to the Test Standards for other dimensions, tolerances, and other requirements.

Figure 1: Full-size tensile sample shapes for ISO I (ASTM), ISO II (DIN), and ISO III (JIS) standards.I-7, A-24, D-19, J-15
Significant differences exist in the width and gauge length of these tensile bar shapes. Although the ASTM and JIS bars have similar gauge length, the width of the JIS bar is twice that the ASTM bar. The ASTM and DIN bars have a 4:1 ratio of gauge length to width, where the JIS bar has a 2:1 ratio.
These shape differences mean that the calculated elongation changes depending on the test-sample standard used, even when testing identical material. With the combination of the shortest gauge length and widest sample, elongation from JIS bars typically are higher than what would be generated from the other shapes.
Yield strength and tensile strength are not a function of the shape of the tensile bar. Strength is defined as the load divided by the cross-sectional area. Even though each of the bars specify a different sample width (and therefore different cross-section), the load is normalized by this value, which negates differences from sample shape.
Shearing or punching during sample preparation may work-harden the edges of the tensile bar, which may lead to generating an inaccurate representation of the mechanical properties of the sheet metal. Test Standards require subsequent machining or other methods to remove edge damage created during sample preparation. Milling or grinding the dogbone samples minimizes the effects sample preparation may have on the results.
Tensile Test Procedure
The gauge length is the reference length used in the elongation calculations. Depending on the test standard, the gauge length is either 2 inches, 80 mm, or 50 mm. Multiplying the width and thickness within the gauge length determines the initial cross-sectional area before testing.
Grips tightly clamp the edges of the sample at opposite ends. As the test progresses, the grips move away from each other at a prescribed rate or in response to the restraining load. A load cell within the grips or load frame monitors force. An extensometer tracks displacement within the gauge length. Samples are typically tested until fracture.
During the tensile test, the sample width and thickness shrink as the length of the test sample increases. However, these dimensional changes are not considered in determining the engineering stress, which is determined by dividing the load at any time during the test by the starting cross-sectional area. Engineering strain is the increase in length within the gauge length relative to the starting gauge length. (Incorporating the dimensional changes occurring during testing requires calculating true stress and strain. The differences between engineering and true stress/strain are covered elsewhere (hyperlink to 2.3.2.1-Engineering/True)
A graph showing stress on the vertical axis and strain on the horizontal axis is the familiar engineering stress-strain curve, Figure 2. From the stress-strain curve, numerous parameters important for sheet metal forming appear, including:

Figure 2: Engineering stress-strain curve from which mechanical properties are derived.
Influence of Test Speed
Conventional tensile testing is done at strain rates slow enough to be called “quasi-static.” These rates are several orders of magnitude slower than the deformation rates during stamping, which itself is several orders of magnitude slower than what is experienced during a crash event.
Stress-strain curves change with test speed, typically getting stronger as the speed increases. The magnitude of these changes varies with grade. Significant challenges exist when attempting to characterize the tensile response at higher strain rates. Improved equipment and data collection capabilities are among the required upgrades.
Influence of Tensile Test Equipment
Advanced High-Strength Steels (AHSS) may challenge older test equipment. The load and displacement response must reflect only the contributions of the sheet metal, and not be influenced by the load frame and other testing equipment. In much the same way that insufficiently stiff press crowns deflect when stamping AHSS parts, tensile test load frames may similarly deflect, resulting in inaccuracies in the load-displacement measurements.
Grip strength also becomes critical when testing AHSS samples. The high strength of the metal sheets requires more grip pressure to prevent sample slippage through the grips. Pneumatic grips and even some mechanical grips may not generate the necessary pressure. Hydraulically actuated grips may be necessary as the strength increases.
Back to the Top