Joining Dissimilar Materials, Resistance Welding Steel to Aluminium
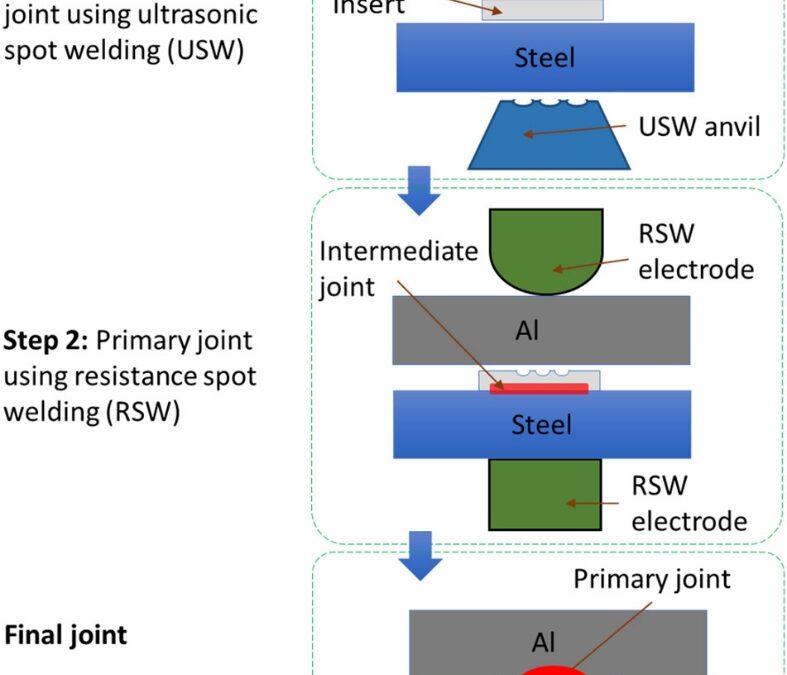
Recently research at the Ohio State University is developing methods that combine the benefits of ultrasonic welding and resistance spot welding. Y. Lu and co-workersL-10 developed the ultrasonic plus resistance spot welding process (U+RSW). In this process thin aluminium sheet was joined with steel sheet via ultrasonic welding, followed by RSW between the aluminium side of previously sheet and aluminium sheet as shown in Figure 1. In this study they used 1-mm-thick AA6061-T6 to 0.9-mm-thick AISI 1008 steel with 0.4-mm-thick AA6061-T6 as the insert.
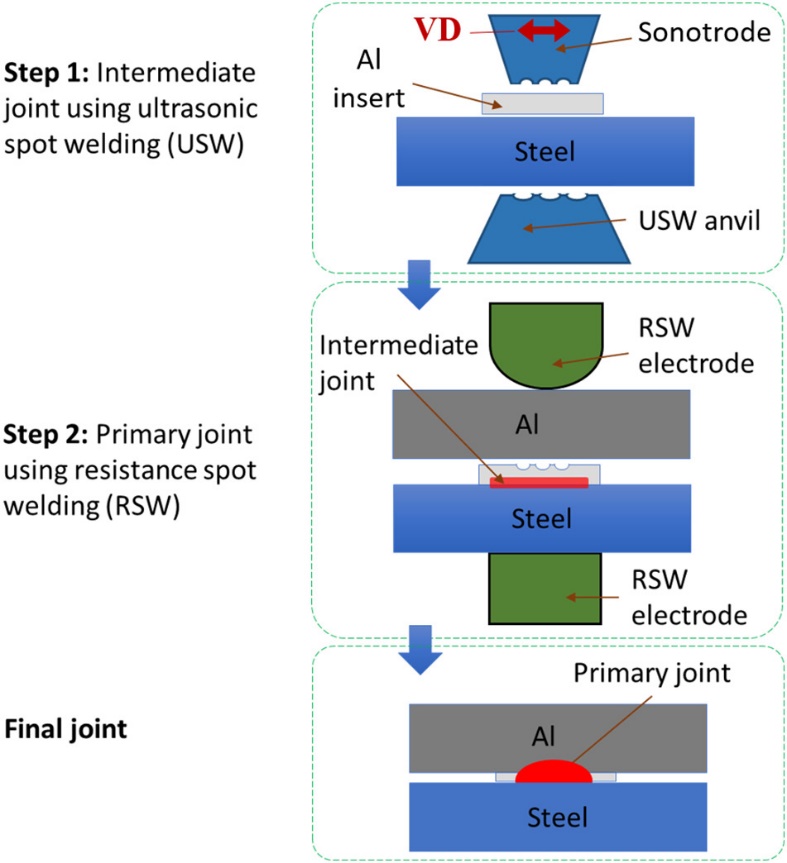
Figure 1: Schematic diagram of U + RSW process. VD is the sonotrode’s vibration direction for USW of intermediate joint.L-10
The U+RSW method showed improved mechanical properties (Figure 2), tensile shear strength and energy absorbed prior to failure. It has shown a relatively thin intermetallic layer.
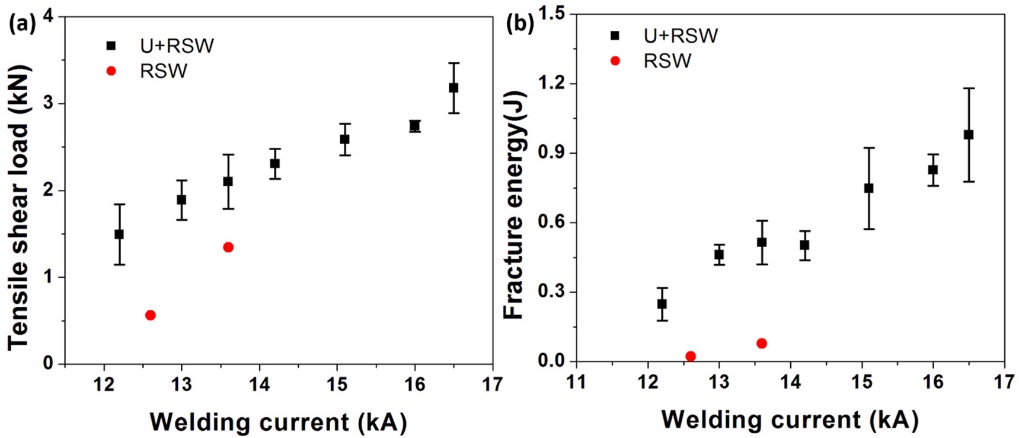
Figure 2: Effect of welding current on tensile shear strength and fracture energy of welded dissimilar joints of AA6061 to AISI 1008 steel. The welding time and the electrode force for RSW were kept constant at 0.083 s and 3.56 kN, respectively.L-10
Another research group have developed ultrasonic resistance welding process (URW), that apply in situ ultrasonic waves during the resistance spot welding process.S-17 The schematics of the process is shown in the Figure 3. Al-6061T6 and electrogalvanized TRIP 780 with dimensions of 70Lx 25Wx 1.6T mm3 and 70Lx 25Wx 1.3T mm3 respectively were used in this study.
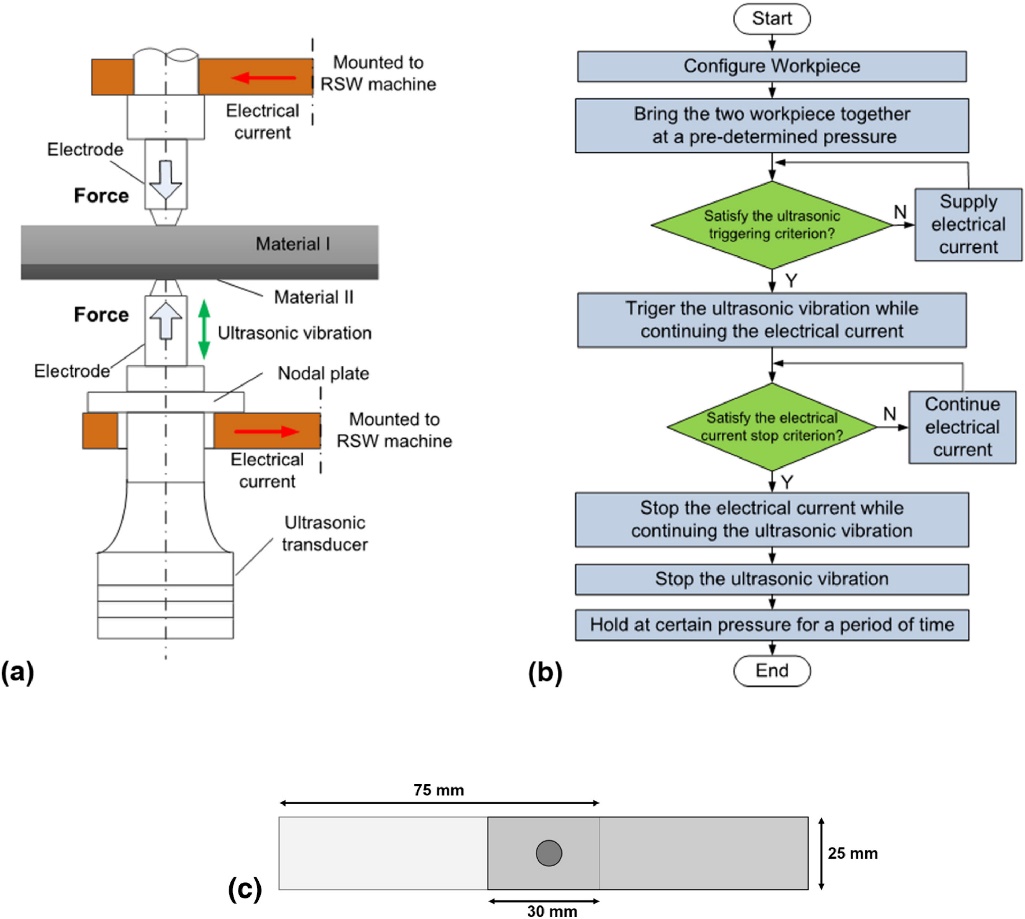
Figure 3: URW Setup (a) Schematic illustration; (b) Flowchart of the URW process.S-17
The URW process have shown improved mechanical properties and defect free interface compared to the RSW process. In situ ultrasonic vibration facilitated the breakdown of the surface oxide and contaminants, which modifies contact resistance and heat generation rate accordingly. If melting occurs, ultrasonic vibration promoted wetting of the molten aluminium over the steel interface and resulted in the formation of defect-free, fully bonded interface as shown in Figure 4. Figure 5 compares the mechanical properties between the RSW & URW process. Comparing URW with traditional RSW, up to 300% increase in strength and more than 150% increase in displacement to failure is reported. SEM images of the fractured surface revealed that ultrasonic waves eliminated the eggcrate morphology generally observed in the RSW welds fractured surface, which is a typical representative of solidification cracking.
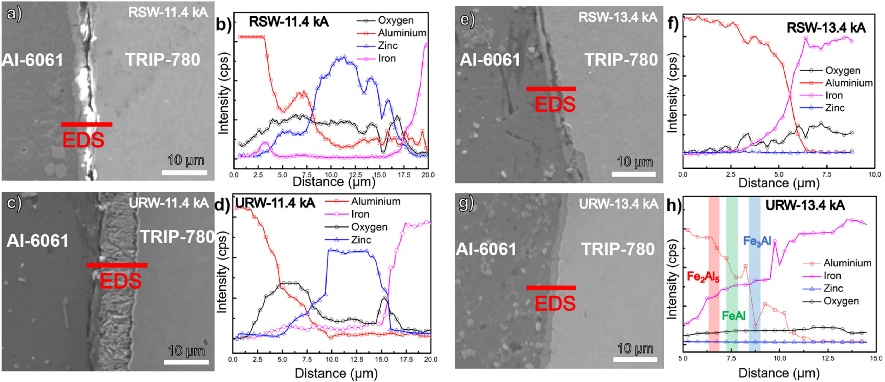
Figure 4: EDS line Scan of Al-6061 & TRIP 780 across interface for RSW at 11.4 kA (a-b) & at 13.4 kA (e-f) and for URW at 11.4 kA (c-d) & at 13.4 kA (g-h).S-17
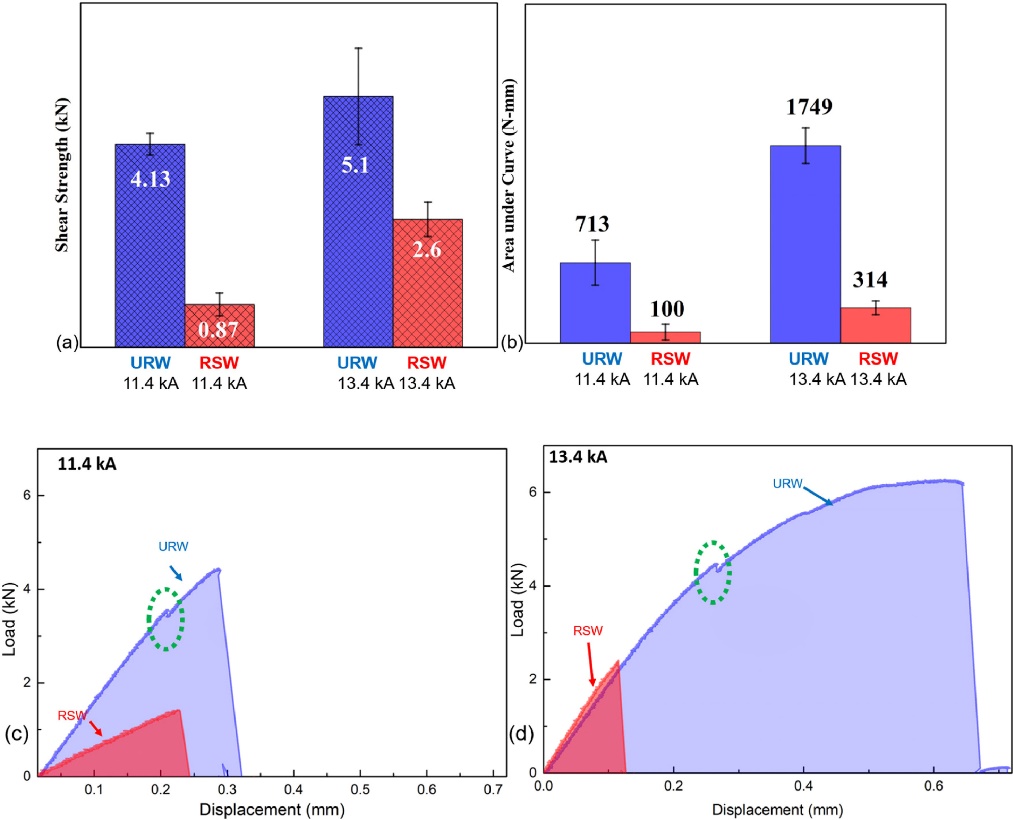
Figure 5: Tensile test results (a) Joint shear strength from 11.4 kA (30 cycles) & 13.4 kA (20 cycles); (b) Energy absorption calculated via area under load-displacement curve for 11.4 kA (30 cycles) & 13.4 kA (20 cycles); (c-d) load-displacement curve for 11.4.S-17
Joining Dissimilar Materials, Resistance Welding Steel to Aluminium
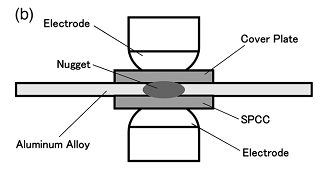
In order to reduce welding current and improve heat balance during resistance spot welding of aluminium alloy to steel, Qiu et al.Q-1, Q-2, Q-3, Q-4, Q-5 has investigated resistance spot welding of Aluminium/Steel with a cover plate on the aluminium alloy side. A 1 mm A5052 sheet and 1 mm cold-rolled steel (SPCC) sheet were resistance spot welded with a steel cover plate. The schematic diagram of the process is shown in Figure 1. The IMC layer composed of a tongue-like morphology of Fe2Al5 on SPCC side and needle-like morphology of FeAl3 on A5052 side.Q-1 With welding current of 9 kA, thickness of IMCs is higher than 1.5 µm at the center of the nugget and the thickness of IMCs gradually decrease with distance from the center and become discontinuous at the peripheral region (Figure 2). Peak load of cross-tension strength can be 0.77 kN with the welding current of 12 kA. A crack propagated at the peripheral of A5052 and through the reaction layer. Thus IMCs deteriorate the cross-tension strength as the IMC is thicker than 1.5 µm.Q-2 The tensile strength of resistance spot welded Aluminium/Steel was influenced by the fraction of discontinuous IMCs layer, and a strong Aluminium/Steel spot weld can be obtained with increasing discontinuous reaction layer fraction.Q-4
Figure 1: Schematic diagram showing resistance spot welding with a cover plate.Q-2
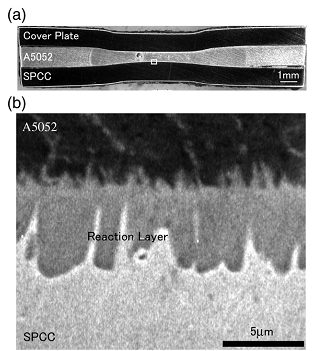
Figure 2: The cross-sectional macrostructure of spot weld joint (a) and SEM images of Al/steel interface.Q-2
Resistance spot welding of 1mm A5052 to 1mm SUS 304 with a cover plate was investigated and compared to RSW of A5052/SPCC.Q-3 At all welding currents, the IMC layer is thinner at the A5052/SUS304 interface than at the A5052/SPCC interface, since Cr in SUS304 can reduce the growth rate of Fe2Al5 (Figure 3). A maximum tensile shear strength can be 6.5 kN for A5052/SUS304 which is comparable to A5052/A5052, which is higher than that of A5052/SPCC (4.68 kN) (Figure 4). However, interfacial fraction occurs at Al/steel interfaces in both cases.
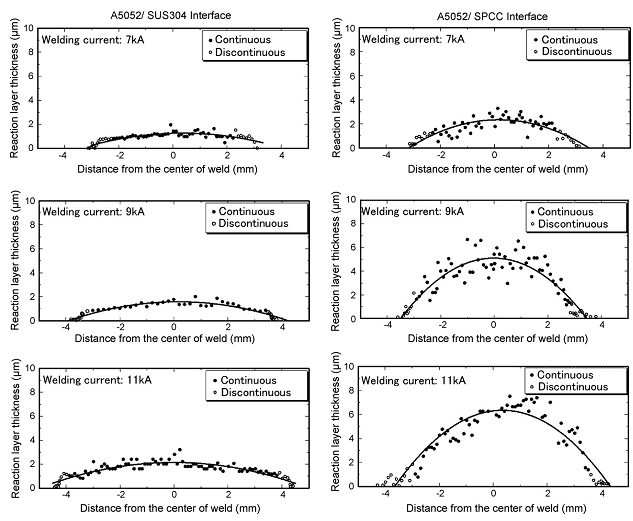
Figure 3: Distribution of intermetallic compound layer thickness at Al/steel spot weld interface.Q-3
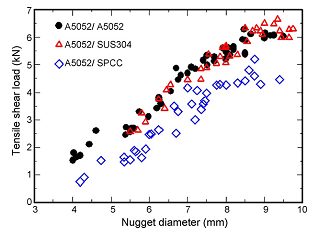
Figure 4: Relationship between nugget diameter and tensile shear strength.Q-3
Joining Dissimilar Materials
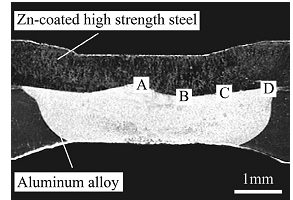
Figure 1 shows a typical cross-section of a resistance spot weld (RSW) joint of 1 mm-thick H220 Zn-coated High-Strength Steel and 1.5 mm-thick 6008-T66 aluminium alloy. Based on resistance spot welding process simulation by ANSYS, the Al/Steel interface temperature is 1120 oC with welding current of 9 kA and welding time of 300 ms. The high interfacial temperature at the Al/Steel interface melts Al alloys and liquid Al alloy wet and spread on the solid steel surface which creates a special brazed joint.
Figure 1: Cross-sectional macrostructure of typical Al/Steel resistance spot welds.Z-4
The interaction of liquid Al alloy with solid steel results in the formation of Fe-Al intermetallics (IMCs), which are mainly composed of lath-like/tongue-like shaped η-Fe2Al5 on steel side and coarse/fine needle-like shaped θ-FeAl3/Fe4Al13 on Al alloy side. For the morphology shown in Figure 2, IMCs have higher hardness compared to the Al or steel base metal, with average hardness of approximately 8.7 and 6.5 GPa for Fe2Al5 and Fe4Al13 respectively, while the average hardness of Al and steel near to the interface were 1.1 and 2.1 GPa respectively.Z-2 The distribution of IMCs at the Al/steel interface is non-uniform, with the thickest IMCs at the center of the weld and a reduced IMCs thickness observed approaching the weld periphery.
The formation and growth of IMCs at the Al/Steel interface are mainly affected by the temperature at the Al/Steel interface and reactive diffusion time. With constant welding current of 9 kA, the thickness of the IMCs increase from 2.9 µm to 13 µm as welding time increases from 100 ms to 300 ms. With constant welding time of 250 ms, a rapid increase of the IMCs from 1.5 to 5.6 µm is observed as welding current increases from 5 to 9 kA. Thus, with increasing welding time and/or welding current, IMCs thickness increase due to the higher interfacial temperature and longer reaction time of liquid Al alloy with solid steel. Resistance spot welding of A6008 andH220 Zn-coated High-Strength Steel can achieve a peak strength of 3.3 kN at welding current of 9 kN and welding time of 250 ms with interfacial fracture at the Al/steel interface, since the crack initiates at the brittle IMC compound layer (Fe2Al5) and tends to propagate along the IMC layer.Z-3
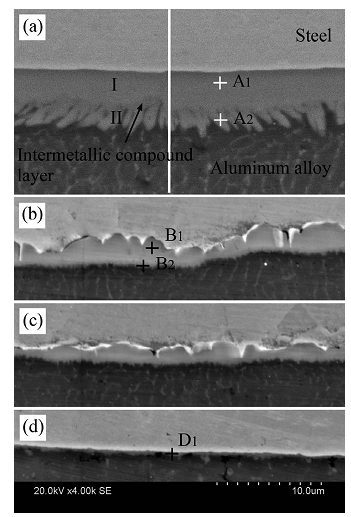
Figure 2: SEM images of Al/Steel interface regions in previous figure. (a)-(d) corresponds to region A-D respectively.Z-4
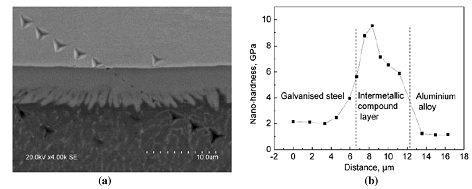
Figure 3: Nanoindentation across H22YD GI high strength steel/A6008-T66 resistance spot weld: (a) Nanoindents; (b) Nanohardness profile.Z-4
The nugget diameter, IMC compound layer thickness and mechanical properties of Al/steel weld joints can be affected by electrode morphology. For resistance spot welding of A6008-T66 and H22YD galvanized High- Strength Steel, the optimized electrodes were a planar circular electrode with a surface diameter of 10 mm on steel side and a spherical tip with a spherical diameter of 70 mm on Al side.Z-4 Compared to the conventional F type electrode used in the reference studyZ-3, a flat Al/steel interface can be obtained with larger nugget diameter and less welding defects, including shrinkage void and cracks, as shown in Figure 4. A maximum nugget size of 10 mm can be obtained with the optimized electrode morphology with a reduced intermetallic compound thickness of 4 µm (Figure 5). A peak tensile shear strength of 5.4 kN can be achieved with a nugget pull-out failure mode (Figure 6).
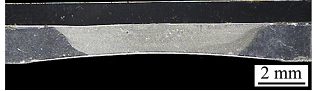
Figure 4: Cross-sectional macrostructure of resistance spot weld Al/steel joint with an electrode spherical diameter of 100 mm on Al alloy side.Z-4
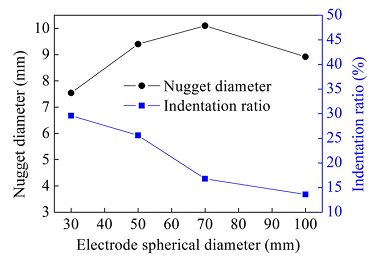
Figure 5: Effects of electrode spherical diameter on nugget diameter and indentation ratio of resistance spot weld joints.Z-4
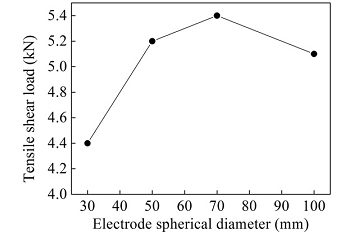
Figure 6: Effects of electrode spherical diameter on tensile shear load of resistance spot weld joints.Z-4
Sigler et al., from General Motors, have shown considerable improvement in the Al/Steel RSW joints that includes multi step direct RSW welding and multi ring, domed-shaped electrodes.S-15, W-14 Welds were carried out using a medium frequency direct current (MFDC) RSW machine via two current pulses, i.e. pre heat pulse of 5 kA and main pulse of 13 kA, 14 kA and 15 kA at various times. Their methodology has shown an importance in the IMC layer thickness and aluminium nugget. Figure 7(a) shows the cross sections of the welds made at the various parameters. More indentation and larger Al nugget diameter are seen at higher times. Figure 7(b) shows that the hardness mapping and the softened region on the both sides of the nugget is observed due to excessive recrystallization. Figure 7(c) shows that the greater the aluminium nugget diameter in the center, the less is the aluminium thickness in the center. Also the IMC layer, as shown in Figure 12(d) increases with the longer weld times. Overall, it was found that the larger aluminium nugget diameter and thicker IMC layer is detrimental for Al/Steel joint integrity.
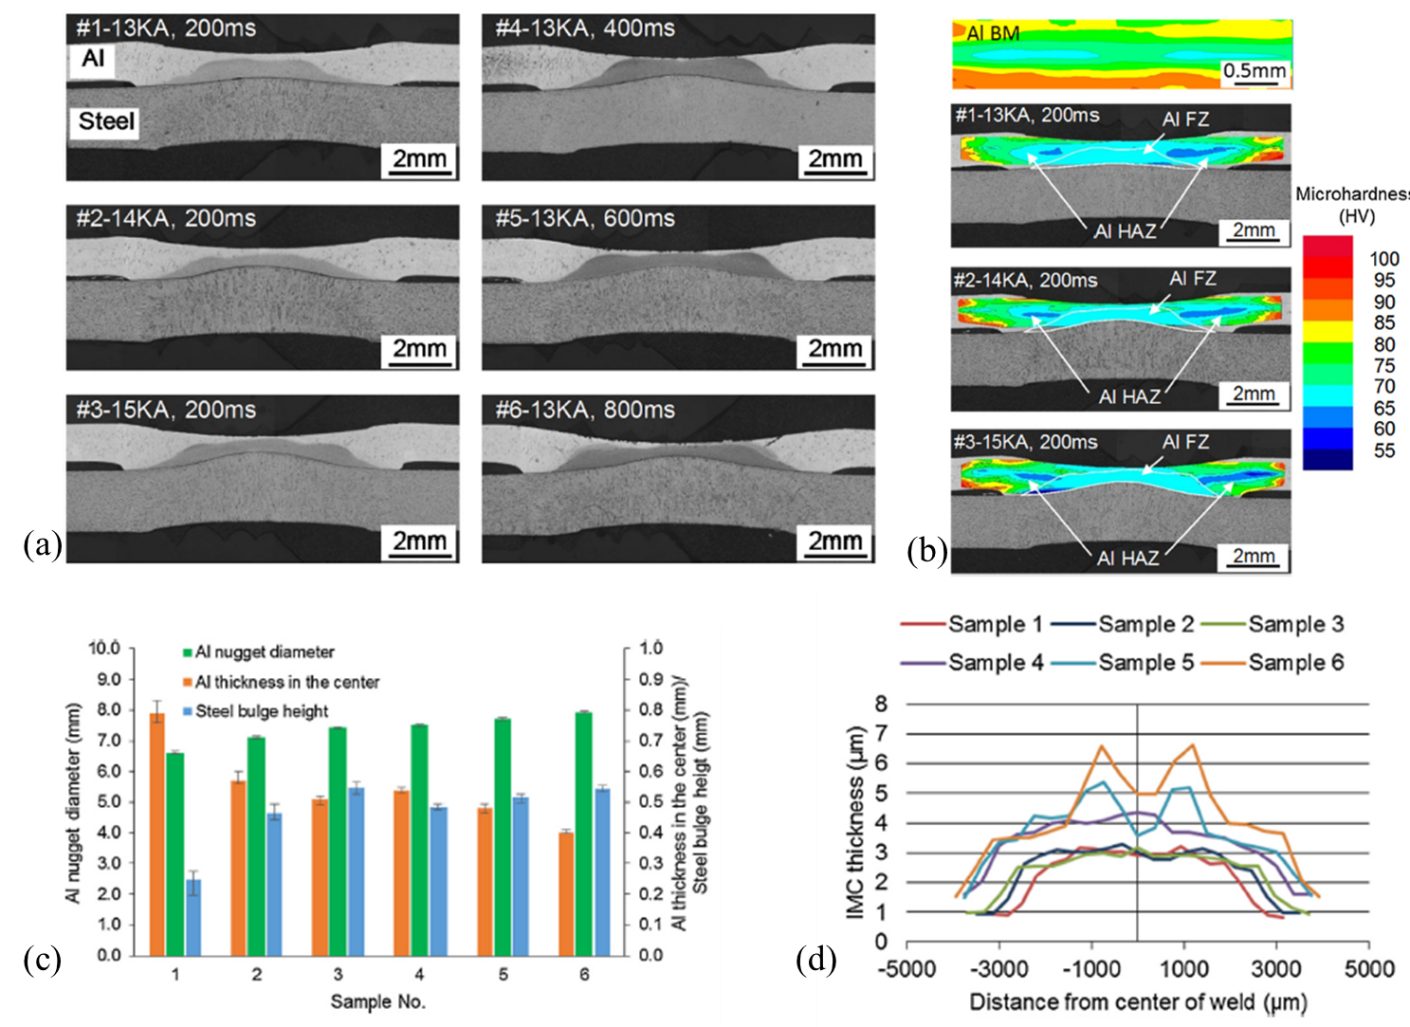
Figure 7: (a). Cross section micrographs of Al/steel RSWs generated by different welding schedules. ,(b) Microhardness contours of Al BM and Al sheets of Al/steel welds. ,(c) Comparison of Al/steel weld dimensions. & (d) Comparison between lap shear stress and average IMC thickness.S-15
Figure 8 shows the relationship between the IMC layer thickness and peak load failure. At 13 kA, 14 kA and 15 kA as indicated by Sample 1, Sample 2 and Sample 3, respectively, in Figure 8(a). Moreover, it is reported that the thinner IMC layer (<3 µm) resulted in bottom pullout failure. Figure 8(b) shows the governing parameters for interfacial or nugget pull out failure.
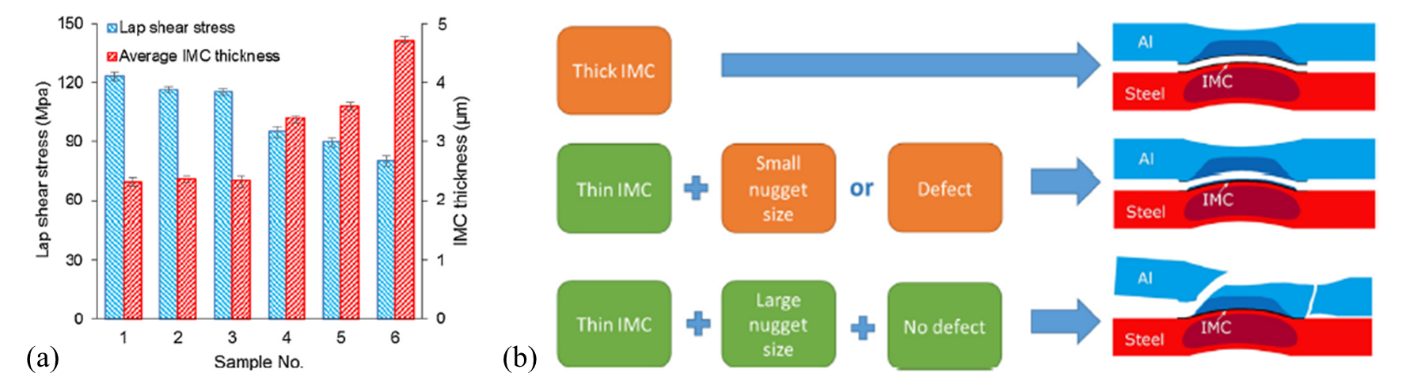
Figure 8: (a) Relationship between peak strength and IMC layer, (b) Model depicting the governing failure mode.S-15

Joining Dissimilar Materials, Resistance Welding Steel to Aluminium
Capacitive Discharge Welding (CDW) is a similar process to RSW except large amount of energy is released in relatively a short amount of time. A research group at The Ohio State University working under supervision of Dr. Menachem Kimchi and Jerry Gould from EWI has investigated the feasibility of Al/Steel joining via this process. Figure 1 shows the current waveforms at 1.3ms & 2.5 and their mechanical strength results.
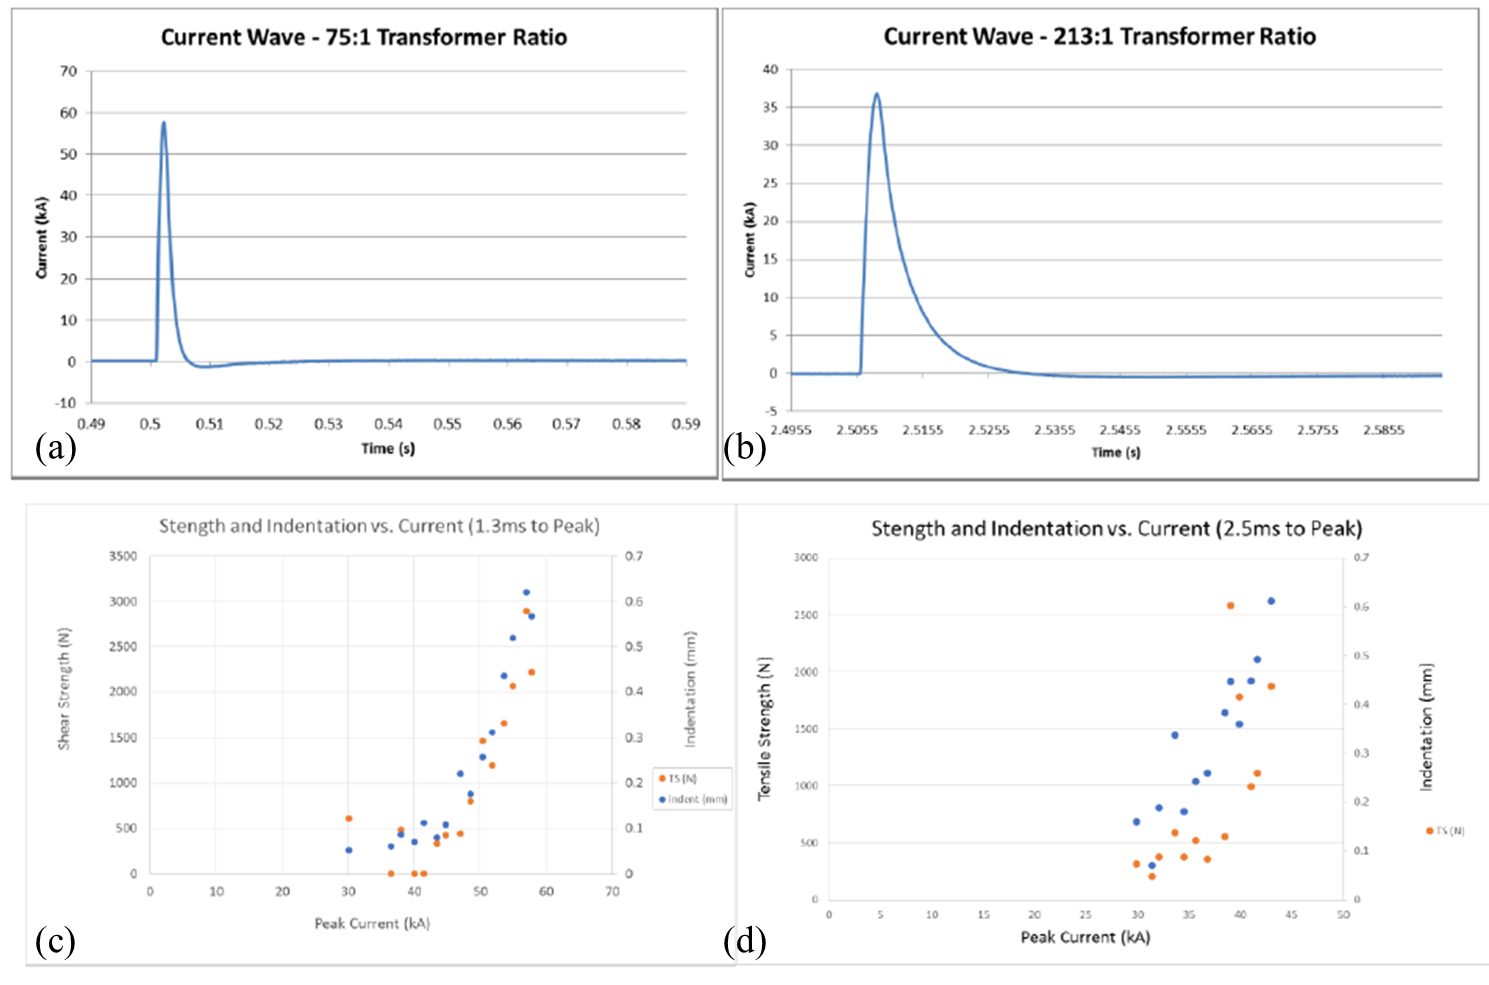
Figure 1: (a) Current waveform for 1.3ms to reach peak value, (b) Current waveform at for 2.5ms to reach peak value (c-d) Lap shear tensile strength and indentation as a function of current and time to reach peak current.
A shorter amount of time can significantly suppress the growth of the intermetallics. The group reported that higher amount of current in short duration of time could result in stronger welds. Figure 15 shows the effect of time on the growth of intermetallic (IMC) and solidification pattern. At 1.3 ms IMC layer thickness is less than 3 microns whereas at 2.5 ms the IMC layer thickness was reported greater than 3 microns. If IMC layer is less than 3 microns it results in nugget pull out failure mode whereas IMC layer of 3 microns or greater mostly result on interfacial failure.P-10
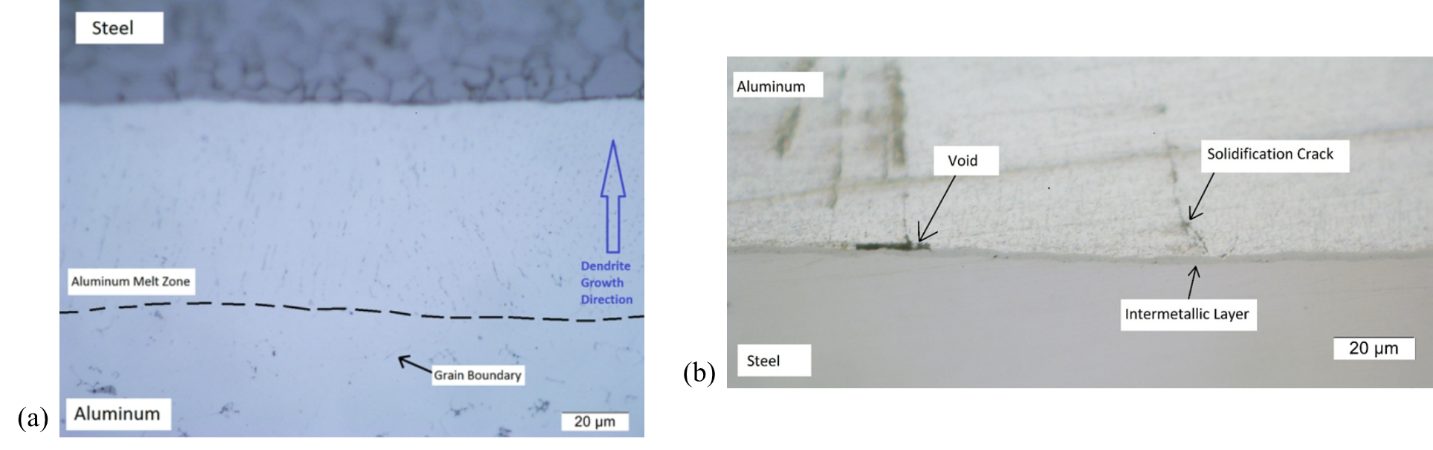
Figure 2: Effect of the ramp up time on the intermetallic layer thickness (a) 2.5ms & (b) 1.3ms.
Joining Dissimilar Materials, Resistance Welding Steel to Aluminium
Among various dissimilar material combinations, Al-steel is one of the most desirable combination. This section will address the number of fundamental issues faced during al-steel joining. Later section will discuss the current approaches to overcome these issues.
Strong and adherent aluminium surface oxide layer needs to be removed for a sound joint between aluminium and steel. The presence of this oxide layer creates uncertainty in the Resistance Spot Welding (RSW) process and deteriorates the electrodes, hence decreasing electrode life. Moreover, it creates wettability issues between steel and aluminium which is an essential for joint formation. Joint is established once surface oxide layer is broken.
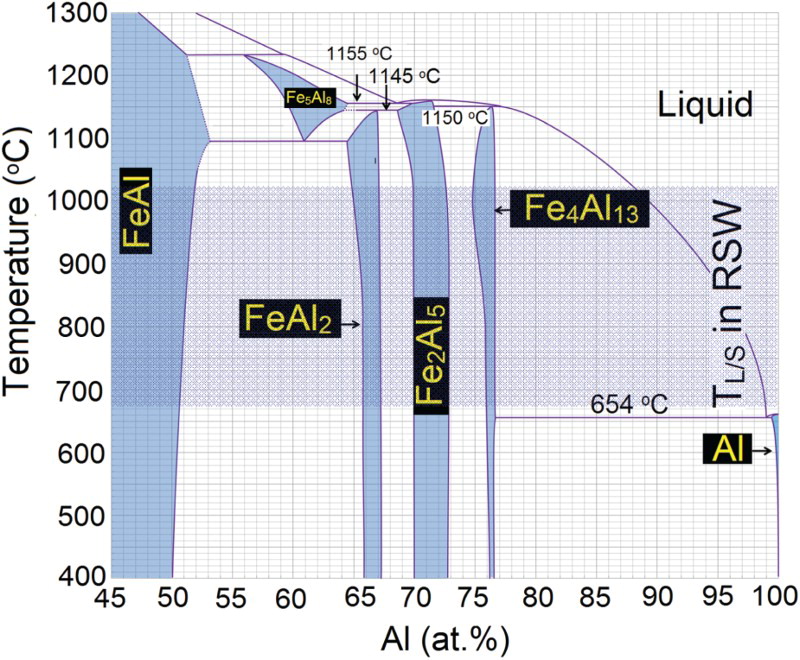
Formation of intermetallic compounds are unavoidable during Al-steel RSW joints. Figure 1 shows the phase diagram between aluminium and iron and from the phase diagram various intermetallics compounds are formed during the RSW process. Formed intermetallics could be iron rich or aluminium rich. Aluminium rich intermetallics are undesirable due to higher hardness compared to iron rich intermetallics. These intermetallics act as stress concentrators, increases the brittleness and making the Al-steel joints more susceptible to cracking.
Figure 1. Al-Fe phase diagramL-8
Another issue is to attain heat balance between aluminium and steel. Compared to steel, aluminium has more electrical & thermal conductivity, and lower bulk resistivity, usually requiring higher amount of current. A large variation in the melting temperature of the aluminium and steel make the RSW process more complicated. Moreover, the thermal conductivity of aluminium is much higher than steel, and a consequent thermal gradient exists and could result in an isolated nugget formation in steel. These factors make the selection of RSW process parameters more challenging.
Excessive electrode indentation in aluminium is another issue that determines the stress state of the joint during loading. It decreases the resistance to necking and decreases the peak load to failure.
Other defects include formation of voids and porosities due to shrinkage, vaporization, expulsion and lack of wetting. Other section in this menu will discuss the basic to advanced, updated approach utilized to improve the joint formation process between aluminium and steel.