M-Value
M-Value, Strain Rate Sensitivity
The strengthening of some metals changes with the speed at which they are tested. This strain-rate sensitivity is described by the exponent, m, in the modified power law equation:
where έ is the strain rate and m is the strain rate sensitivity.
To characterize the strain rate sensitivity, medium strain rate tests were conducted at strain rates ranging from 10-3/sec (commonly found in tensile tests) to 103/sec. For reference, 101/sec approximates the strain rate observed in a typical stamping. Both yield strength and tensile strength increase with increasing strain rate, as indicated Figures 1 and 2.
Figure 1: Influence of Strain Rate on Yield Strength.Y-1
Figure 2: Influence of Strain Rate on Tensile Strength.Y-1
Up to a strain rate of 101/sec, both the YS and UTS only increased about 16-20 MPa per order of magnitude increase in strain rate. These increases are less than those measured for low strength steels. This means the YS and UTS values active in the sheet metal are somewhat greater than the reported quasi-static values traditionally reported. However, the change in YS and UTS from small changes in press strokes per minute are very small and are less than the changes experienced from one coil to another.
The change in n-value with increase in strain rate is shown in Figure 3. Steels with YS greater than 300 MPa have an almost constant n-value over the full strain rate range, although some variation from one strain rate to another is possible.
Figure 3: Influence of Strain Rate on n-value.Y-1
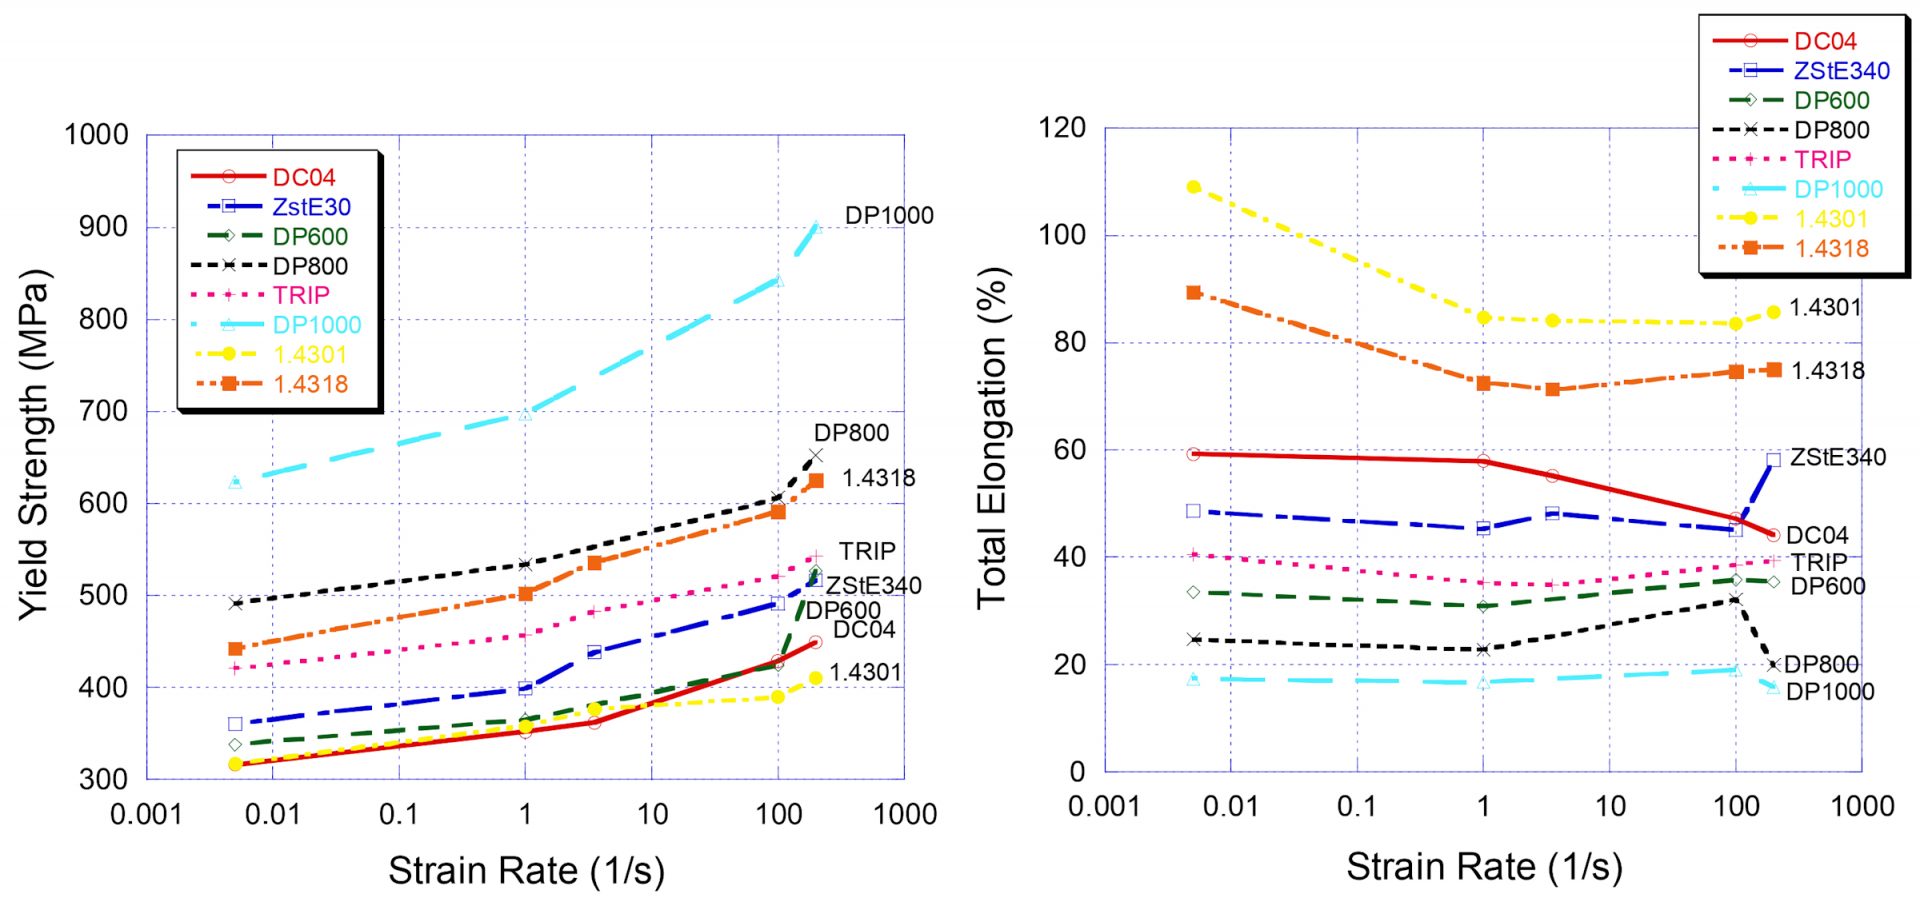
Similar behavior was noted in another studyB-22 that included one TRIP steel and three DP steels. Here, DP1000 showed a 50% increase in yield strength when tested at 200/sec compared with conventional tensile test speeds. Strain rate has little influence on the elongation of AHSS at strain rates under 100/sec.

Figure 4: Relationship between strain rate and yield strength (left) and elongation (right). Citation B-22, as reproduced in Citation D-44
Figure 5 shows the true stress-true strain curves for a processed Press Hardened Steel tested at different strain rates. The yield stress increases approximately five MPa for one order of magnitude increase in strain rate.
Figure 5: True stress-strain curves at different strain rates for 1mm thick Press Hardening Steel (PHS) after heat treatment and quenching.V-1
The tensile and fracture response of different grades is a function of the strain rate and cannot be generalized from conventional tensile tests. This has significant implications when it comes to predicting deformation behavior during the high speeds seen in automotive crash events. See our page on high speed testing for more details.