Microstructural Evolution and Effect on Joint Strength in Laser Welding of DP to Aluminium
Given the use of many different metals in the Body in White construction, it is important to understand the effects of dissimilar welding AHSS. Researchers at Indian Institute of Technology Madras in Chennai, India and Centre of Laser Processing of Materials in Hyderabad, India developed tests to study the resulting microstructure from laser welding 2.5 mm thick DP600 steel to 3 mm thick AA6061 aluminium alloy using a laser beam diameter of 1.5 mm.I-1 They discovered a softening in the steel HAZ due to a tempering effect and an increase in hardness in the aluminum HAZ due to the presence of aluminium intermetallic phases present. Maximum shear strength was observed when the thickness of intermetallics was reduced to 8-11 microns. They concluded that best quality welds were made under power densities and interaction times of 1.98kW/mm2, 0.15s and 2.26 kW/mm2, 0.187s.
The laser power was varied from 3 kW to 4.5 kW and the scanning speed of 8 mm/s, 10 mm/s, and 12 mm/s. Power density and interaction time were two parameters they used to compare trials where:
| Power density (Pd) = |  |
and
| interaction time (It) = |  |
The resulting welding parameters are shown in Table 1 below. Figure 1 shows the microstructure of the fusion boundary and HAZ on the DP600 side of the welded joint. Figure 2 shows the microstructure of the weld interface on the AA 6061 side. Figure 3 displays the hardness data with (a) representing 3.5 kW and 10 mm/s, (b) representing 3.5 kW and 8 mm/s, and (c) representing 4 kW and 8 mm/s. Figure 4 represents the Shear Stress-Strain of the welds given different IMC thickness.
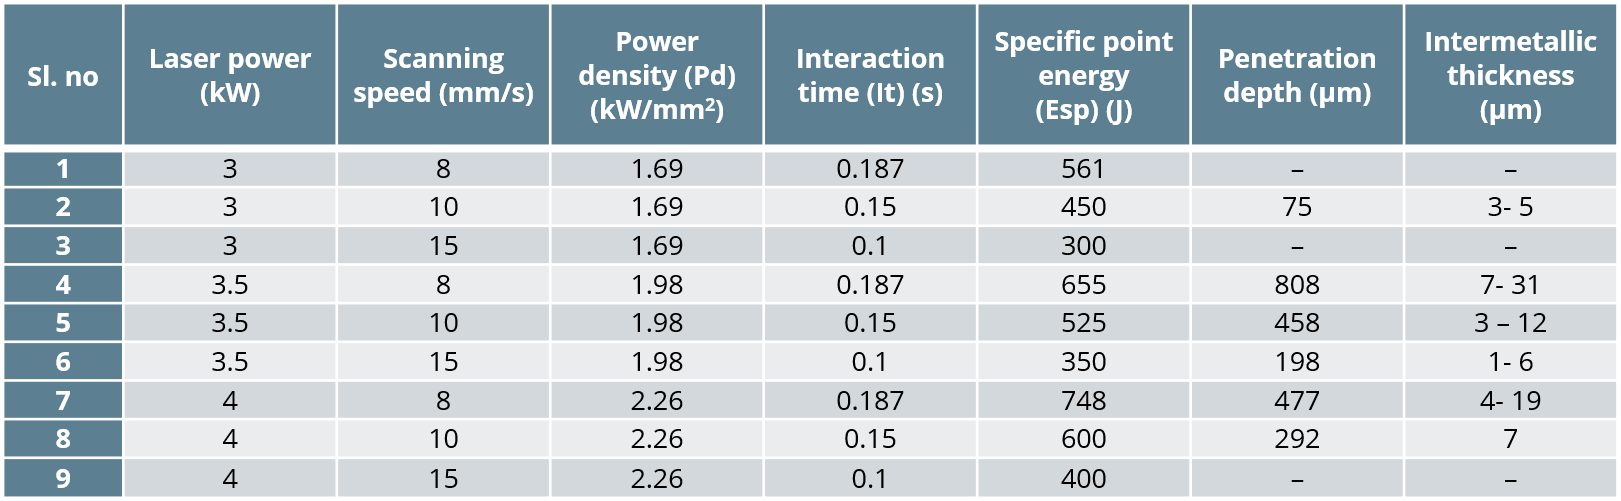
Table 1: Welding Parameters.I-1
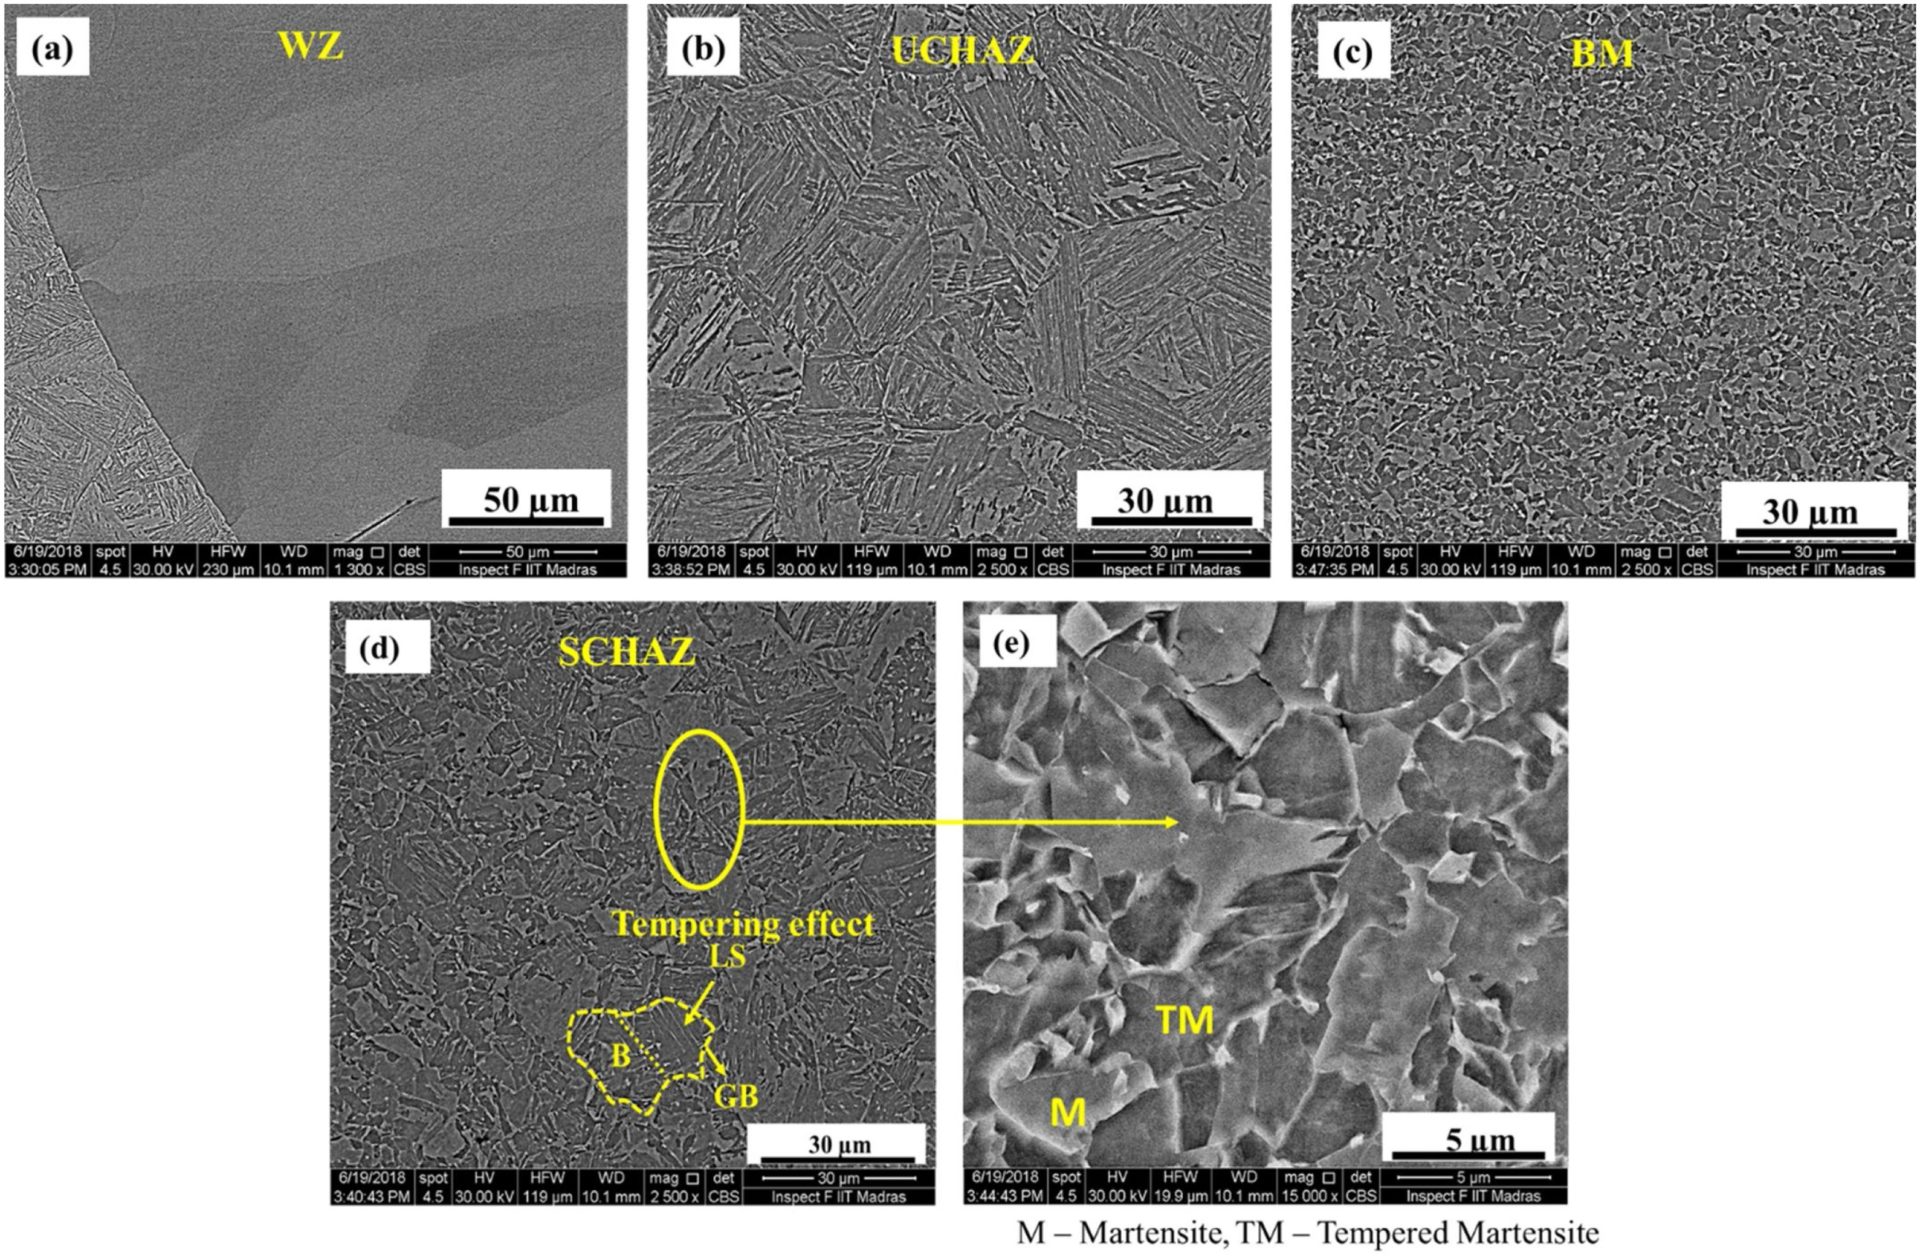
Figure 1: Weld Metal, DP 600 Base Metal and HAZ microstructure.I-1
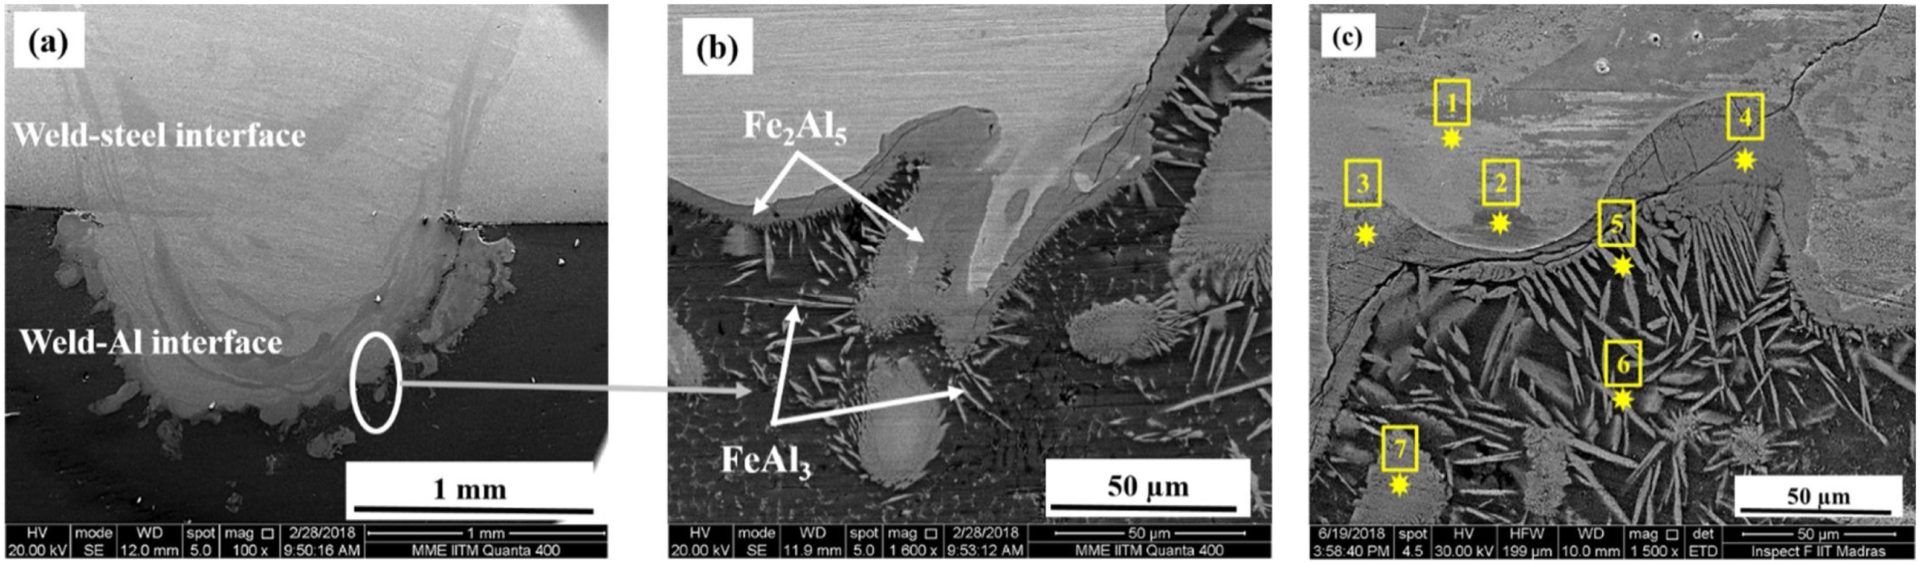
Figure 2: Fe-Al interface microstructure.I-1
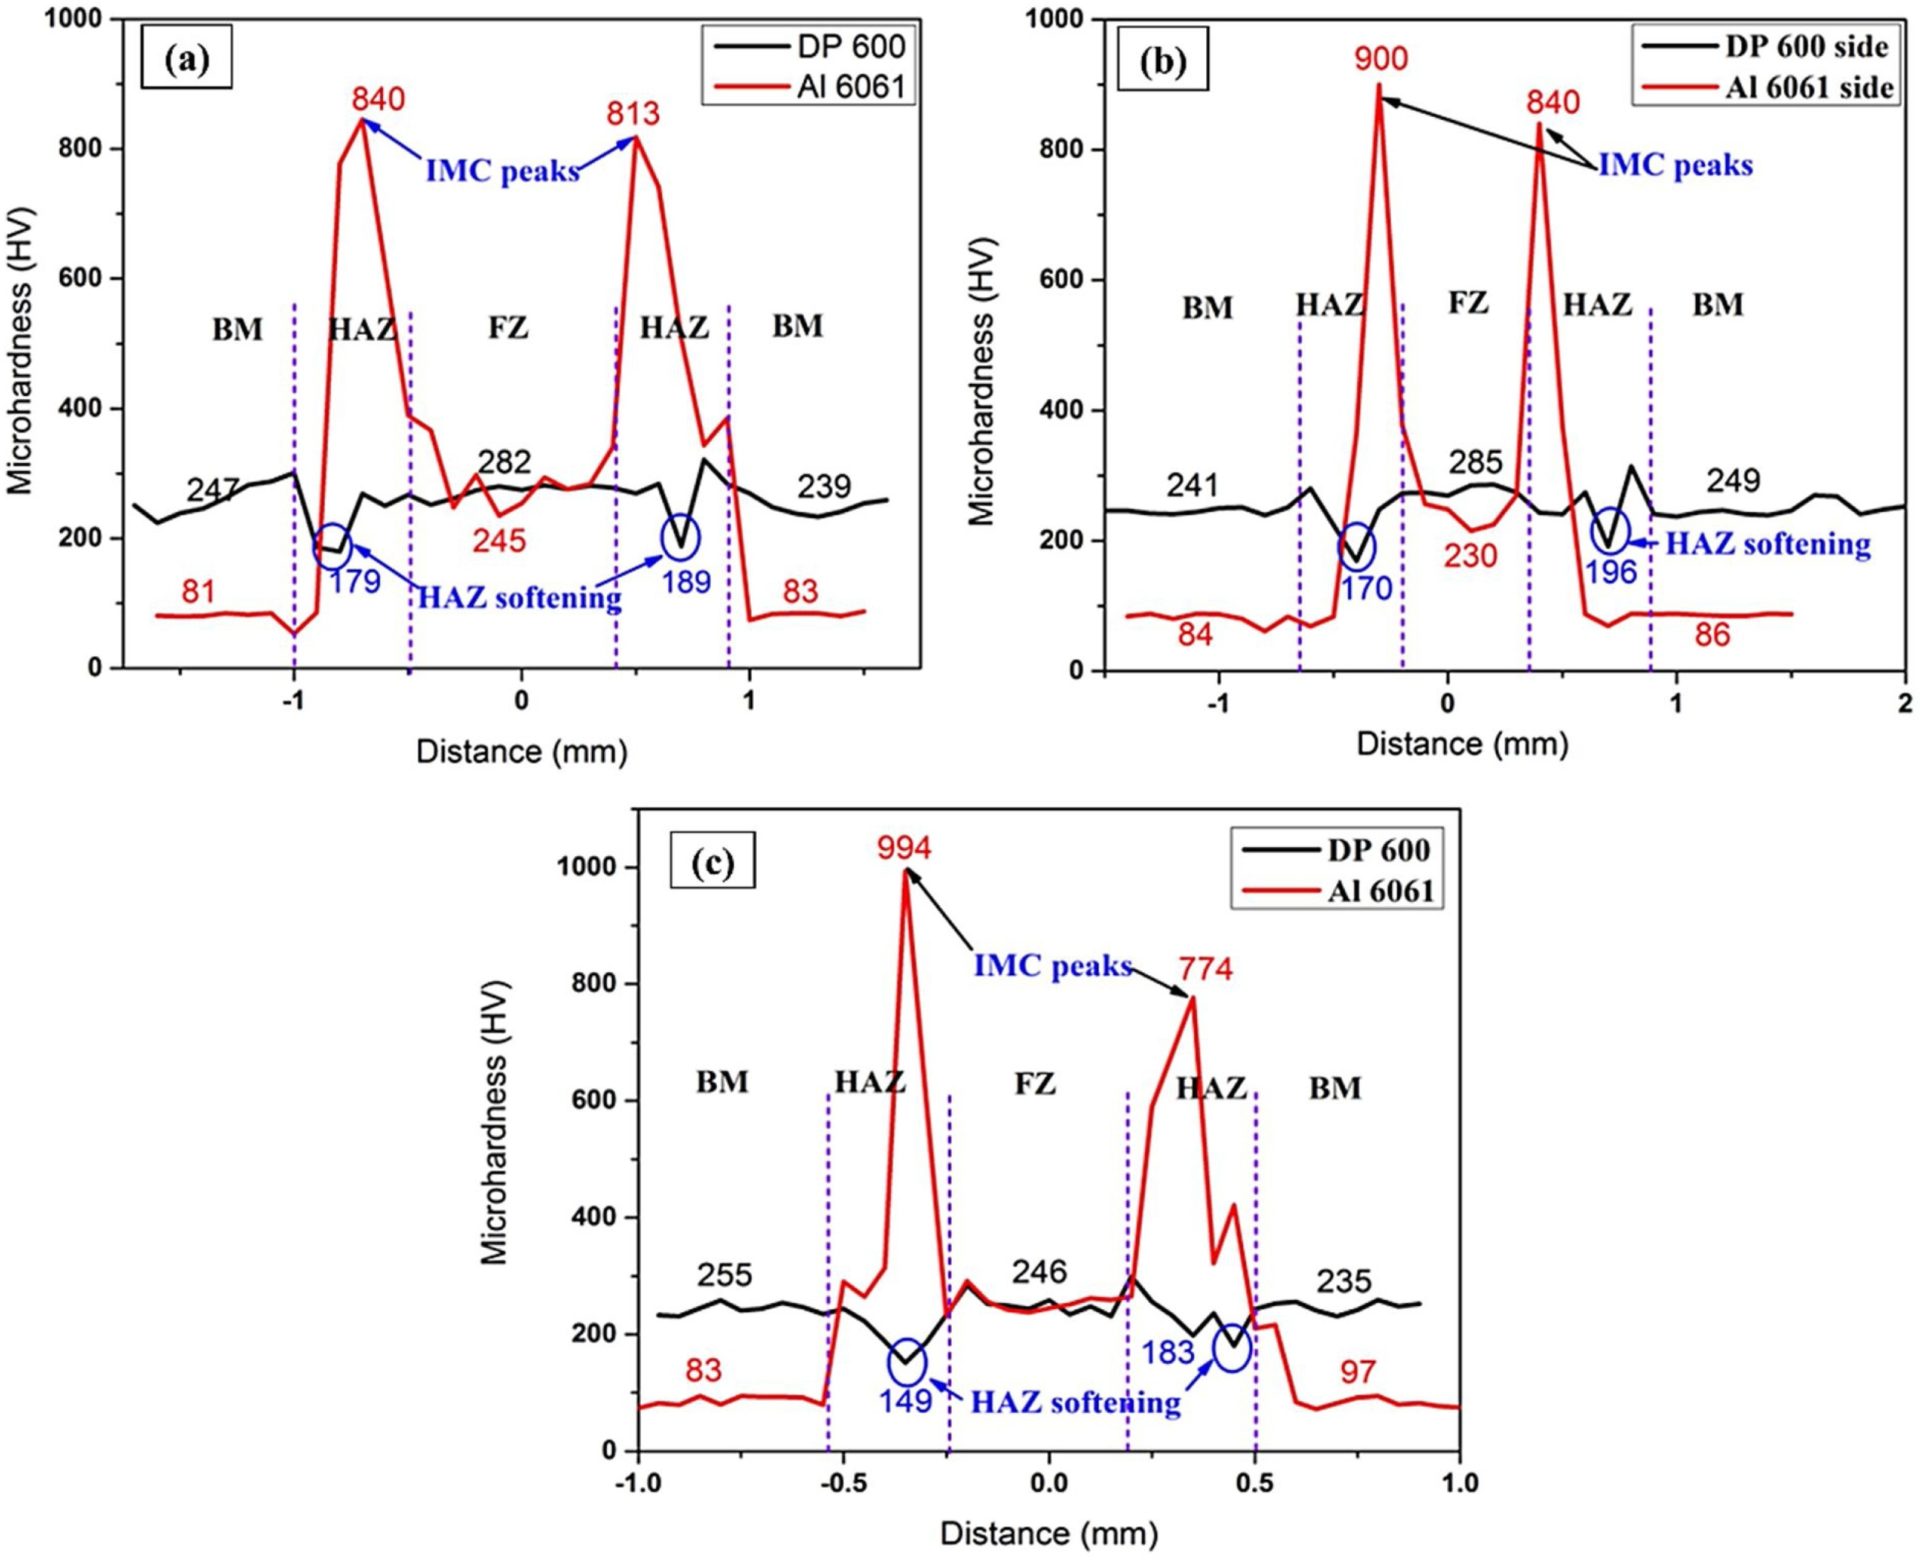
Figure 3: Microhardness Plot.I-1
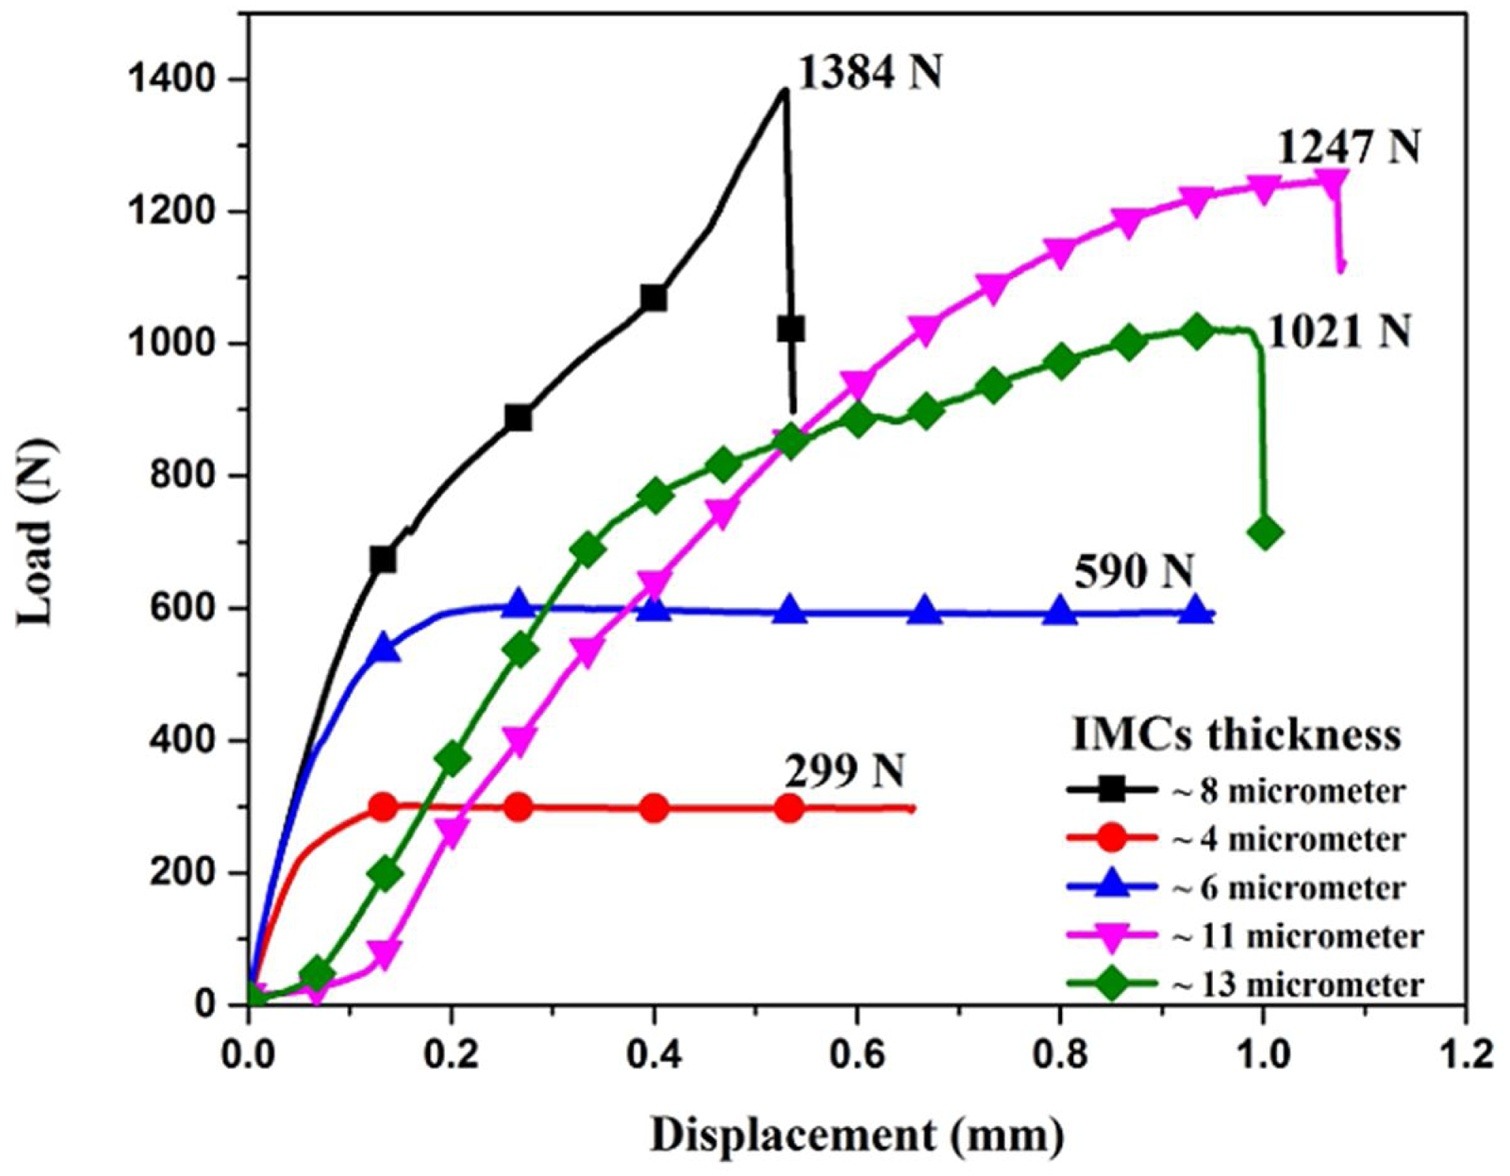
Figure 4: Load vs. Displacement.I-1