Coating Friction
Friction during the stamping process is a key variable which impacts metal flow. It varies across the stamping based on local conditions like geometry, pressure, and lubrication, which change during the forming process. The tool surface influences metal flow, as seen when comparing the results of uncoated tools to those with chrome plating or PVD coatings.
The sheet steel surface is another contributor to friction and metal flow, which changes based on the type of galvanized coating. There are different types of friction tests which attempt to replicate different portions of the forming process, such as flow through draw beads of drawing under tension. Since these tests measure friction under different conditions, the numerical results for the coefficient of friction are not directly comparable. However, within a specific test, extracting useful information is possible.
A study S-54 evaluated the friction of seven deep-drawing steels (DDS), all between 0.77mm and 0.84 mm, with the coating being the most significant difference between the products. Table 1 shows the sample identification and lists the mechanical and coating properties of the tested products, which included two electrogalvanized (EG), one electrogalvanized Zn-Fe alloy (EGA), two hot dip galvanized (HDGI), and two hot dip galvanneal (HDGA) steels. The HDGA coatings differed in the percentage of zeta phase relative to delta phase in the coatings.

Table 1: Properties of DDS grades used in this friction study.S-54
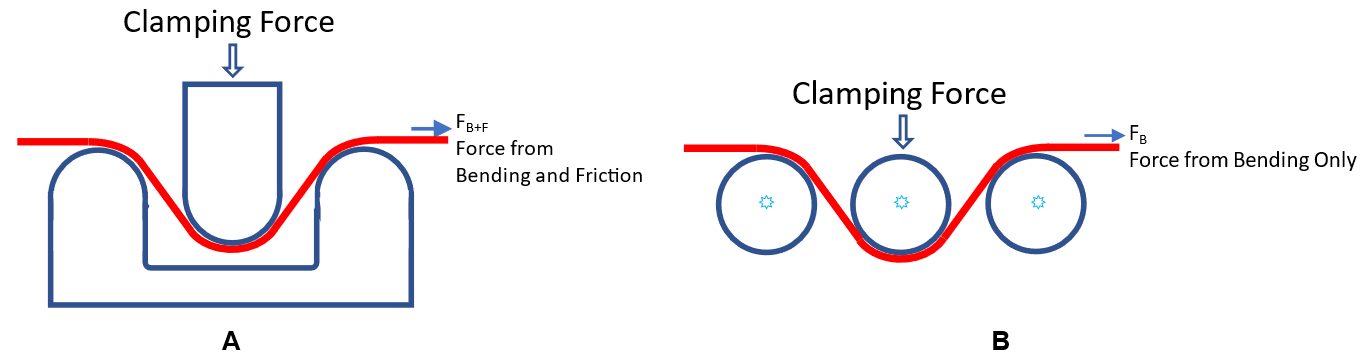
Tests to evaluate friction included a Draw Bead Simulator (DBS), a Bending Under Tension (BUT) test, and a Stretch Forming Simulator (SFS) test. Dome height test and deep draw cup tests were performed to verify the friction behavior of the tested materials. Citation S-54 explains these tests in greater detail. Two different lubrication conditions were evaluated: “as” meaning as-received, and “lub” where the samples were initially cleaned with acetone and mill oil was reapplied.
Figure 1 summarizes the results from the three different friction tests. The relative performance of different coatings is consistent across the tests.S-54 For the tested materials, the HDGI coated steels showed the lowest average friction coefficient and a more stable friction behavior regardless of the lubrication conditions. Zn-Fe alloy coatings (EGA or HDGA) typically resulted in the highest friction. The BUT test generates the lowest strain level among three tests, while the DBS and SFS tests result in higher strain due to a more severe surface contact between tooling and specimen. Stretch forming test tends to result a lower friction coefficient mainly due to higher strain in the stretching process.

Figure 1: Friction test results for different coatings. The relative performance of different coatings is consistent across the tests. S-54
Coating and lubrication interact to influence friction. Draw bead simulator testing compared friction generated on 1mm cold rolled (bare), hot dip galvanized (HDG), and electrogalvanized (EG) deep drawing steel, lubricated with varying amounts of either mill oil, prelube, or a combination of the lubricantsS-68, as summarized in Figures 2, 3, and 4.
Conclusions from this study include:
- Prelube reduces friction on all tested surfaces, with the most dramatic effect seen on electrogalvanized surfaces.
- Above 1 g/m2, there is little friction benefit associated with adding additional lubrication.
- Adding heavier amounts of prelube on top of mill oil did incrementally reduce friction, but the effect essentially maximized at 1.5 g/m2 prelube on top of 1 g/m2 mill oil.
- Cold rolled (bare) steel showed a greater tolerance for dry spots than hot dip or electrogalvanized surfaces. Areas without any lubricant on HDG or EG surfaces led to sample fracture.

Figure 2: DBS Coefficient of Friction: Cold Rolled (Bare) Mild Steel.S-68

Figure 3: DBS Coefficient of Friction: Hot Dip Galvanized Mild Steel.S-68

Figure 4: DBS Coefficient of Friction: Electrogalvanized Mild Steel.S-68
The tool material influences metal flow and therefore friction, but its effect varies with the zinc coating on the sheet steel. The impact of tool steel, kirksite zinc, cast iron, cast steel and chrome plated cast iron on different coated deep drawing steels was evaluated using the Bending Under Tension test.S-55 The friction coefficient obtained using kirksite is lower than that obtained with the other die materials and is relatively independent of the type of zinc coating (Figure 5), reinforcing the caution usually applied stating that soft tool tryout will not be fully representative of what occurs later in the die development process. Supporting the conclusions of the prior study, this evaluation also showed that the HDGI coating tends to have the lowest friction coefficient, especially for cast iron with and without chrome plating (hard tool and production). Also observed was that an oil-based blankwash solution tends to have the highest friction coefficient among the tested lubricants, while a dry film has the lowest friction coefficient.

Figure 5: Influence of die material on friction of galvanized DDS determined in the Bending Under Tension test.S-55
The surface phase in hot dipped galvannealed steel has a impact on friction. Whereas the surface of hot dip galvanized steel is essentially pure zinc, the GA surface may be zeta phase or delta phase. The iron content is the primary compositional difference: the zeta (ζ) phase contains approximately 5.2% to 6.1% by weight of iron, and the delta (δ) phase contains approximately 7.0% to 11.5% by weight of iron.G-21 Zeta phase is softer and less brittle than the delta phase, but has a high coefficient of friction.G-22 Even with a fully delta phase surface, additional optimization is possible to produce targeted surface morphologies.S-56 The two right-most images in Figure 6 are both of delta phase surfaces, with the cubic surface (right image) associated with better formability than the rod surface of the center image (Figures 7 and 8).

Figure 6: Surface morphology and coating cross section of 3 galvanneal coatings. Left: Zeta surface; Center: Delta-rod surface; Right: Delta-cubic surface.S-56

Figure 7: Formability of galvannealed surfaces evaluated through a square cup test.S-56

Figure 8: Formability of galvannealed surfaces evaluated through a Limiting Draw Height (LDH) test. Higher is better.S-56
Low annealing temperature or time can result in excessive zeta phase. However, longer and hotter annealing cycles increase the risk of powdering and flaking. Producing the correct balance of ZnFe phases requires control of time and temperature of the galvannealing process.