RSW Modelling and Performance
This article summarizes the findings of a paper entitled, “Prediction of Spot Weld Failure in Automotive Steels,”L-48 authored by J. H. Lim and J.W. Ha, POSCO, as presented at the 12th European LS-DYNA Conference, Koblenz, 2019.
To better predict car crashworthiness it is important to have an accurate prediction of spot weld failure. A new approach for prediction of resistance spot weld failure was proposed by POSCO researchers. This model considers the interaction of normal and bending components and calculating the stress by dividing the load by the area of plug fracture.
Background
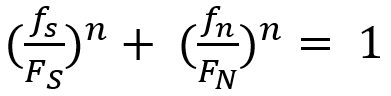
Lee, et al.L-49 developed a model to predict spot welding failure under combined loading conditions using the following equation, based upon experimental results .
|
Equation 1 |
Where FS and FN are shear and normal failure load, respectively, and n is a shape parameter.
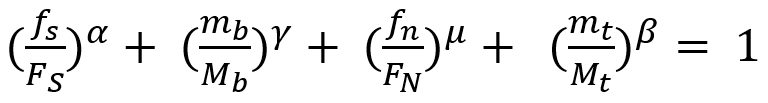
Later, Wung and coworkersW-38 developed a model to predict the failure mode based upon the normal load, shear load, bending and torsion as shown in Equation 2.
 |
Equation 2 |
Here, FS, FN ,Mb and Mt are normal failure load, shear failure load, failure moment and failure torsion of spot weld, respectively. α, β, γ and μ are shape parameters.
Seeger et al.S-106 proposed a model for failure criterion that describes a 3D polynomial failure surface. Spot weld failure occurs if the sum of the components of the normal, bending and shear stresses are above the surface, as shown in the Figure 1.
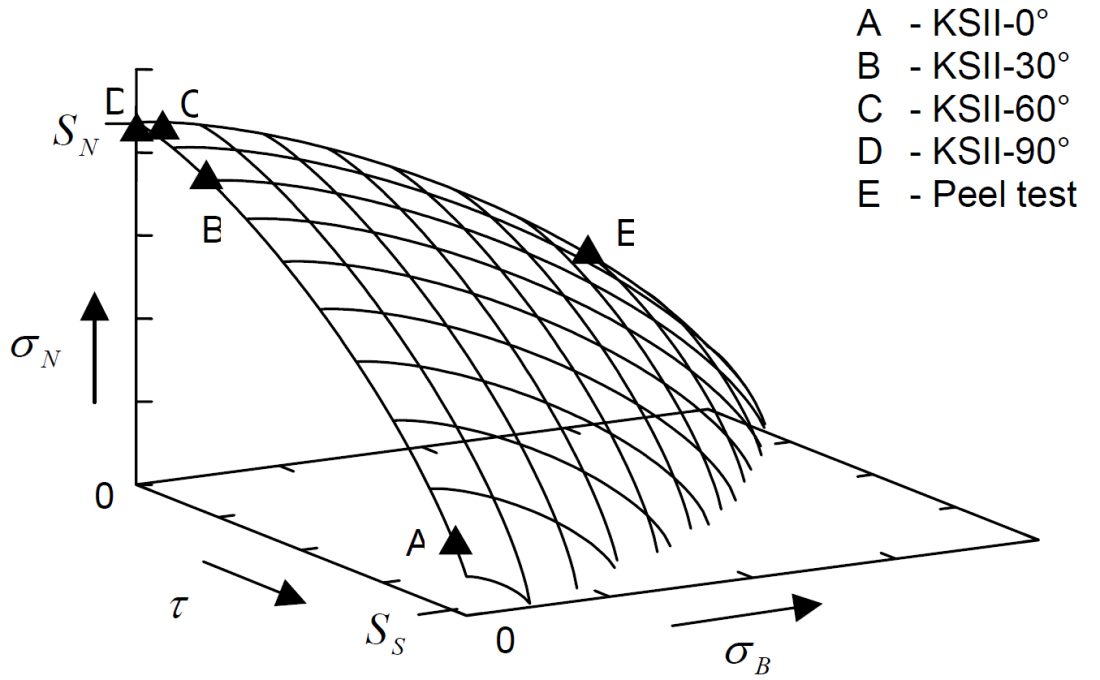
Figure 1: Spot weld failure model proposed by Seeger et al.S-106
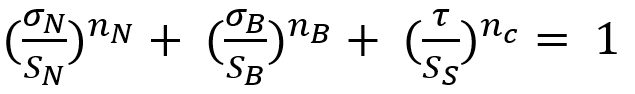
The failure criterion can be expressed via Equation 3.
 |
Equation 3 |
Here, σN , σB , and τ are normal, bending and shear stress of the spot weld, respectively. And nN, nB and nc are the shape parameters. Toyota Motor CorporationL-50 has developed the stress-based failure model as shown in Equation 4.
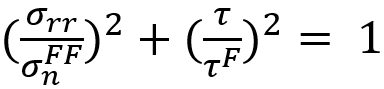 |
Equation 4 |
Hybrid Method to Determine Coefficients for Failure Models
This work used a unique hybrid method to determine the failure coefficients for modeling. The hybrid procedure steps are as follows:
- Failure tests are performed with respect to loading conditions.
- Finite element simulations are performed for each experiment.
- Based on the failure loads obtained in each test, the instant of onset of spot weld failure is determined. Failure loads are extracted comparing experiments with simulations.
- Post processing of those simulations gives the failure load components acting on spot welds such as normal, shear and bending loads.
These failure load components are plotted on the plane consisting of normal, shear and bending axes.
The hybrid method described above is shown in Figure 2.L-48
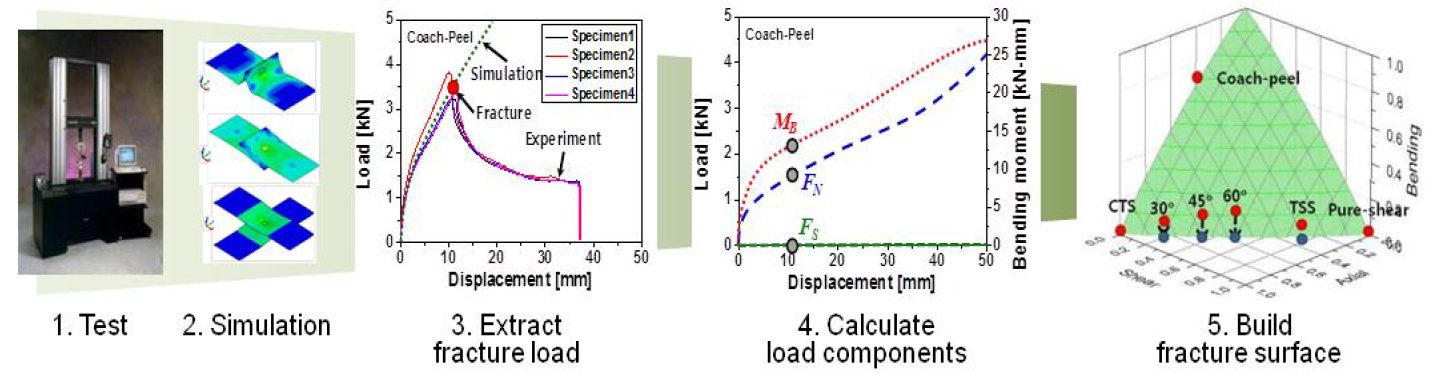
Figure 2: Hybrid method to obtain the failure load with respect to test conditions.L-48
New Spot Weld Failure Model
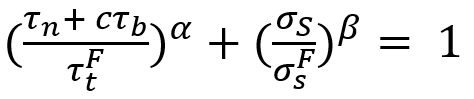
The new proposed spot weld failure model in this paper considers only plug fracture mode as a normal spot weld failure. Secondly normal and bending components considered to be dependent upon each other. Stress generated by normal and bending components is shear, and shear component generates normal stress. Lastly authors have used πdt to calculate the area of stress instead of πd2/4. The final expression is shown in the Equation 5.
 |
Equation 5 |
Here τn is the shear stress by normal load components, σS is the normal stress due to shear load component. And  ,
,  , c, α and β are coefficients.
This work included verification experiments of 42 kinds of homogenous steel stack-ups and 23 heterogeneous stack-ups. The strength levels of the steels used was between 270 MPa and 1500 MPa, and thickness between 0.55 mm and 2.3 mm. These experiments were used to evaluate the model and compare the results to the Wung model.
Conclusions
Overall, this new model considers interaction between normal and bending components as they have the same loading direction and plane. The current developed model was compared with the Wung model described above and has shown better results with a desirable error, especially for asymmetric material and thickness.
Solid State Welding Steel to Aluminium
Introduction
Multi material design approach is the most common trend being followed by various industries including the automotive and aerospace industry. The main motive behind the concept is to attain weight reduction and increase the overall efficiency of the system.G-13 Once such desirable combination in the automotive industry is aluminum and steel. Resistance spot welding is one of the most common method used for the joining of aluminum and steel, however, is associated with challenges due to differences in physical properties, mechanical properties, and metallurgical incompatibilities. The inherent aluminum oxide layer creates uncertainties during the process and reduce the electrode life.P-10 Recent trends have shown an increase in the usage of the solid-state processes to attain better weldability between aluminum and steel. Solid state joining processes can be classified into two main categories i.e. mechanical joining processes and solid-state welding.
Mechanical joining involves clinching, clinch riveting, hemming and seaming, blind riveting, self-pierce riveting (SPR), solid pouch riveting, high speed tacking and flow drill screws. Joining is attained via plastic deformation at room temperature. The main advantages of mechanical joining processes involve high tool life, simple equipment, and relative shorter process time. Drawbacks include access required from both sides, bulge and indents, and relatively high amounts of force required during the process.
Solid state welding (SSW) consists of joining processes in which coalescence is attained via pressure or combination of pressure and heat. The peak temperature during the solid-state welding process remains below the melting point and mostly no filler material is required. SSW includes ultrasonic welding, friction welding, and diffusion bonding.
Mechanical Joining
Clinching
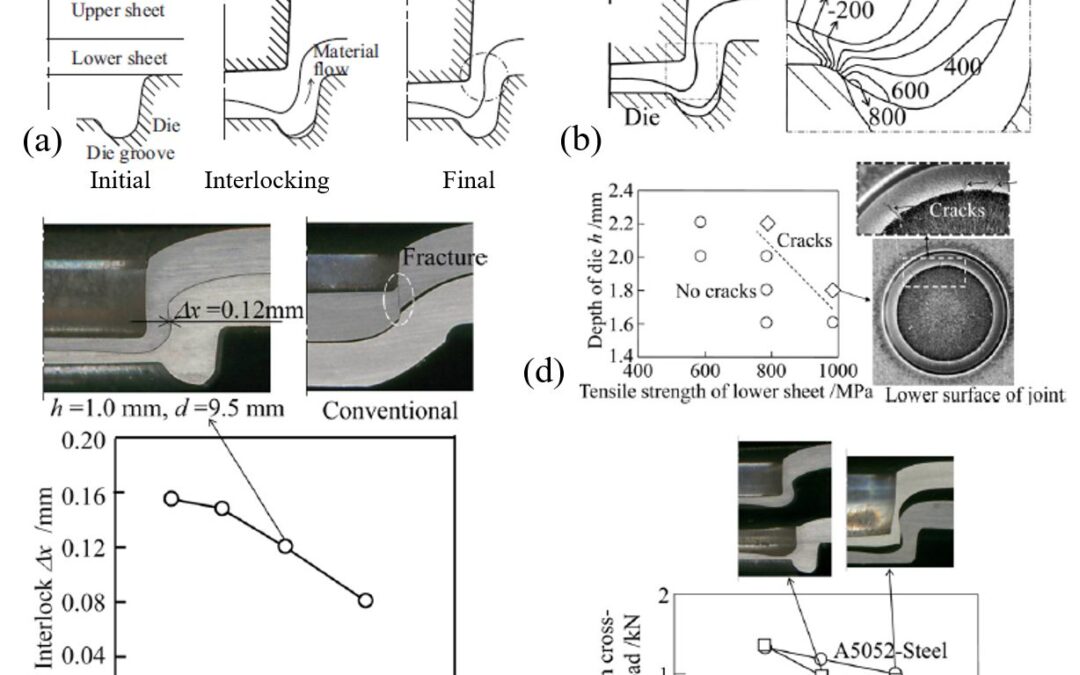
Clinching is a local hemming process that includes offsetting, upsetting and flow pressing. In a work carried out by Abe and coworkers, machinal clinching process is investigated for the joining between aluminum and sheets.A-34 Punch and dies with various depths were used to control the material flow and interlocking distance. The main objective was to attain mechanical interlocking without rupture in the sheets. Figure 1a shows the clinching process steps and Figure 1b shows the stress distribution of the formed joint after the clinching process. Figure 1c shows the relationship between interlocking distance and tensile strength of the sheets. Higher strength steel sheets have shown less interlocking due to more resistance to deformation. At higher tool depth the cracks can be seen in the bottom sheets due to excessive plastic deformation (Figure 1d). For all the tests between aluminum and steels, joint was fractured on the aluminum side. Higher strength steels sheets have shown lower cross tension strength due to reduction in the interlocking. Cracks formed during the process can be minimized by eliminating the groove of the die.
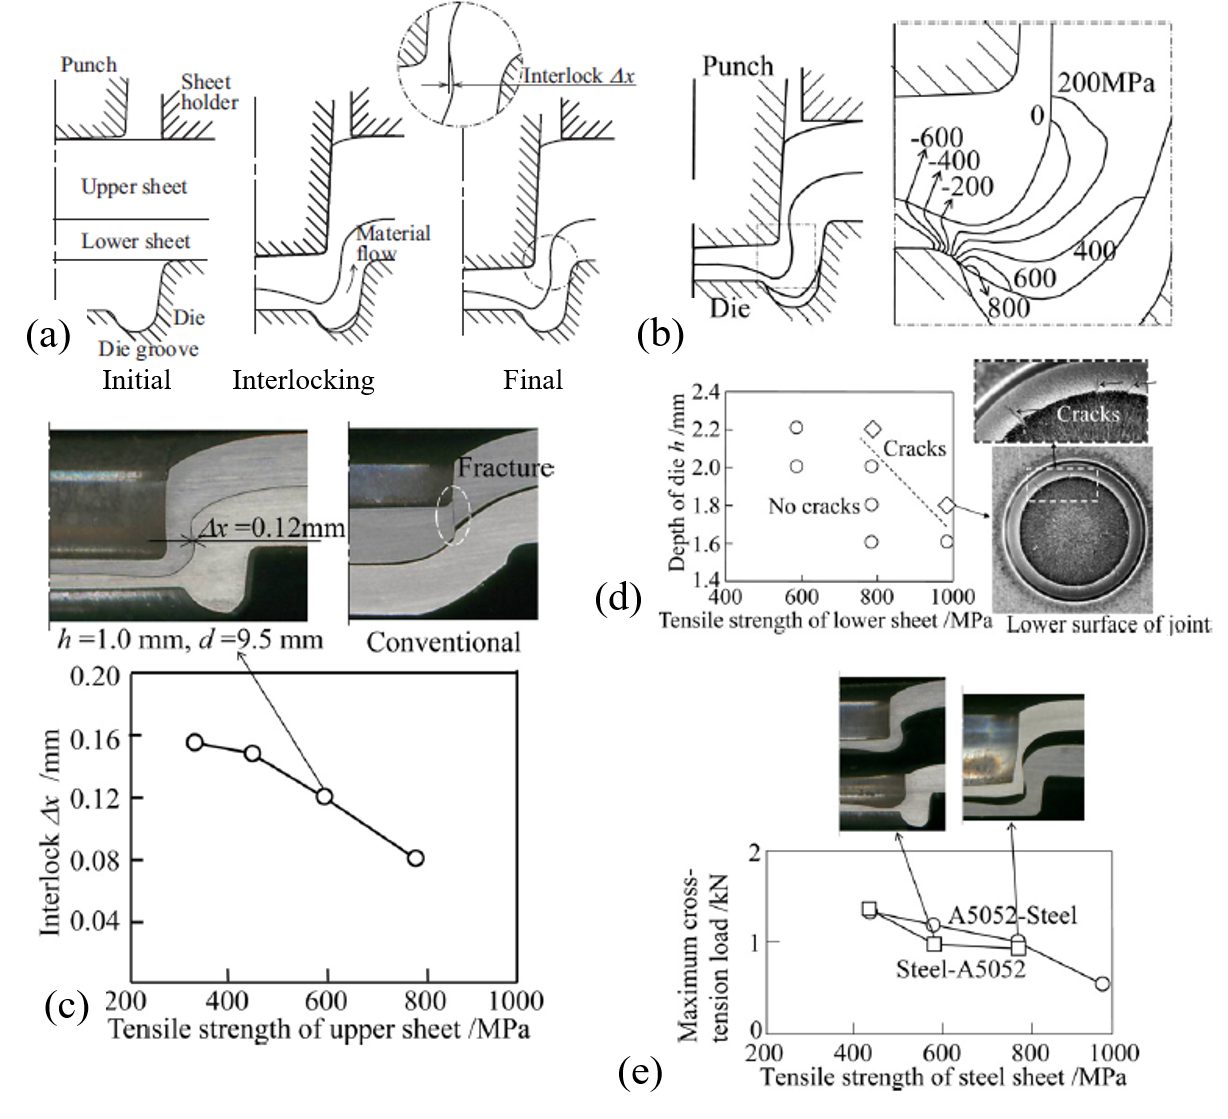
Figure 1: (a) Joining of sheets by mechanical clinching. (b) calculated hydrostatic stress. (c) Relationship between interlock and tensile strength of upper high strength steel obtained from experiment. (d) Occurrence of cracks for lower high strength steel sheets obtained from experiment for d = 8 mm. (e) Maximum load measured from cross-tension test of joined high strength steel and aluminum alloy sheets.A-34
Self-Pierce Riveting
Self-pierce riveting (SPR) is a cold joining process in which two or more sheets are joined via inserting rivet from the top sheets towards bottom sheets and is locked by a die shape. It is one of the most widely used mechanical joining process for the dissimilar materials combination i.e. steel and aluminum. Main advantages include no predrilled holes, no spark, no fumes, and no surface treatment. It comprises of four stages clamping, piercing, flaring, and releasing as shown in Figure 2 (a & b). Figure 2c shows the semi tubular and full tubular rivet through the multi materials stacks. The use of tubular or semi tubular rivet depends upon the material stacks combination. Steel rivets have shown higher mechanical strength compared to aluminum rivets (Figure 2d). The right half of the Figure 2e shows possible defects occur during riveting process.
![Figure 2: (a) A schematic diagram of the four stages of a SPR process, L-16 (b) A typical four-stage force–displacement curve of an SPR process, L-16 (c) Thick stacks with a semitubular SPR rivet and a fully tubular SPR rivet, L-16 (d) Comparison of the single-joint strength between aluminum rivets and a steel rivet with combined shearing and pull-out loading with loading angle α = 45°, H-11 (e) SPR joint quality and some faults [4]& (f) The displacement-load curves of the joints with different stack orientations. S-31](https://ahssinsights.org/wp-content/uploads/2020/09/image003.jpg)
Figure 2: (a) A schematic diagram of the four stages of a SPR process,L-16 (b) A typical four-stage force–displacement curve of an SPR process,L-16 (c) Thick stacks with a semitubular SPR rivet and a fully tubular SPR rivet,L-16 (d) Comparison of the single-joint strength between aluminum rivets and a steel rivet with combined shearing and pull-out loading with loading angle α = 45°,H-11 (e) SPR joint quality and some faults,L-16 and (f) The displacement-load curves of the joints with different stack orientations.S-31
Three main aspects are considered to determine the joint quality i.e. rivet head height, interlock distance and minimum remaining bottom material. Han et al. H-12 concluded that lower head height could result in higher interlocking distance for joining aluminum and steel alloys. Sun et al. S-31 has evaluated different stack configuration for the 5128O aluminum alloy with the HSLA 1350 alloys as shown in Figure 2f. It was concluded in the study that high strength materials such as HSLA 1350 should be on the tail side as it promotes sufficient interlocking especially when it comes to join thicker sheets (>3 mm).
Flow Drill Screw Process
Flow drill screw process is a thermomechanical joining process, combining friction drilling and thread forming process. During the process, screws act as fasteners, drilling and tapping tools. A main advantage is that only single sided access is required for flow drill screw (FDS) process. FDS can be used with or without drilling the hole depending upon the screw material and stack materials.
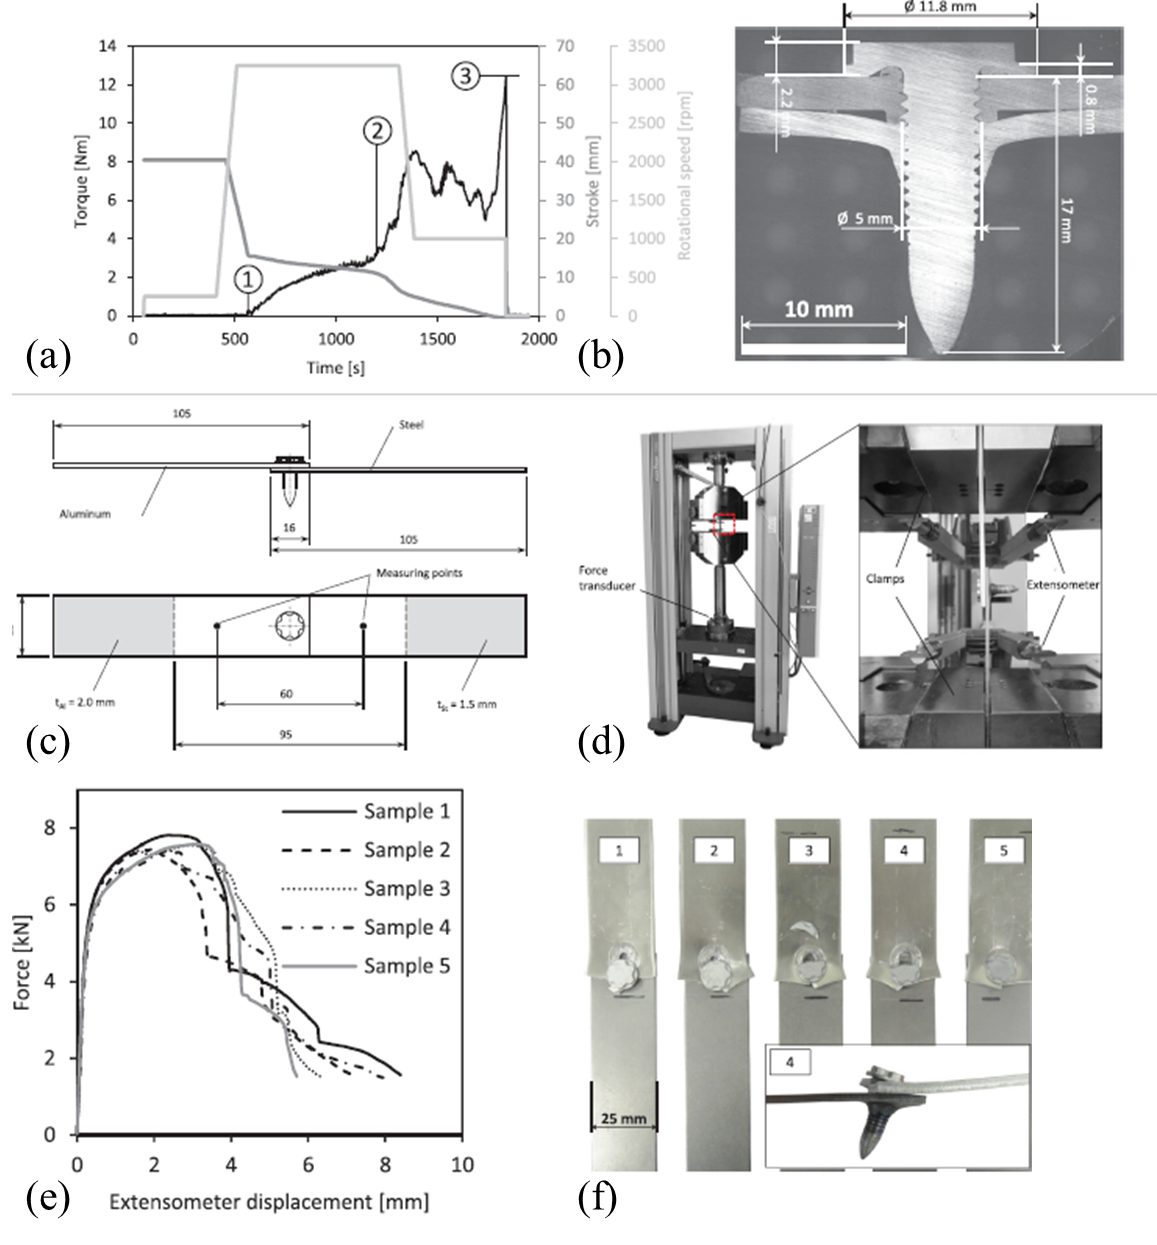
Figure 3: Joining parameters and cross section of single-lap shear specimen. (a) Relevant screwing parameters over time (representative example): start of warming up and penetration of the substrate material, beginning of thread forming, tightening torque. (b) Cross-section of connection with nominal dimensions. Static single-lap shear test of an aluminum-steel flow drill connection. (c) Geometry of specimen. (d) Experimental setup. (e) Force-displacement curves. (f) Fracture appearance.G-15
Graff and coworkers have evaluated the flow stress during FDS process between aluminum and steel.G-15 A 5083H111 aluminum alloy and HC340LA micro alloyed steel were used in this study. Figure 3a shows the experimental parameters and Figure 3b shows the cross section of the formed joint. Samples were fractured in the aluminum side each time with the peak failure load of 7 kN.
Solid State Welding, Steel to Aluminium
Ultrasonic Welding
In ultrasonic metal welding process, joining is achieved via shear motion at the faying surfaces of the materials to be joined. It is combination of friction and cold pressure welding. This process is more ideal in joining thinner sheets of aluminum and steel. In a technical report published by Shakil and coworkers, ultrasonic metal welding between 3003 Al alloy (thickness 50 µm) and 304 stainless steel (thickness 300 µm) was evaluated.S-32 Figure 4 shows the schematics of their ultrasonic metal welding process. In this work, a 2.4 kW lateral drive ultrasonic welder with a welding tip of 8 x 6 mm and 25 mm overlapping between the sheets without any surface preparation was utilized. Welding energy was varied between 75 J and 200 J and clamping force of 30, 40, 50, and 60 psi was utilized. It is shown in the studies that increase in the clamping force decreases the weld time. It is attributed to more heat generation due to increased sliding resistance.
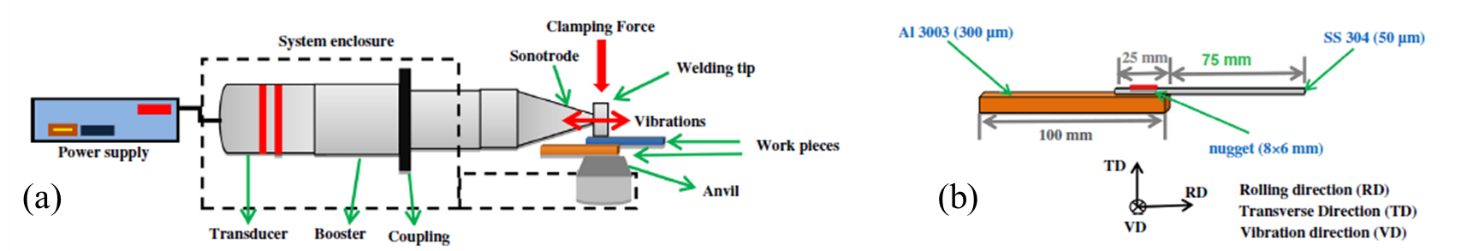
Figure 4: (a) Schematic diagram of lateral derive system. (b) Weld sample geometry.S-32
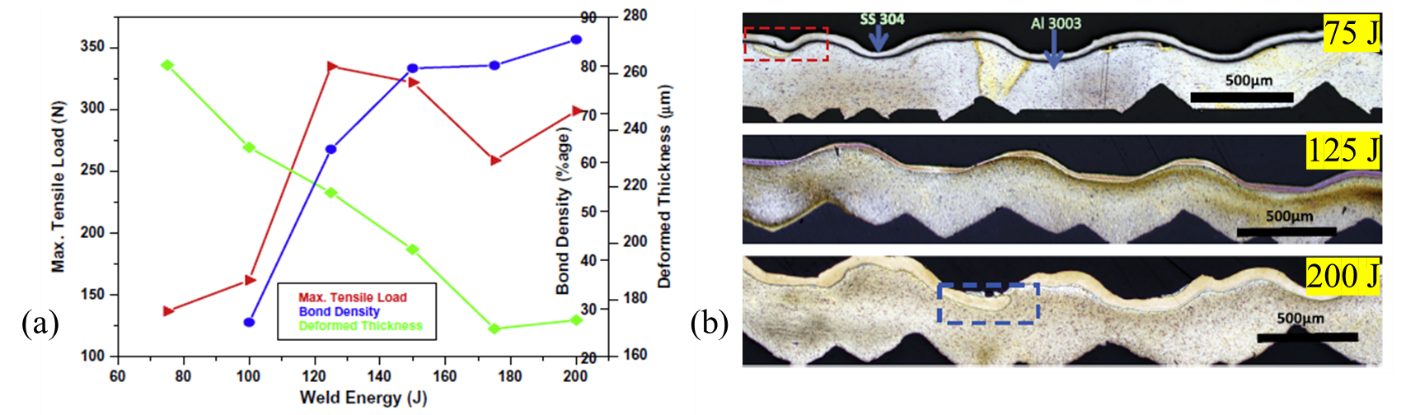
Figure 5: (a) Correlation of weld performance with bond density and deformed thickness. (b) Optical micrographs of 3003 Al and 304 SS weld cross-section produced with a pressure of 40 psi with increasing weld energies.S-32
A 40 psi maximum peak load to failure is observed at an energy input of 125 J as shown in the Figure 5. Optical micrographs revealed the wave like bonding line at the interface due to continuous shear oscillations. The joining process has been summarized into three steps i.e. formation of the micro bonds at the interface due to expansion followed by continuous deformation due to normal and shear oscillations at the faying surfaces. Lastly, these micro bonds grow and join to form a fully bonded interface. Moreover, it is specified that for a good quality weld, good combination of the bond density and material deformation is required.
In another work carried out by Jiromaru and coworkers, butt welding of thicker specimens (6 mm thick 5052 Al alloy and 304 stainless steel) via ultrasonic welding system (50 kW) of 15 kHz is evaluated.T-16 Figure 6 shows the schematics of the process. Welds were obtained at various amplitudes i.e. the peak to zero vibration is varied between 17 and 27 µm, static pressure of 20 Mpa and for a duration of 2 seconds. Figure 6 shows the schematics of the ultrasonic butt-welding system. Static and hydraulic pressure were utilized to clamp the welding specimens. Burrs were observed on the aluminum side and is attributed to the lower hardness of the aluminum compared to steel. Maximum strength attained was around 100 MPa at various amplitudes as shown in Figure 7. Significant decrease in the hardness is reported near the aluminum side and increase in the hardness is observed 2 mm away from the weld line on the stainless-steel side. The hardness value is lower in the upper and lower region compared to center region due to conduction. 20 % variation was observed in the hardness profile through the cross section of the welded specimens from top to bottom.
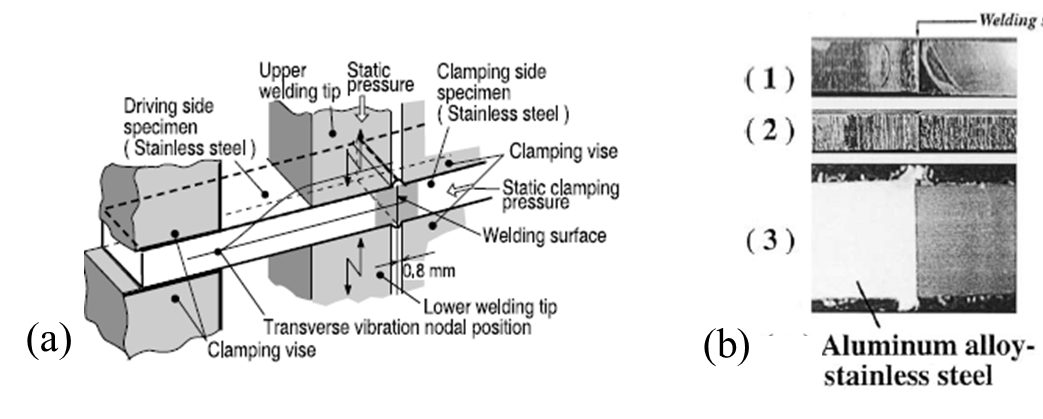
Figure 6: (a)) 15 kHz ultrasonic butt welding equipment using an upper and a lower welding tips, and hydraulic vices for clamping welding specimens and inducing static pressure to welding surface. (b); Welded conditions of 6-mm-thick, 10-mm-wide stainless steel plate specimens. (1) Upper view, (2) side view and (3) cross-section of welded 6-mm-thick, 10-mm.T-16

Figure 7: (a) Relationship between vibration amplitude, input power and weld strength of 6.0-mm-thick and 20-mm-wide pure aluminum and electrolytically polished stainless steel plate specimens. (b) Hardness tributions along a cross-section of a 6.0-mm-thick and 10-mm-wide welded aluminum alloy–stainless steel specimen at upper, center, lower parts. Welding time: 1.0 s.T-16
Friction Welding
In friction welding, joining is attained under the application of the pressure and rotation i.e. torque is applied and the materials to be joined are pushed against each other. Main advantages include reproducibility, shorter time, no filler material, and high-quality welds. However high capital cost is a limitation of this process. Friction welding processes involve several methods, such as linear friction welding, rotary friction welding and friction stir welding. Fukumoto and coworkers have evaluated the friction welding of 1050 aluminum alloy to austenitic stainless steel.F-8 Figure 8 shows the schematics of the materials to be joined. This study was carried out at constant parameters of 2400 rev/min, frictional pressure of 50 MPa, forging pressure of 150 MPa, and forging time of 6 seconds. However, frictional time was varied between 0.1 to 2 seconds. Flash was found to be symmetrical around the weld. Smaller heat affected zone was observed on the steel side. Intermetallic compounds Fe2Al5, Fe3Al and FeAl were detected in the reaction layer. Reaction layer thickness was found to be around 500 nm as shown in the Figure 9.
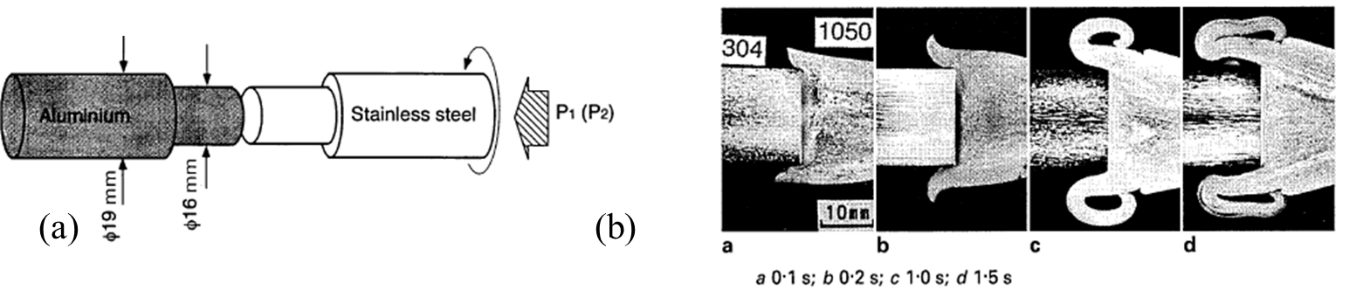
Figure 8: (a) Schematic illustration of friction welding procedure. (b) Cross-sectional macrostructures of friction welded joints for given frictional time t.F-8
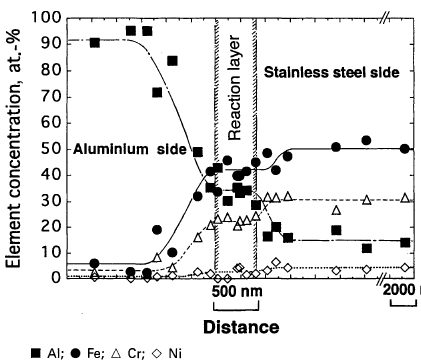
Figure 9: EDS analysis along line along the interface between aluminum and steel at 1.5 seconds.F-8
In another work carried out by Matsuda and coworkers, high frequency linear friction welding between aluminum alloys (5083 & 6063) and 304 stainless steel alloys was evaluated.M-14 The friction frequency was 245 Hz with an amplitude of 1.8 mm. It can be seen in the Figure 10 that loading ratio and friction time influences the tensile strength of the joints. Loading ratio was calculated as a function of proof stress with respect to aluminum alloys and was found to be 145 MPa. Maximum strength was reported at 60 % loading ratio at a friction time of 1 second i.e. 300 MPa.
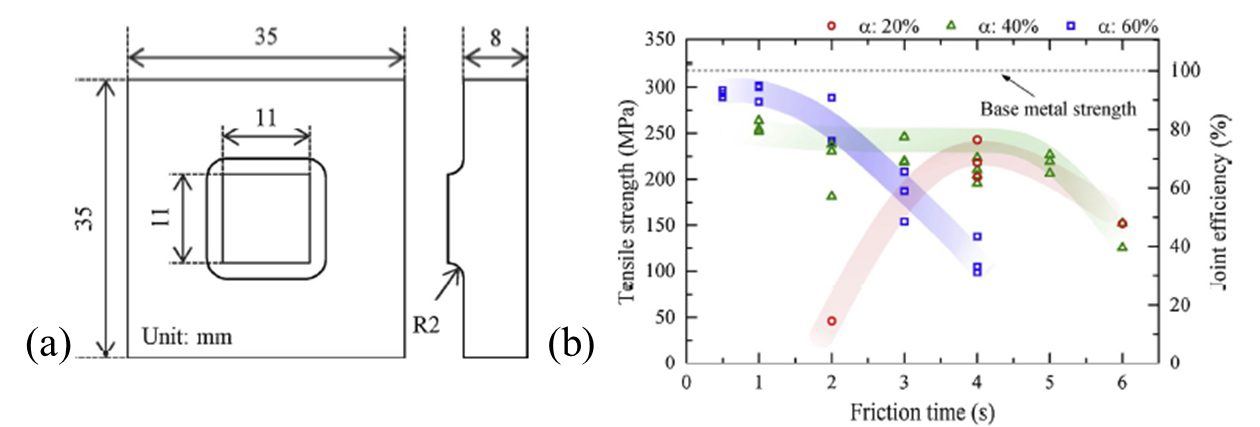
Figure 10: (a) Schematic illustration of the specimen. (b) Influence of loading ratio α and friction time on the tensile strength of Al-5083/304 SS.M-14
Tensile strength of these joints decreases with the increase in the friction time. Longer time promotes to wider reaction layer that is detrimental for the weld quality. Figure 11 shows the cross-sectional SEM images between Al5083/SS304 at 40 % and 60 % loading ratio. At longer friction times, cracks and fractures were observed at the interface. No reaction layer was seen at 20 % loading ratio. Reaction layer between Al5083/SS304 decreases below 500 nm at higher pressure and at longer time cracks were observed due to fracture of the intermetallic compounds (Figure 11).
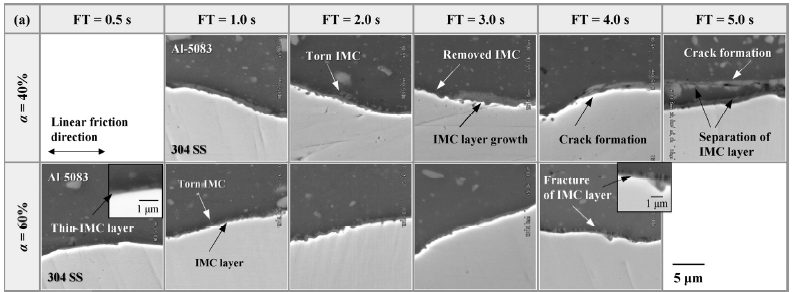
Figure 11: Cross-sectional SEM images of (a) Al-5083/304 SS joints showing the temporal evolution of their interfacial structures (FT=friction time)M-14
Kimapong and T. Watanabe reported butt joint of an aluminum alloy and mild steel via friction stir welding process.W-17 Up to 86 % of the joint strength is attained compared to aluminum alloy. SS400 mild steel plates A5083 plates having a thickness of 2 mm was used in this study. Figure 12a shows the schematics of the experimental procedure. A high-speed steel tools with 15 mm shoulder and 2 mm threaded pin diameter was used in this study. Rotational speed was varied from 100 to 1250 rpm. The pin traverse speed was 25 mm/min. Figure 12 (c&d) shows the effect of the rotating speed on the weldability of the friction stir welding process. Figure 12e shows the tensile strength of 240 MPa at a rotation speed of 250 rpm. At lower rotational speeds, the pin wore out due to inadequate heat generation and at higher rotational speed oxidation occurred due to the presence of aluminum and magnesium. Lower rotation speeds do not generate enough heat required for plasticization whereas higher rotational speeds lead to higher temperature that promotes the oxidation of the aluminum and magnesium, hence decrease the quality of the weld. It is therefore important to select right rotational speed for the sound weld.
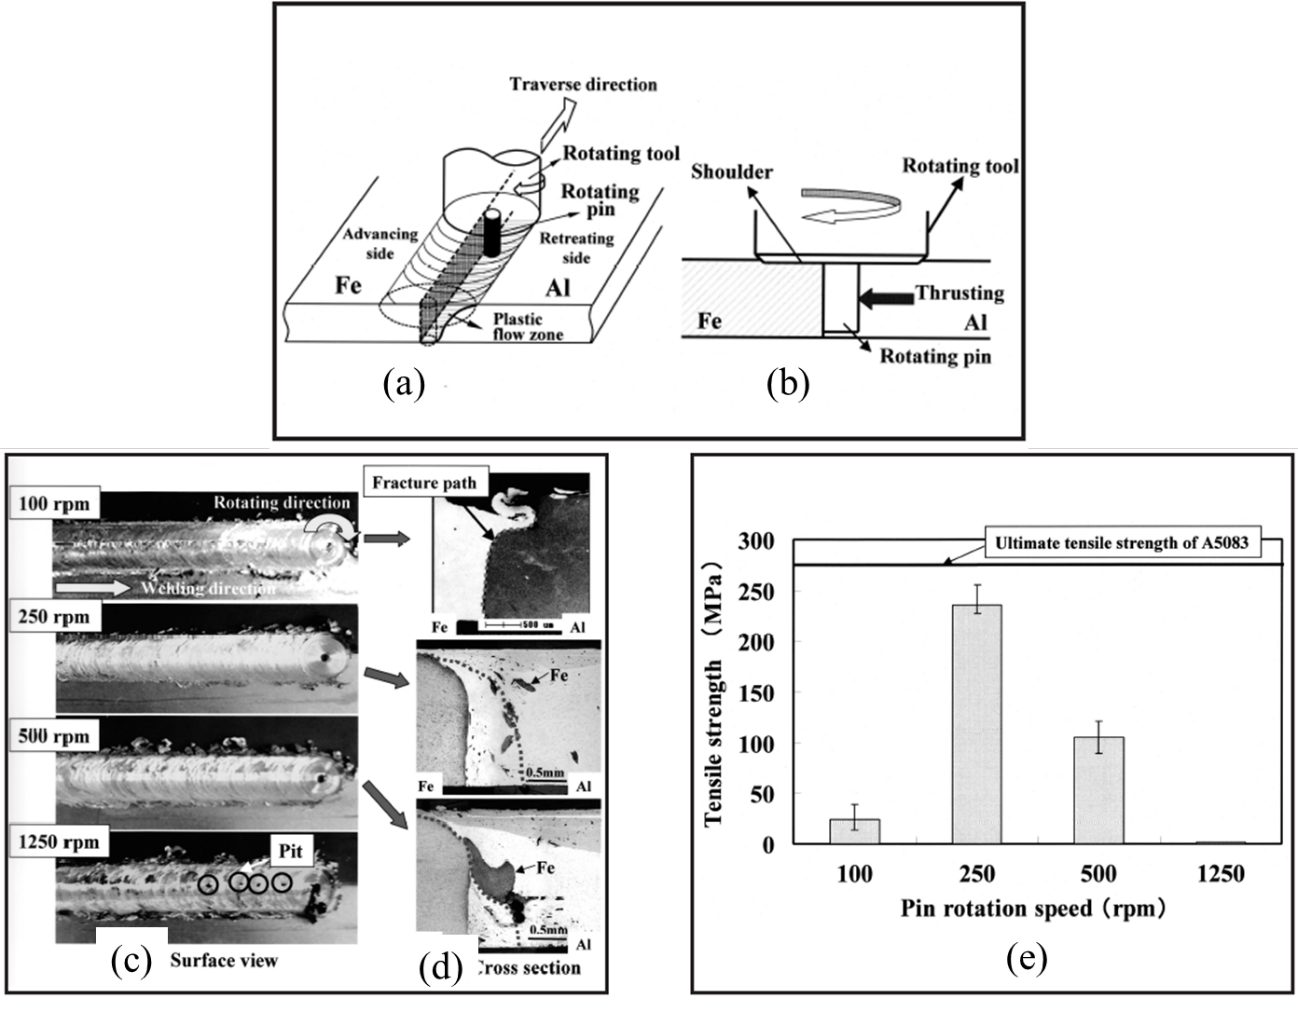
Figure 12: Schematic of the rotating pin position in this study: (a) Bird’s eye view of the method; (b) view of the cross section perpendicular to the weld interface. Effects of pin rotation speed; (c) surface view; (d) cross-sectional structure with the fracture path indicated by a dashed line in the welds. (e) Relation between pin rotation speed and joint tensile strength.W-17
In an investigation carried out by K. Chen, the relationship between axial plunge force and process temperature during friction stir spot welding of the Al6061 with TRIP 780/800 steel is evaluated.C-12 It was reported that increase in the plunge speed leads to larger reaction forces and lower peak temperature as shown in Figure 13. The bonding mechanisms during the process involve, mechanical interlock and chemical bonding. Moreover, it was reported that Zn coating can enhance the joint quality during friction stir spot welding process.
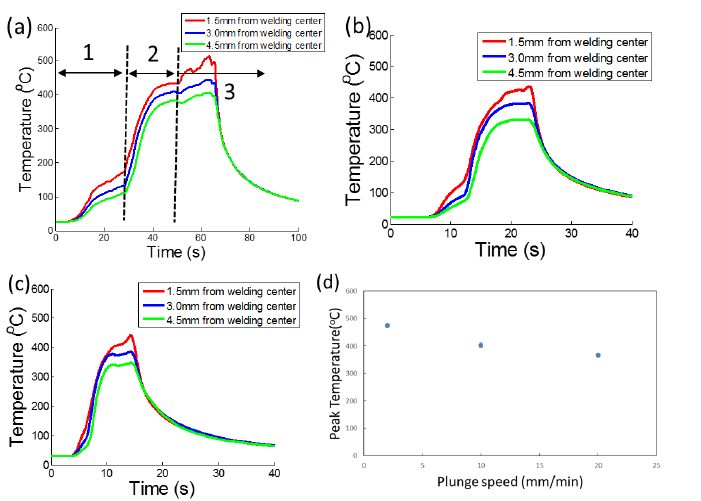
Figure 13: Temperature profile with different plunge speeds: (a) 2 mm/min, (b) 10 mm/min, (c) 20 mm/min, and (d) peak temperature with different plunge speeds).C-12
Diffusion Bonding
In diffusion bonding, sheets to be joined are placed against each other under a vacuum or an inert gas. At the faying surfaces, bonding is attained via diffusion due to difference in the chemical concentration. Diffusion bonding process can be accelerated by operating the process at higher temperatures. This process is not suitable for the direct joining of the aluminum and steel, however with assistance of interlayer a sound weld can be obtained via this process. Bhanumurthy has used interlayer in the Al/Zn/Cu/Ag–Ag/Cu/Ni/SS interlayer pattern to minimize metallurgical incompatibilities for the joining of the aluminum alloys with the stainless steels.B-7 All the layers were deposited electrochemically. 304 stainless steel and pure aluminum (99.8 & pure) were used in this study (10 x 5 x 4 mm). The whole assembly was placed in vacuum (10‑3 Pa) at a heating rate of 300 k h-1. Temperature range of 250 oC to 550 oC and time duration of 1h to 4h under a pressure of 50 MPa was evaluated in this study.
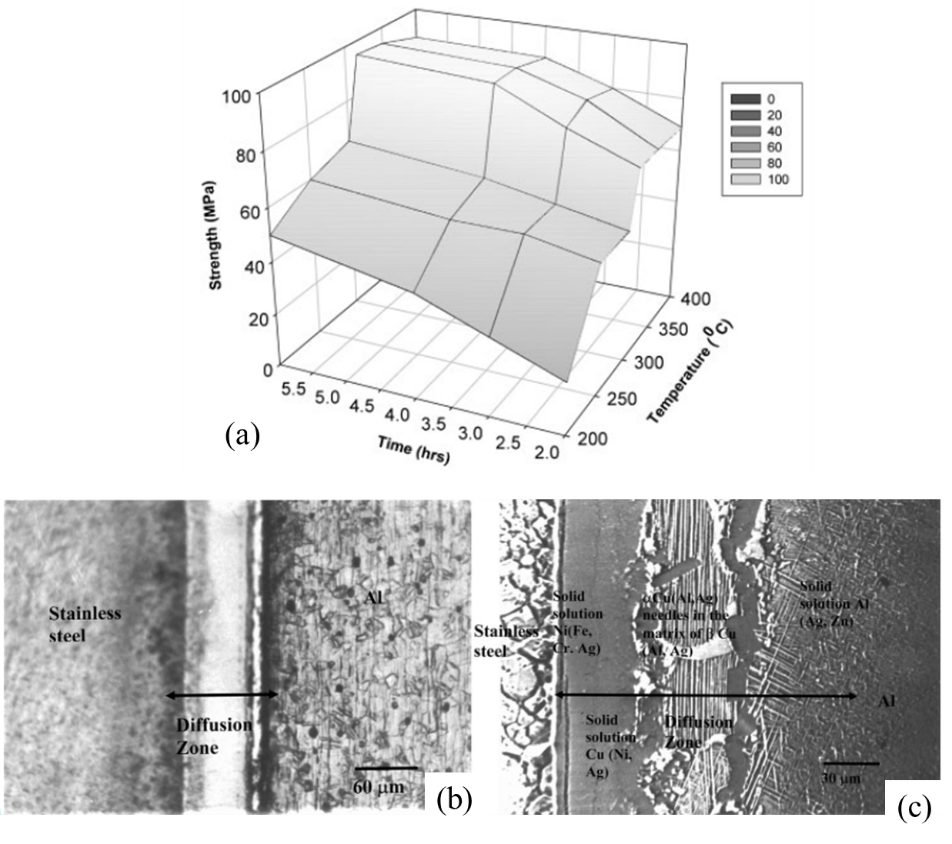
Figure 14: (a) Bond strength data for cylindrical specimens with variation in bonding time and temperature. Optical micrograph for specimen bonded at (b) 450 oC and (c) 550 oC for 4 h. B-7
Diffusion bonding done at 315 oC for 4 h have shown maximum strength of ~90 MPa. Specimens bonded at 300 oC failed at the Ag/Ag interface. Maximum diffusion width was 19 µm at 350 oC for 4 hours. Overall, the diffusion bonding process was found to be a strong function of the surface preparation and diffusivities of the bordering species.
Resistance Spot Welding
In a comprehensive analysis carried out by Sigler and Carlson, hindrances occurred between the joining of aluminum and steel alloys via resistance spot welding process and approaches were established to overcome those challenges.S-33 Main challenges include, the difference in the melting temperature, formation of intermetallic compounds and natural oxide layers. 1.2-mm 6022T4 aluminum alloy, 1.0, 1.5- & 2.0-mm low carbon steel sheets were evaluated in this study. Configuration of lap shear test and couch peel test is shown in Figure 15A. Multiring doom electrode patented by General Motors were used in this study. Figure 15B shows the joint formed between 1.2-mm Al6062 aluminum alloy and 1.5 mm steel sheet at 3.6 kN and 14 kA current. Welding times were 200, 400, 600 and 800ms, with 45ms pulse and cool time of 5ms between pulses. Weld performed at 200ms are not shown in this report due to insufficient strength. Both shrinkage and gas porosities were observed at each time condition. At higher time, porosities join together to form bigger porosities and these was no increase in the bond length form 600ms to 800ms.
![Figure 15: (A) Configuration of Lap-Shear and Coach-Peel Mechanical Test Specimens ,(B) Weld Microstructures for a 1.2-mm AA6022-T4 (top sheet) to 1.5-mm HDG LCS (bottom sheet) Stack-Up Welded using MRD Electrodes at 800 lb and 14 kA , (C) Secondary and Back-Scattered Electron Image (BEI) Micrographs [secondary electron images (SEI) left and BEI right] of the Al-Side Weld Fracture Surfaces for 1.2-mm AA6022-T4 to 1.5-mm HDG LCS Stack-Up Welded at 800-lb Clamping Force and 14-kA Welding Current, (D) Coach-Peel and Lap-Shear Mechanical Properties for (a) 1.2-mm AA6022-T4 Welded to 1.0-mm HDG LCS and (b) 1.2-mm AA6022-T4 Welded to 2.0-mm HDG LCS [, & (E) Coach-Peel and Lap-Shear Mechanical Properties for Coupons of Zn-Coated 1.2-mm AA6022-T4 to 1.0-mm HDG LCS Stack-Up Welded at 800 lb, 250 ms, and 16 kA.S-33](https://ahssinsights.org/wp-content/uploads/2020/09/image029.jpg)
Figure 15: (A) Configuration of Lap-Shear and Coach-Peel Mechanical Test Specimens ,(B) Weld Microstructures for a 1.2-mm AA6022-T4 (top sheet) to 1.5-mm HDG LCS (bottom sheet) Stack-Up Welded using MRD Electrodes at 800 lb and 14 kA , (C) Secondary and Back-Scattered Electron Image (BEI) Micrographs [secondary electron images (SEI) left and BEI right] of the Al-Side Weld Fracture Surfaces for 1.2-mm AA6022-T4 to 1.5-mm HDG LCS Stack-Up Welded at 800-lb Clamping Force and 14-kA Welding Current, (D) Coach-Peel and Lap-Shear Mechanical Properties for (a) 1.2-mm AA6022-T4 Welded to 1.0-mm HDG LCS and (b) 1.2-mm AA6022-T4 Welded to 2.0-mm HDG LCS, and (E) Coach-Peel and Lap-Shear Mechanical Properties for Coupons of Zn-Coated 1.2-mm AA6022-T4 to 1.0-mm HDG LCS Stack-Up Welded at 800 lb, 250 ms, and 16 kA.S-33
Figure 15C shows the SEM of the fractured surfaces. At 200ms porosities were star shaped with arms extending towards periphery of the nugget. Increasing time leads to shorter thicker and fewer porosities. It is an indication of the consolidation of porosities towards the center. Here dark grey features are an indication of the aluminum. Figure 15D shows the comparison of lap shear strength at various conditions. Maximum lap shear strength is observed between 1.2-mm aluminum sheet and 2-mm steel sheet i.e. 64% higher than that of aluminum spot welds. Lower mechanical strength is attributed to discontinuities that could be gas and shrinkage porosities. Moreover Figure 15E shows the effect of the Zn coating on the aluminum. Higher peel strength was observed in the presence of the Zinc coatings. It was summarized in this study that the main reason for the poor mechanical properties is shrinkage and gas porosities. Removing aluminum oxide layer and replacing it with zinc layer can help in the elimination of the defects. Moreover, using multiple weld schedules can also improve weld joint quality.
Other investigations carried out at The Ohio State University and Edison Welding Institute, researchers have utilized capacitor discharge power for creating resistance spot welds between aluminum and steel.G-16 The main objective is to minimize the time through which the current is delivered in the sheets to minimize the growth of the intermetallic layer. Figure 16a shows the shape of the current waveform delivered in 15ms. Figure 16b shows the increase in the mechanical strength as a function of increasing current value.
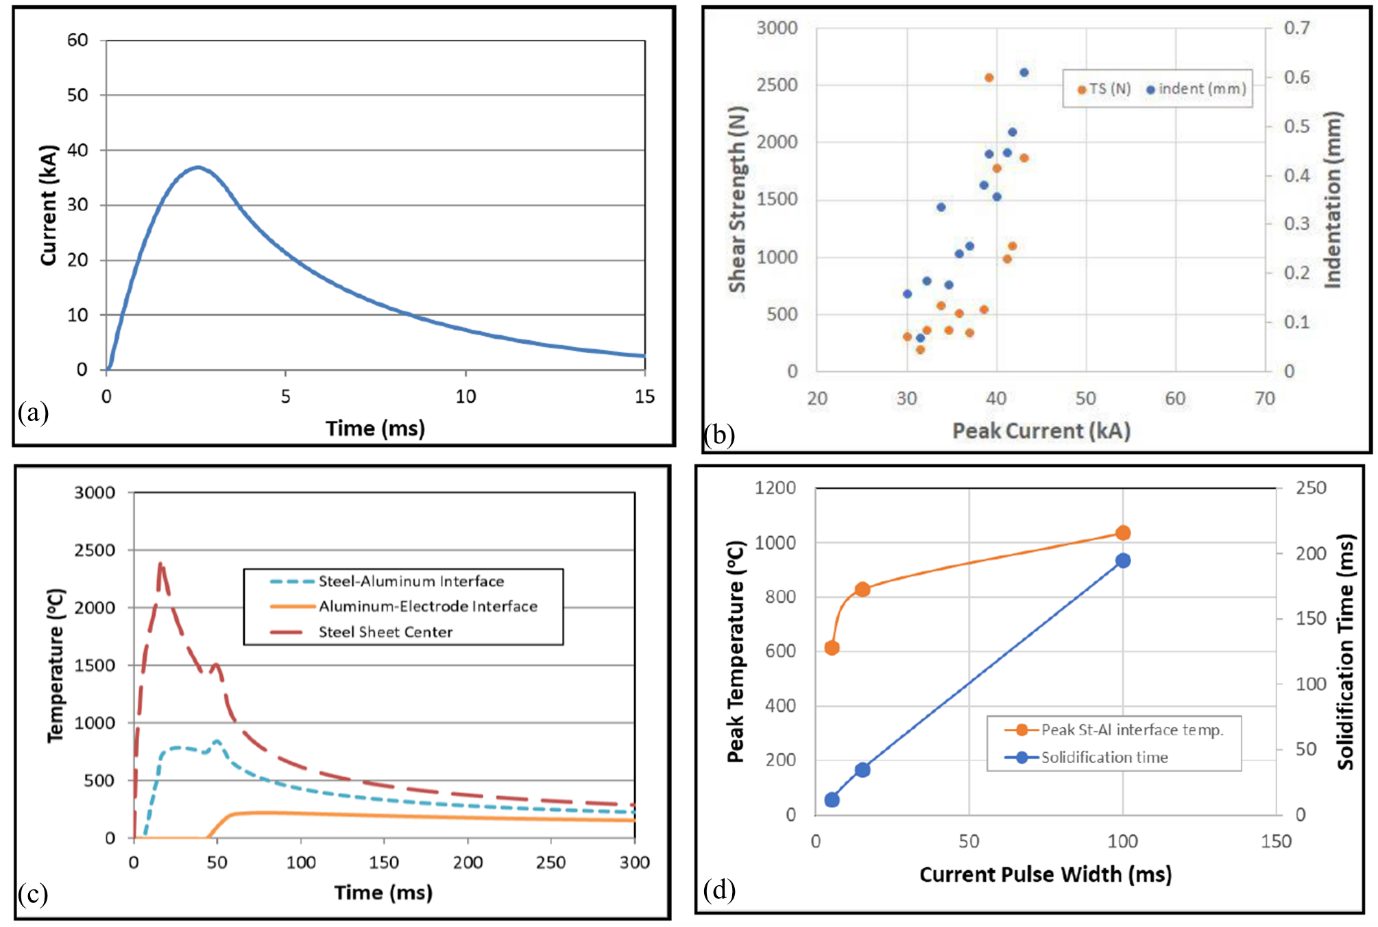
Figure 16: (a) Current waveform for a weld made with the 75:1 turns ratio, (b) Current-range curve for welding with the 75:1 turns ratio ,(c) Estimated thermal profiles for an al-to-steel spot weld made with a 15-ms pulse width & (d) Peak temperature and solidification time for the al weld nuggets as a function of pulse width.G-16
Thermal profiles were measured at multiple interfaces (Figure 16c) and Figure 16d show the variation in the peak temperature as the function of the current pulse width, which increases in direct proportion. Overall, using capacitor discharge power resulted in separate nuggets and narrower pulse widths. At 5ms, 3-5% weld indentation was observed on the aluminum side with no weld discontinuities. Longer weld time takes more solidification time and wider pulse widths resulted in thicker intermetallics layer.
Hybrid Welding Processes
To improve the dissimilar material joining processes, some studies have reported hybrid welding processes. One such work is carried out by J. Gould from Edison Welding Institute, during which resistance welding and linear friction welding process is utilized.G-17 Low force friction welding process is reported and configuration of the setup is based upon the resistance butt welding frame coupled with hydraulic systems to provide linear motion during the process (Figure 17). Figure 17b shows the tensile results carried out at 30 kA and peak strength was observed near 450 MPa with highest number of translations and upset distance (4130-4130 steel sheets). No melting was observed at any of these parameters. For Al6061 aluminum alloy welding parameters were modified as shown in Figure 17c. Linear motion was varied from 2 mm to 4 mm. Peak strength was observed at 4 mm displacement. Strain map was developed for a steel sheet and it shows that to achieve the required amount of strains, significant upset is required during the process. Using this competitive process, less than 1/5 contact pressure without melting is reported compared to conventional process. This hybrid process reduces the frequency and translation required during friction welding process.
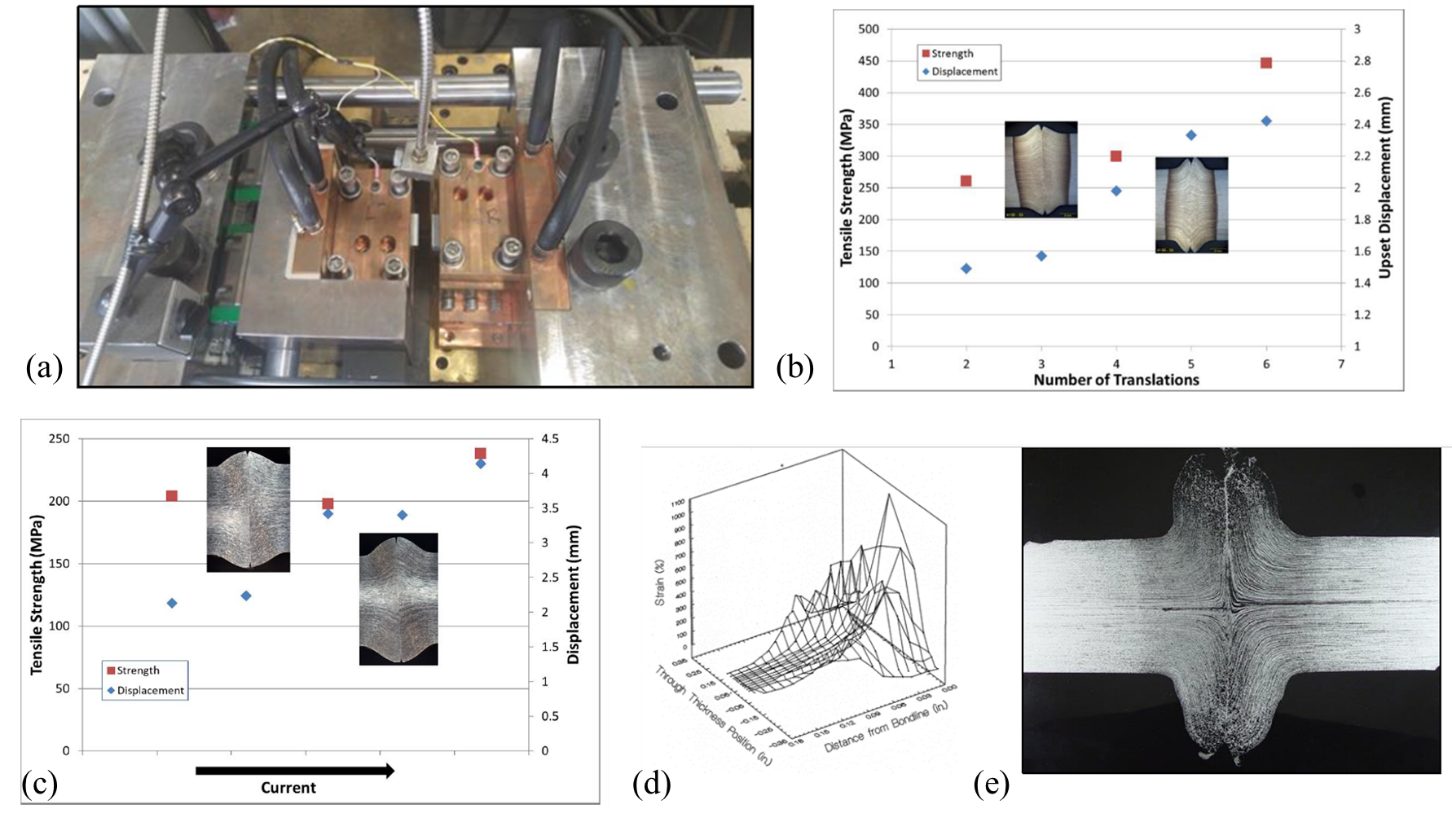
Figure 17: (a) Details of the tooling pack used to accomplish low-force friction welding. (b) Sample process window plot for steel joints made using increasing numbers of translational actions. (c) Process window plot showing variations in aluminum joints made using increasing current. (d) Two-dimensional strain map taken from a flash-butt weld on 6-mm-thick steel. (e) Flash-butt weld cross section corresponding to the strain map.G-17
Y. Lu and co-workers L-17 developed the ultrasonic plus resistance spot welding process (U+RSW). In this process, a thin aluminum sheet was joined with a steel sheet via ultrasonic welding, followed by the RSW between the aluminum side of previously sheet and an additional aluminum sheet as shown in Figure 18. In this study they have used 1-mm-thick AA6061-T6 to 0.9-mm-thick AISI 1008 steel with 0.4-mm-thick AA6061-T6 as the insert.
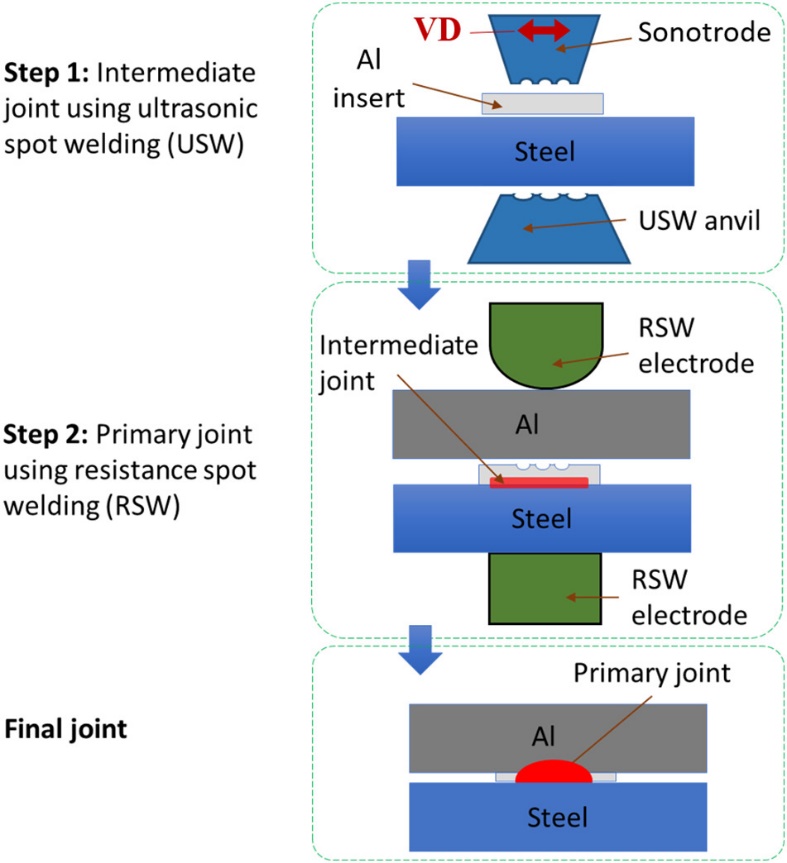
Figure 18: Schematic diagram of U + RSW process. VD is the sonotrode’s vibration direction for USW of intermediate joint.L-17
U+RSW method has shown improved mechanical properties, (Figure 19) tensile shear strength and, energy absorbed prior to failure. It has shown relatively thin intermetallic layer.
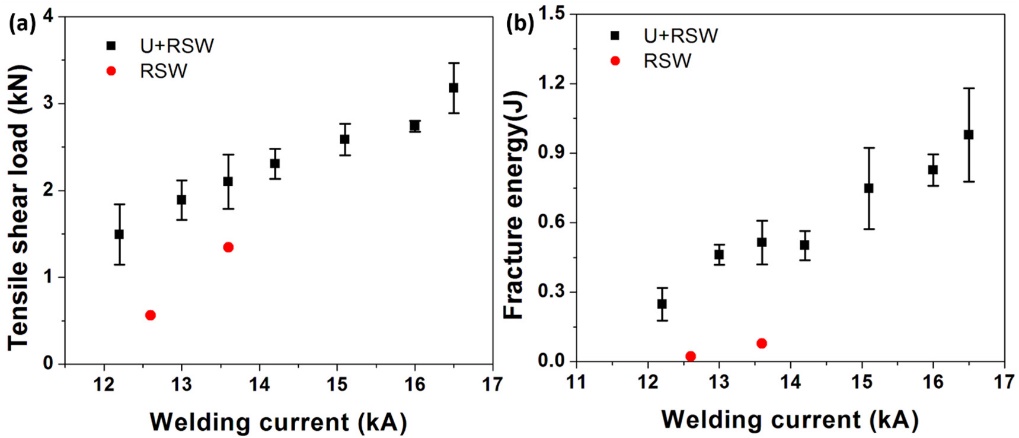
Figure 19. Effect of welding current on tensile shear strength and fracture energy of welded dissimilar joints of AA6061 to AISI 1008 steel. The welding time and the electrode force for RSW were kept constant at 0.083 s and 3.56 kN, respectively.L-17
Another research group has developed ultrasonic resistance welding process (URW), that apply in situ ultrasonic waves during the resistance spot welding process. S-17 The schematics of the process is shown in the Figure 20. Al-6061T6 and electrogalvanized TRIP-780 with dimensions of 70Lx25Wx1.6T mm3 and 70Lx25Wx1.3T mm3 respectively were used in this study.
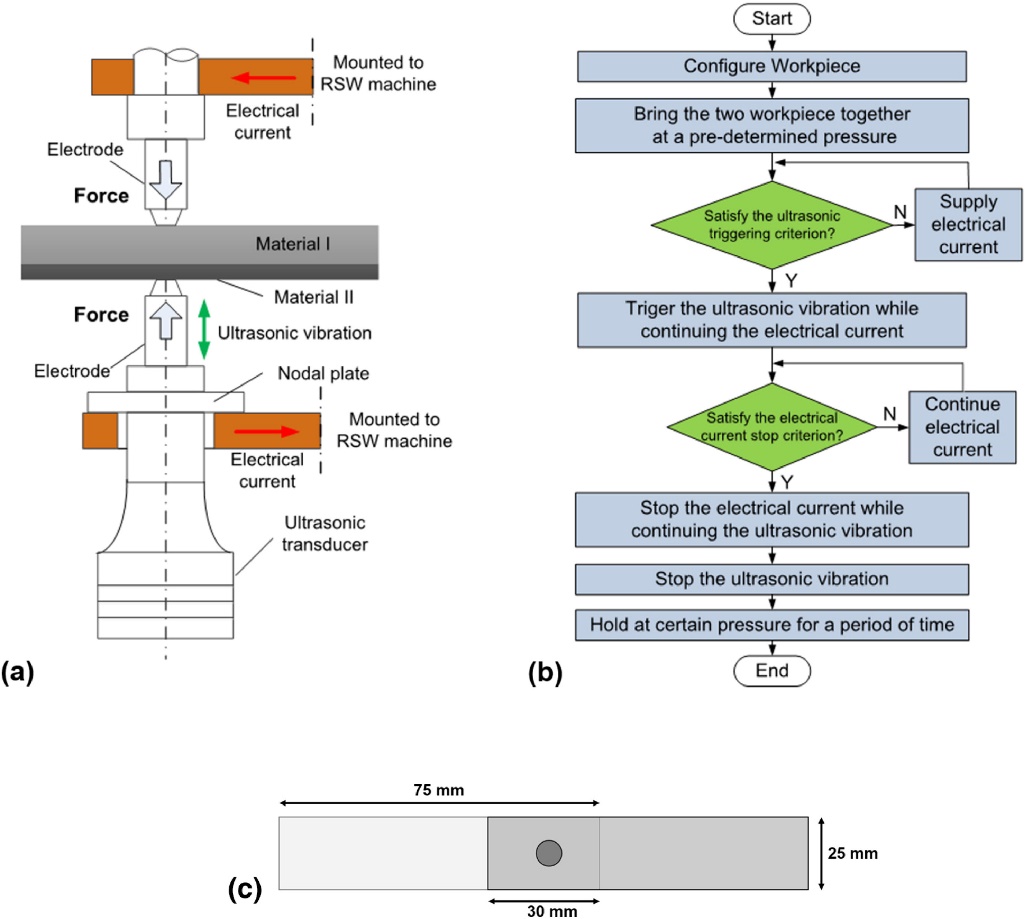
Figure 20. URW Setup (a) Schematic illustration; (b) Flowchart of the URW process.S-17
URW process have shown improved mechanical properties and defect free interface compared to RSW process. In situ ultrasonic vibration facilitated the breakdown of the surface oxide and contaminants, which modifies contact resistance and heat generation rate accordingly. If melting occurs, ultrasonic vibration promoted wetting of the molten aluminum over the steel interface and resulted in the formation defect free fully bonded interface as shown in Figure 22 compares the mechanical properties between the RSW & URW process. Comparing URW with traditional RSW, up to 300% increase in strength and more than 150% increase in displacement to failure is reported. SEM images of the fractured surface revealed that ultrasonic waves eliminated the eggcrate morphology generally observed in RSW welds fractured surface, which is a typical representative of solidification cracking.
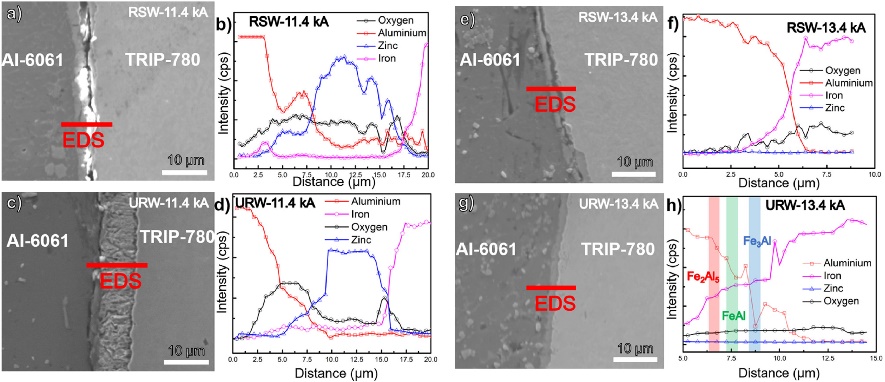
Figure 21. EDS line Scan of Al-6061 & TRIP 780 across interface for RSW at 11.4 kA (a-b) & at 13.4 kA (e-f) and for URW at 11.4 kA (c-d) & at 13.4 kA (g-h).S-17
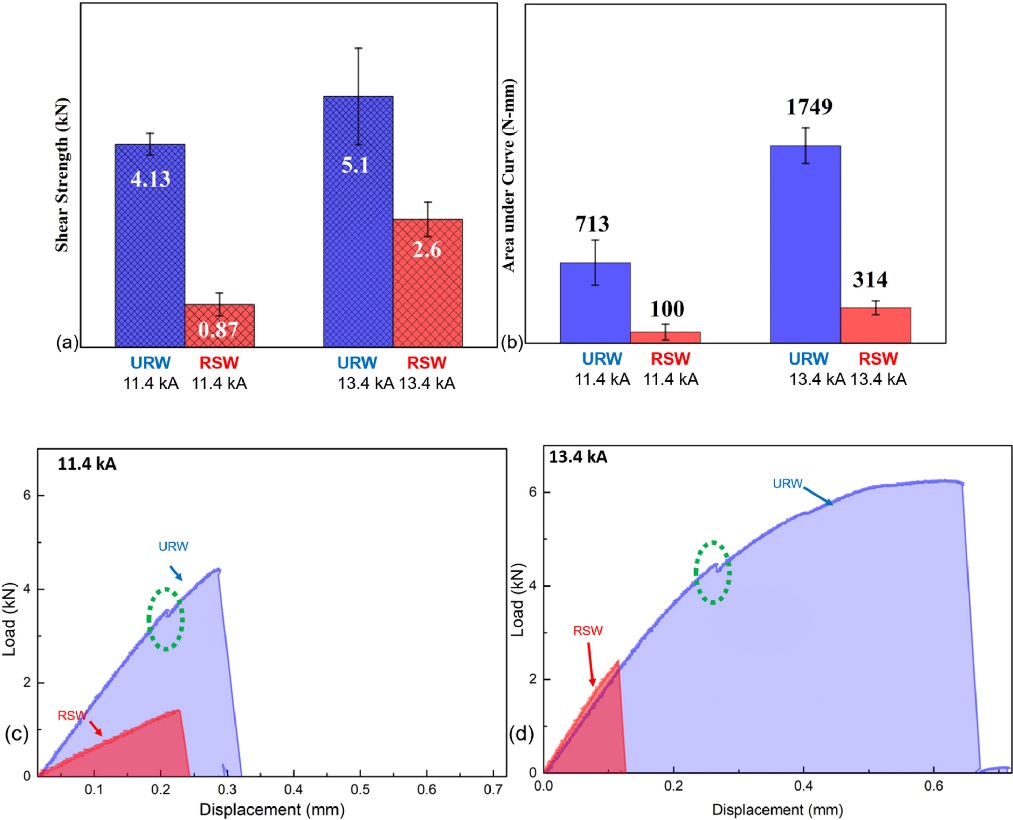
Figure 22: Tensile test results (a) Joint shear strength from 11.4 kA (30 cycles) & 13.4 kA (20 cycles); (b) Energy absorption calculated via area under load-displacement curve for 11.4 kA (30 cycles) & 13.4 kA (20 cycles); (c-d) load-displacement curve for 11.4.S-17
Back To Top
RSW of Dissimilar Steel
This article summarizes a paper entitled, “Higher than Expected Strengths from Dissimilar Configuration Advanced High-Strength Steel Spot Welds”, by E. Biro, et al.B-6
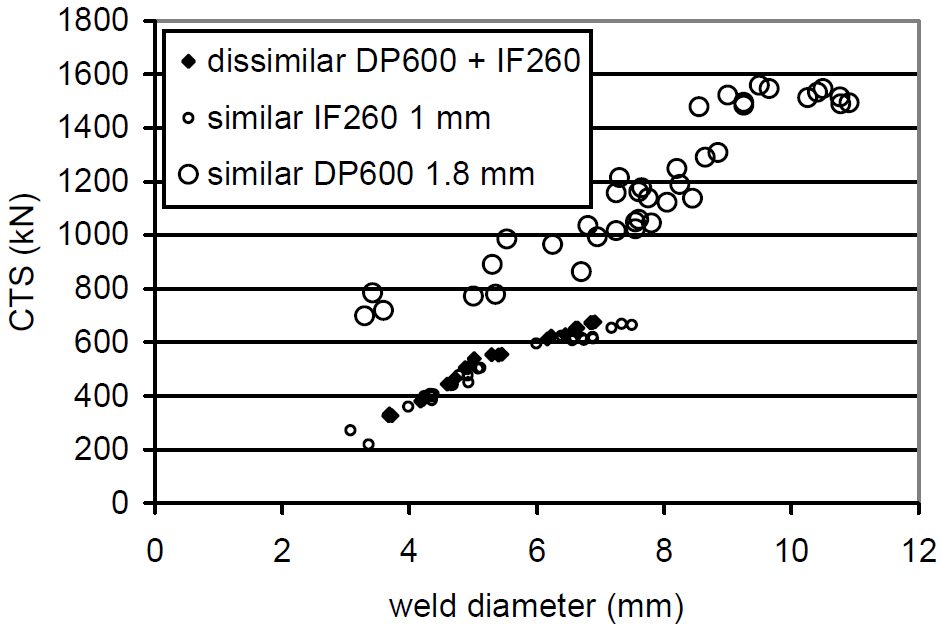
This study shows that the cross tension strength (CTS) is always higher than the strength expected from the lower strength material in the joint. Figure 1 verifies the assumption that the load bearing capacity of a heterogeneous configuration is supposed to equal the minimum strength of both homogenous assemblies. Material used in this study was a 1 mm low carbon equivalent Dual Phase 980 (DP980 LCE) steel.
Figure 1: Example of dissimilar configuration with CTS matching the “minimum rule”.B-6
The materials chosen for this study are in Table 1.
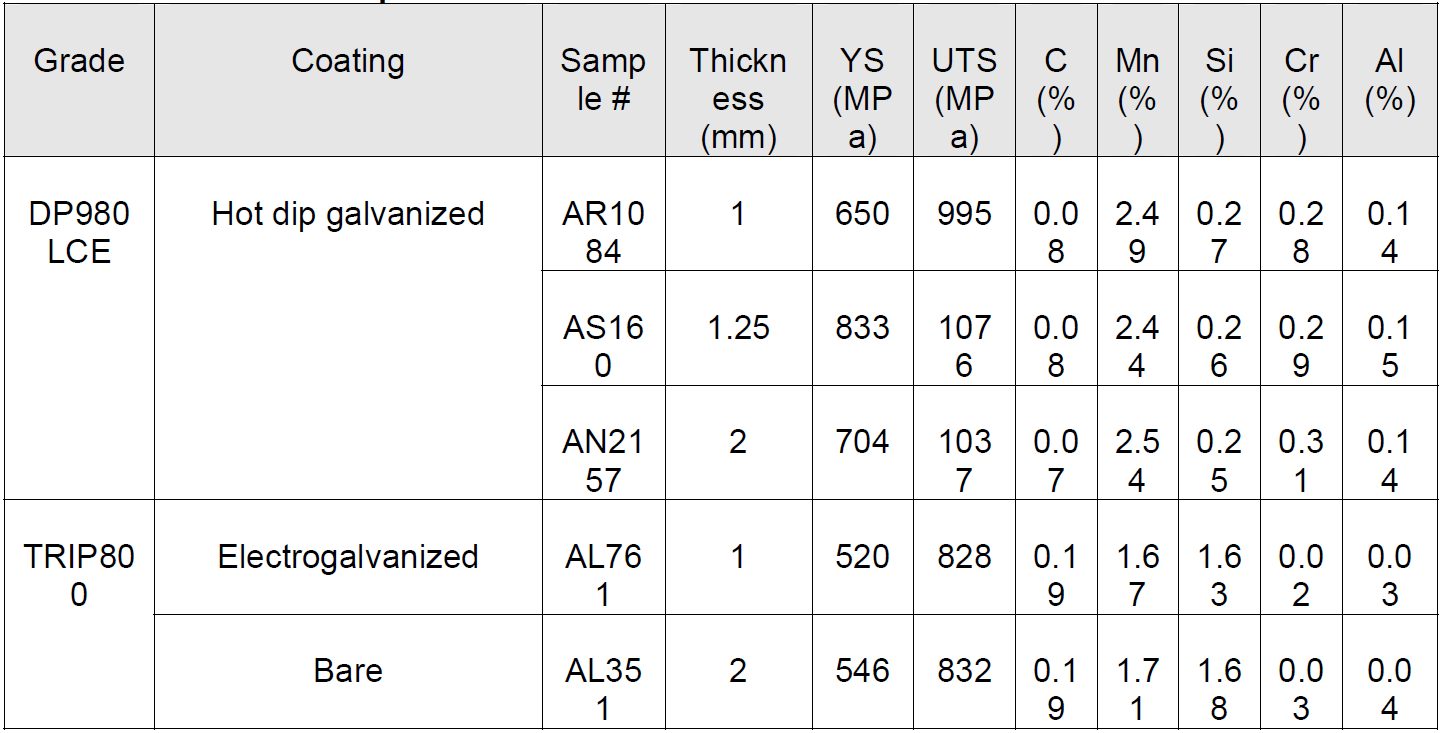
Table 1: Steel sheet samples.B-6
The material thickness combinations for all of the two sheet joints are shown in Table 2.
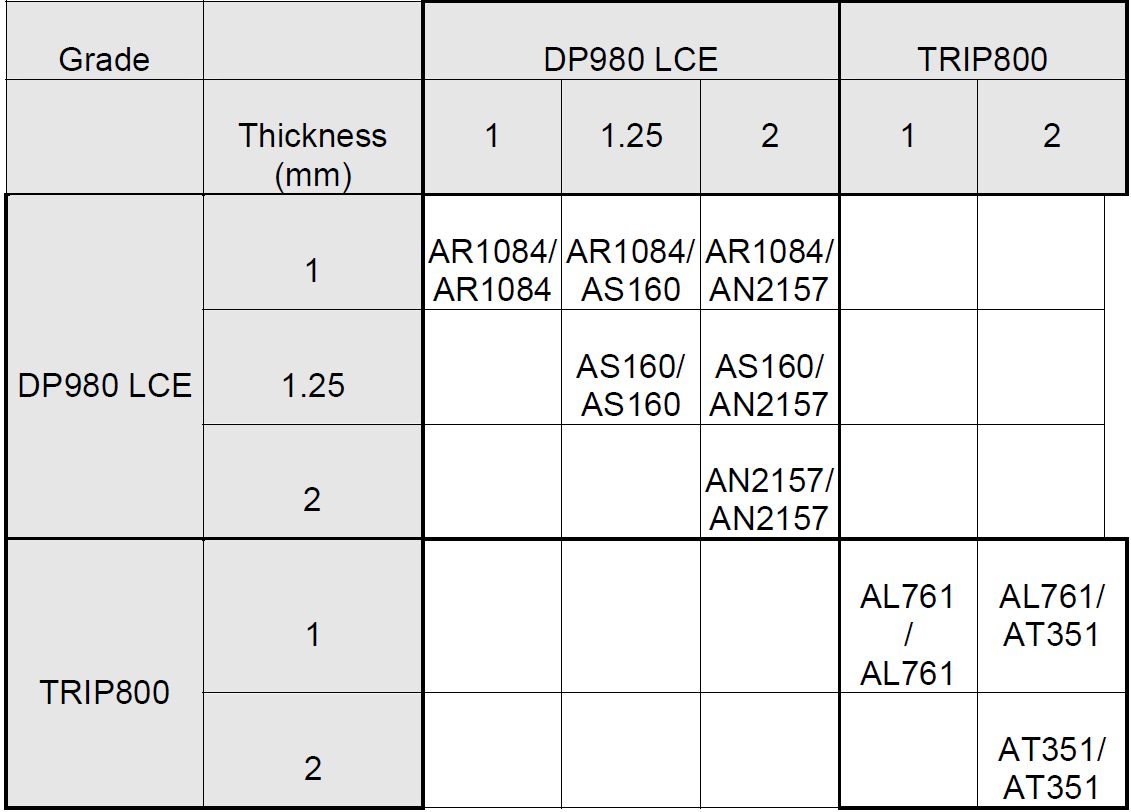
Table 2: Welded 2-sheet configurations.B-6
The three-sheet stackups all were made using the 1 mm DP980 LCE. These configurations were designed to understand what happens in such cases, knowing that three-sheet welding is very common in car body manufacturing. The three-sheet stackup configurations are shown in Figure 2 and are as were follows:
- a square DP980 coupon (patch) is inserted between the two classical cross-tension coupons for welding (1+patch+1 mm);
- two coupons oriented the same way welded with one coupon oriented in the transverse direction to form a cross-tension sample (1+[1+1] mm);
- same configuration as a) but the external coupon is removed by manual torsion before cross-tension testing (1+1+0 mm);
- same configuration as a), but the two coupons oriented the same way are first spot welded together strongly (with several spots) in the extremities, before the actual 3-sheet spot weld is done ([1++++1]+1 mm).
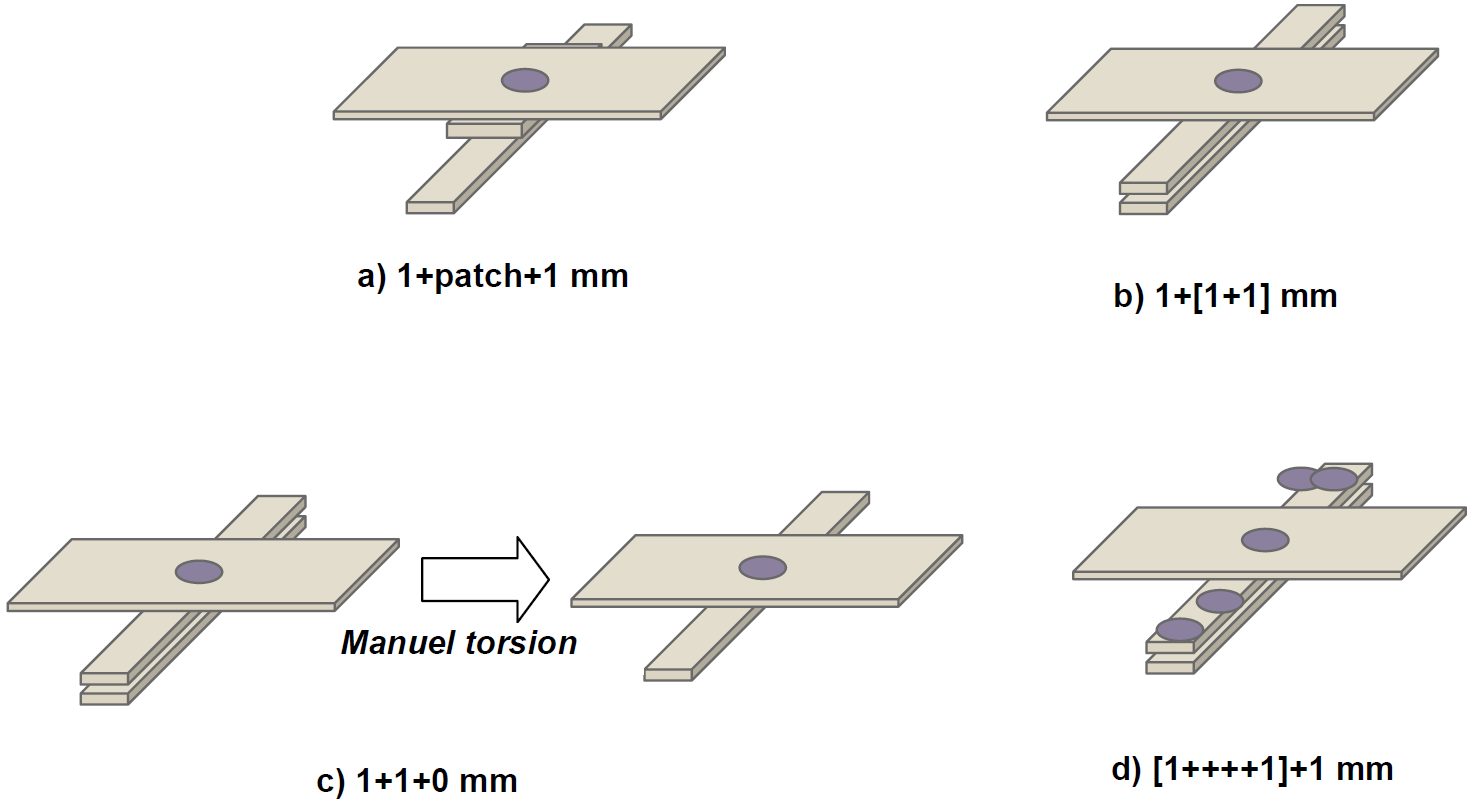
Figure 2: Three-sheet configurations based on 1mm DP980 LCE sample.B-6
The welding parameters for each configuration are listed in Table 3.
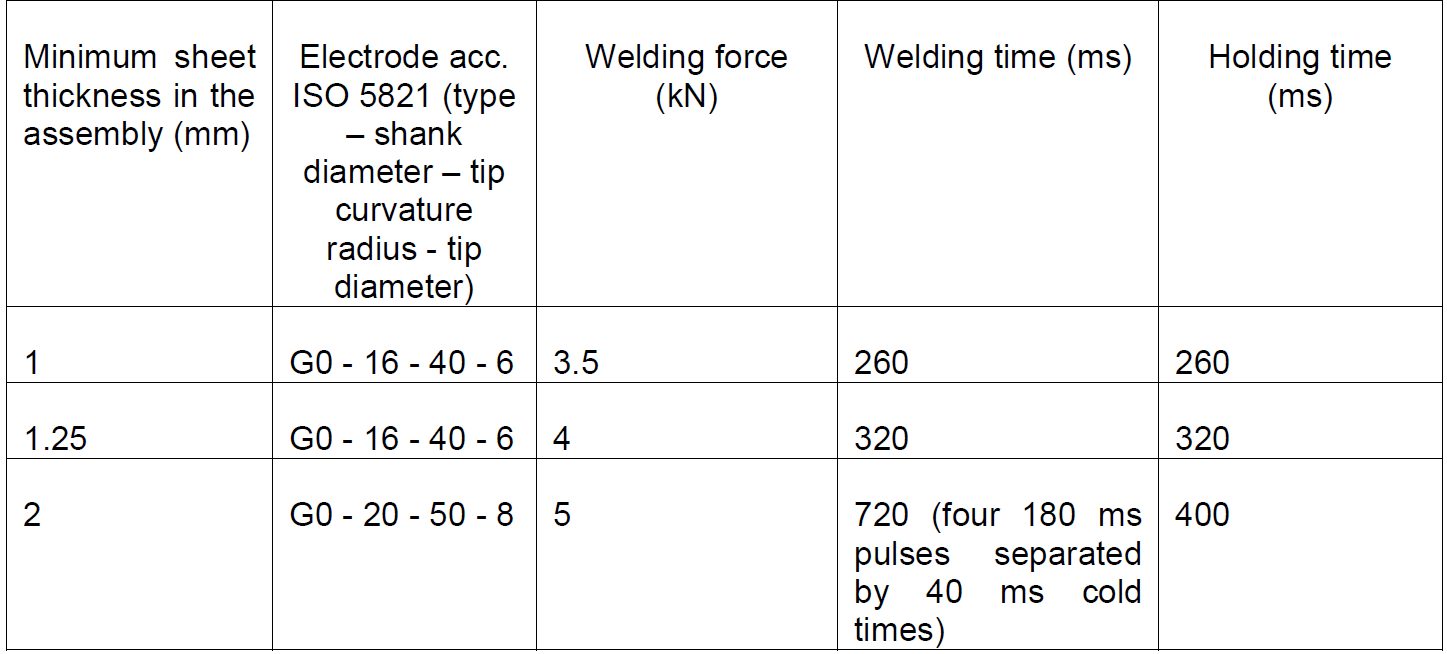
Table 3 : Welding parameters.B-6
CTS is strongly dependent on weld diameter (Figure 3).
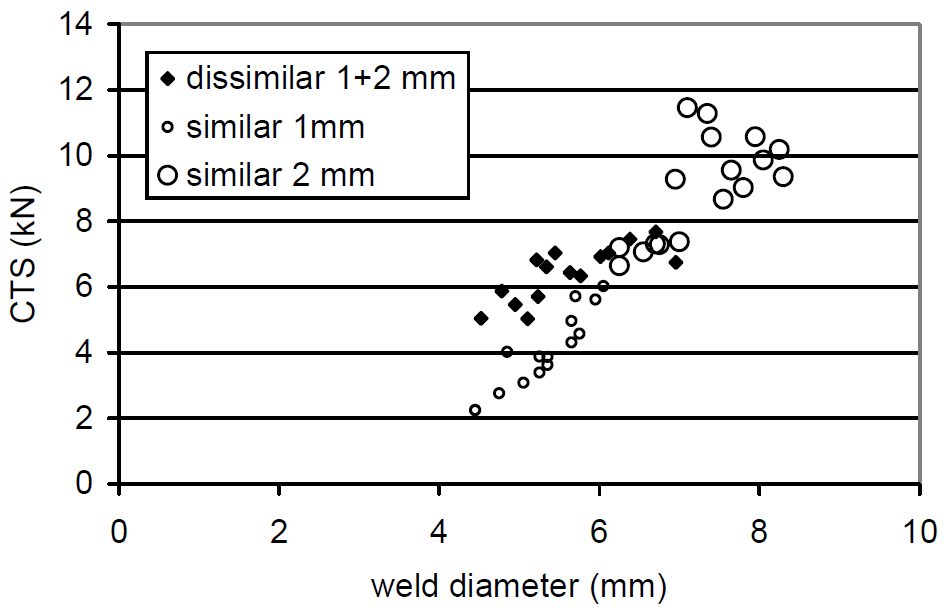
Figure 3: Cross-tension Strength for TRIP800 configurations.B-6
CTS for the main DP980 configurations are shown as a function of weld diameter in Figures 4 and 5.
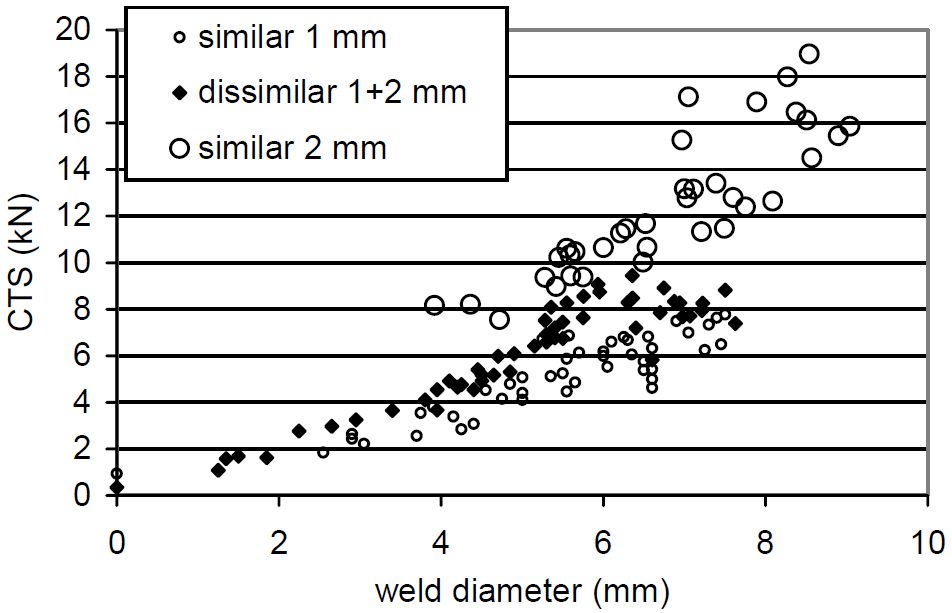
Figure 4: Cross-tension Strength for DP980 1+1, 1+2 and 2+2 configurations.B-6
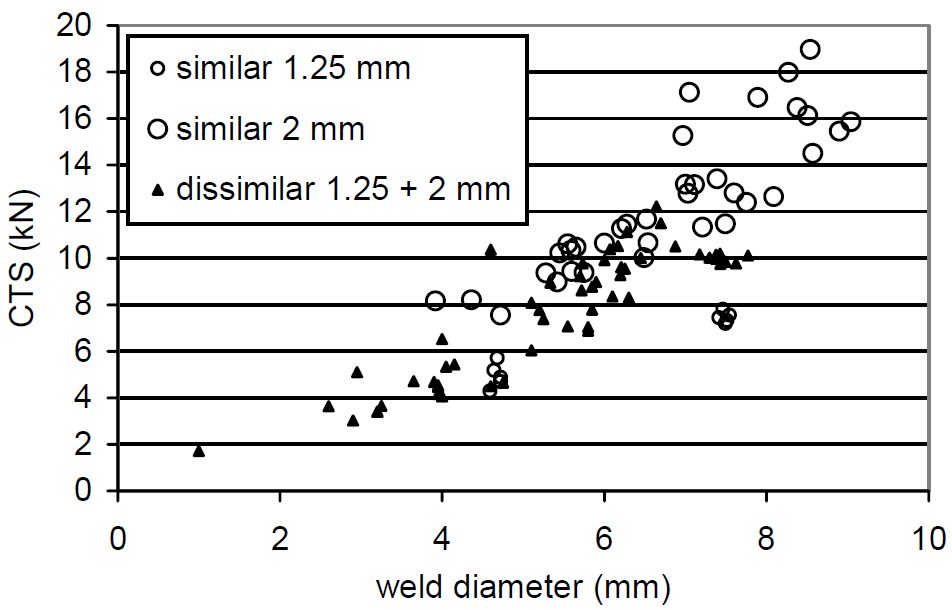
Figure 5: Cross-tension Strength for DP980 1.25+1.25, 1.25+2 and 2+2 configurations.B-6
The three-sheet configurations based on 1mm DP980 LC results are shown in Figures 6 and 7. These results again verify that dissimilar configuration performances appear above the “minimum rule” assumption described in Figure 1.
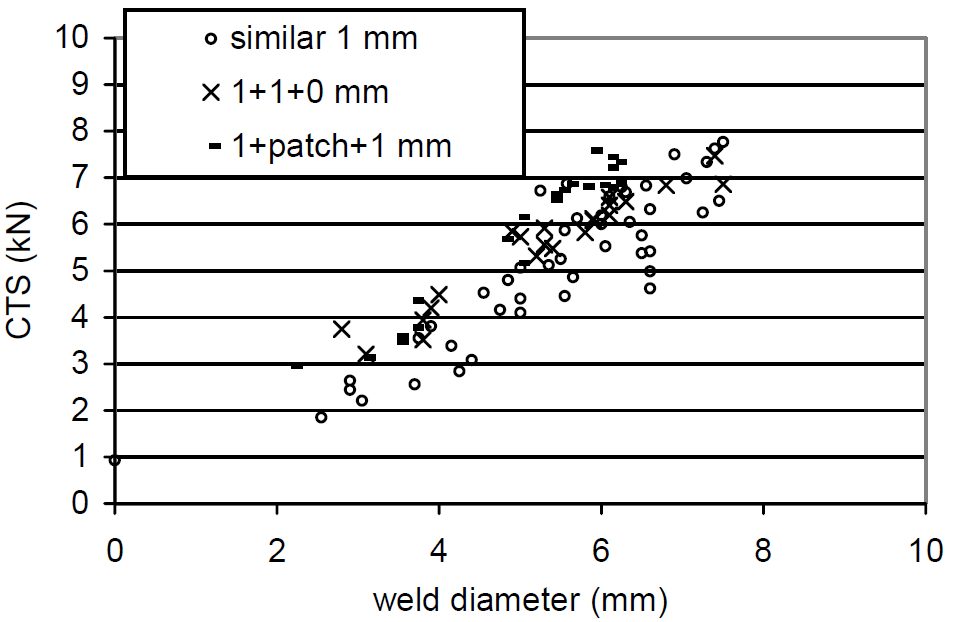
Figure 6: Cross-tension Strength for DP980 1+1, 1+1+0 and 1+patch+1 configurations.B-6
![Figure 7: Cross-tension Strength for DP980 1+1, 1+2, 1+[1+1]and [1+++1]+1 configurations.](https://ahssinsights.org/wp-content/uploads/2020/07/3114c_Fig7.jpg)
Figure 7: Cross-tension Strength for DP980 1+1, 1+2, 1+[1+1]and [1+++1]+1 configurations.B-6
The observation that CTS is greater than predicted by the “minimum rule” has been called a “positive deviation” from the expected strengths.
This work concluded that while material qualification tests are frequently based on similar welding configurations, real car body applications are quite systematically dissimilar configurations. For spot welds failing in plug mode, the strength of the assembly only depends on the weakest material strength. In case of AHSS+AHSS welded combinations, however, things turn out to be different. Similar grade but dissimilar thickness High-Strength Steel configurations have been spot welded and tested in Cross-Tension. The following main conclusions can be highlighted:
- For dissimilar thickness configurations, the cross-tensile strength is above the standard “minimum rule” assumptions, this phenomenon being called a “positive deviation”;
- Limited thermal and notch location effects can explain part of this positive deviation, but the main reason is mechanical;
- As evidenced through several analytic and numerical studies, this mechanical effect is due to the less severe local stresses at the notch in case of uneven thickness, and improves the positive deviation when the thickness ratio increases. Although widely used for material qualification and scientific purposes, similar configurations appear as the worst case in terms of cross-tension performance for high strength steels. Actual vehicle design should consider positive deviation in dissimilar configurations to maximize the potential strength of spot welds in High-Strength steels.
Resistance Spot Welding
Parameter Guidelines
In summary, Tables 1 and 2 provide the AWS C1.1 Spot Welding Parameter Guidelines link to Recommended Practices for Resistance Welding. These general guidelines can be used to approximate which parameters can be used to begin the Resistance Spot Welding (RSW) process of a specific part thickness. From the recommended parameters, changes can be made on a specific stack-up to ensure an acceptable strength and nugget size for a particular application. Additionally, more complicated RSW parameter guidelines using a pulsation welding schedule with AC 60 Hz for welding AHSS is included in Table 3.
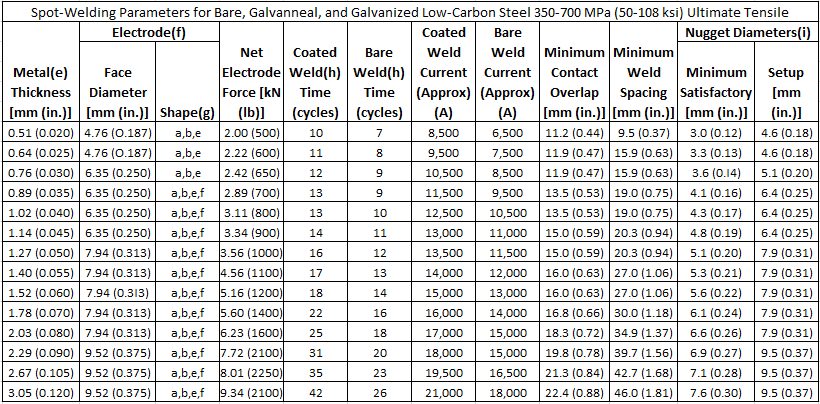
Table 1: Spot welding parameters for low-carbon steel 350-700 MPa (AHSS).A-14
- Use of coated parameters recommended with the presence of a coating at any faying surface.
- These recommendations are based on available weld schedules representing recommendations from resistance welding equipment suppliers and users.
- For intermediate thicknesses parameters may be interpolated.
- Minimum weld button shear strength determined as follows:
- ST = ((-8.83×10⁻⁷ × S2 + 1.34×10⁻³ × S + 1.514) × S × 4t1.5)/1000
- ST = Shear Tension Strength (kN)
- S = Base Metal Tensile Strength (MPa)
- t = Material Thickness (mm)
- Metal thicknesses represent the actual thickness of the sheets being welded. In the case of welding two sheets of different thicknesses, use the welding parameters for the thinner sheet.
- Welding parameters are applicable when using electrode materials included in RWMA Classes 1 , 2, and 20.
- Electrode shapes listed include: A-pointed, B-domed, E-truncated, F-radiused. Figure 2 shows these shapes.
- The use of Type-B geometry may require a reduction in current and may result in excessive indentation unless face is dressed to specified diameter.
- The use of Type F geometry may require an increase in current.
- Welding parameters are based on single-phase AC 60 Hz equipment.
- Nugget diameters are listed as:
- Minimum diameter that is recommended to be considered a satisfactory weld.
- Initial aim setup nugget diameter that is recommended in setting up a weld station to produce nuggets that consistently surpass the satisfactory weld nugget diameter for a given number of production welds.
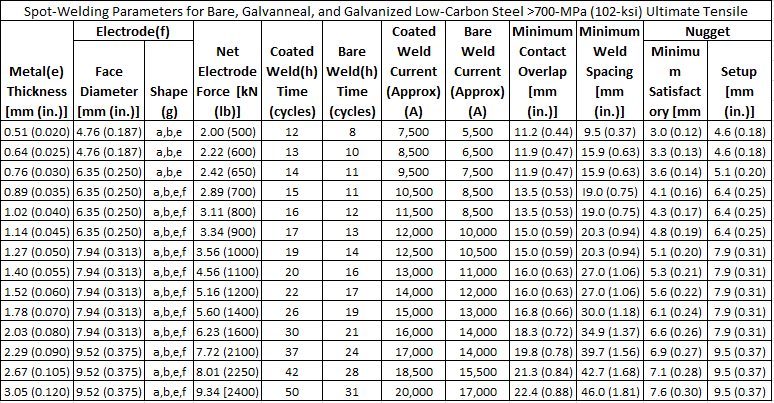
Table 2: Spot welding parameters for low-carbon steel >700 MPa (AHSS). A-14
- Use of coated parameters recommended with the presence of a coating at any faying surface.
- These recommendations are based on available weld schedules representing recommendations from resistance welding equipment suppliers and users.
- For intermediate thicknesses parameters may be interpolated.
- Minimum weld button shear strength determined as follows:
- ST = ((-8.83×10⁻⁷ × S2 + 1.34×10⁻³ × S + 1.514) × S × 4t1.5)/1000
- ST = Shear Tension Strength (kN)
- S = Base Metal Tensile Strength (MPa)
- t = Material Thickness (mm)
- Metal thicknesses represent the actual thickness of the sheets being welded. In the case of welding two sheets of different thicknesses, use the welding parameters for the thinner sheet.
- Welding parameters are applicable when using electrode materials included in RWMA Classes 1, 2, and 20.
- Electrode shapes listed include: A-pointed, B-domed, E-truncated, F-radiused. Figure 2 shows these shapes.
- The use of Type-B geometry may require a reduction in current and may result in excessive indentation unless face is dressed to specified diameter.
- The use of Type F geometry may require an increase in current.
- Welding parameters are based on single-phase AC 60 Hz equipment.
- Nugget diameters are listed as:
- Minimum diameter that is recommended to be considered a satisfactory weld.
- Initial aim setup nugget diameter that is recommended in setting up a weld station to produce nuggets that consistently surpass the satisfactory weld nugget diameter for a given number of production welds.
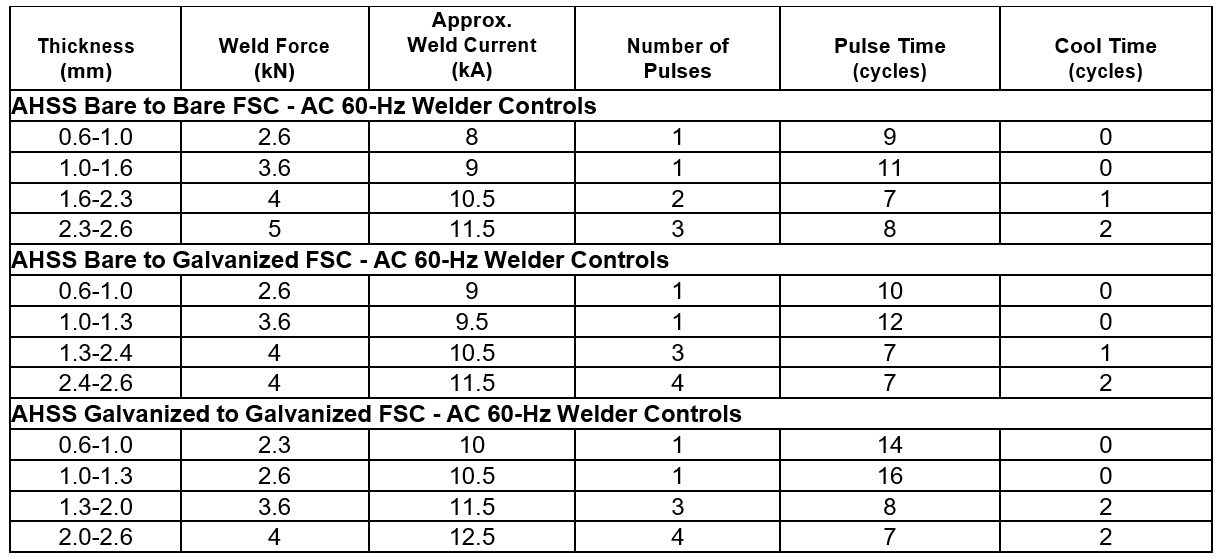
Table 3: AHSS bare-to-bare, bare-to-galvanized, Galvanized-to-galvanized RSW parameters for pulsating AC 60 Hz.A-14
Heat, Material and Thickness Balances
The heat input in Resistance Spot Welding (RSW) is defined as:
Heat Input = I2Rt
where: I is welding current
R is total resistance, and
t is weld time
The heat input must be changed depending on the gauge and grade of the steel. Compared to low strength steel at a particular gauge, the AHSS at the same gauge will need less current. Similarly, the thin gauge material needs less current than thick gauge. Controlling the heat input according to the gauge and grade is called heat balance in RSW.
For constant thickness, Table 1 shows steel classification based on strength level. With increasing group numbers, higher electrode force, longer weld time, and lower current are required for satisfactory RSW. Material combinations with one group difference can be welded with little or no changes in weld parameters. Difference of two or three groups may require special considerations in terms of electrode cap size, force, or type of power source.
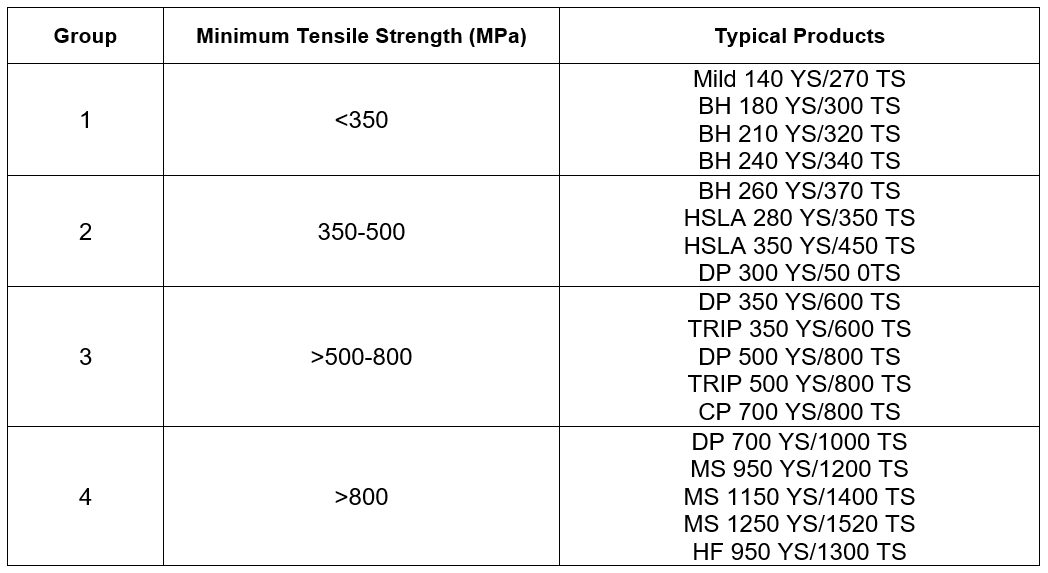
Table 1: Steel classification for RSW purposes.A-11
For a particular steel grade, changes in thickness may require adoption of special schedules to control heat balance. When material type and gauge are varied together, specific weld schedules may need to be developed. Due to the higher resistivity of AHSS, the nugget growth occurs preferentially in AHSS. Electrode life on the AHSS-side may be reduced due to higher temperature on this side. In general, electrode life when welding AHSS may be similar to mild steel because of lower operating current requirement due to higher bulk resistivity in AHSS. This increase in electrode life may be offset in production due to poor part fit up created by higher AHSS springback. Frequent tip dressing will maintain the electrode tip shape and help achieve consistently acceptable quality welds.
Welding Current Mode
AHSS can be welded with power sources operated with either AC or DC types (Figure 1). Middle-Frequency Direct-Current (MFDC) has an advantage over conventional AC due to both unidirectional and continuous current. These characteristics assist in controlling and directing the heat generation at the interface. Current mode has no significant difference in weld quality. It should be noted that both AC and DC can easily produce acceptable welds where thickness ratios are less than 2:1. However, some advantage may be gained using DC where thickness ratios are over 2:1, but welding practices must be developed to optimize the advantages. It also has been observed that nugget sizes are statistically somewhat larger when using DC welding with the same secondary weld parameters than with AC. Some studies have shown that welding with MFDC provides improvements in heat balance and weld process robustness when there is a thickness differential in AHSS (as shown in Figure 2). DC power sources have been reported to provide better power factors and lower power consumption than AC power sources. Specifically, it has been reported that AC requires about 10% higher energy than DC to make the same size weld.L-7
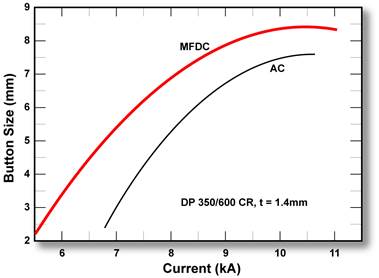
Figure 1: Range for 1.4-mm DP 350/600 CR steel at different current modes with a single pulse.L-2
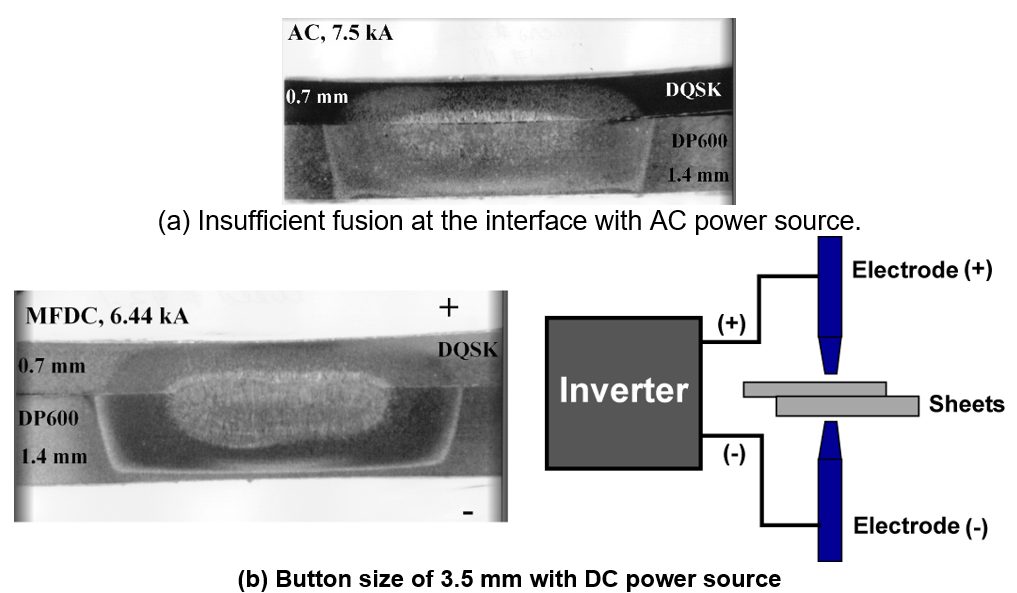
Figure 2: Effect of current mode on dissimilar-thickness stack-up.L-2
Consult safety requirements for your area when considering MFDC welding for manual weld gun applications. The primary feed to the transformers contains frequencies and voltages higher than for AC welding.
Back To Top