S-42
Citation:
S-42. Shih, H., “Friction and Die Wear in Stamping Prephospated Advanced High Strength Steels”. SAE International Journal of Materials and Manufacturing, 2016, 9(2), 481-487.
S-42. Shih, H., “Friction and Die Wear in Stamping Prephospated Advanced High Strength Steels”. SAE International Journal of Materials and Manufacturing, 2016, 9(2), 481-487.
S-34. S.C Saraf and P.S. Bajaj, “Design & Experimentation of Side Impact Beam for Hyundai Verna,” International Research Journal of Engineering and Technology, Volume 4, Issue 6, June 2017, e-ISSN: 2395 -0056.
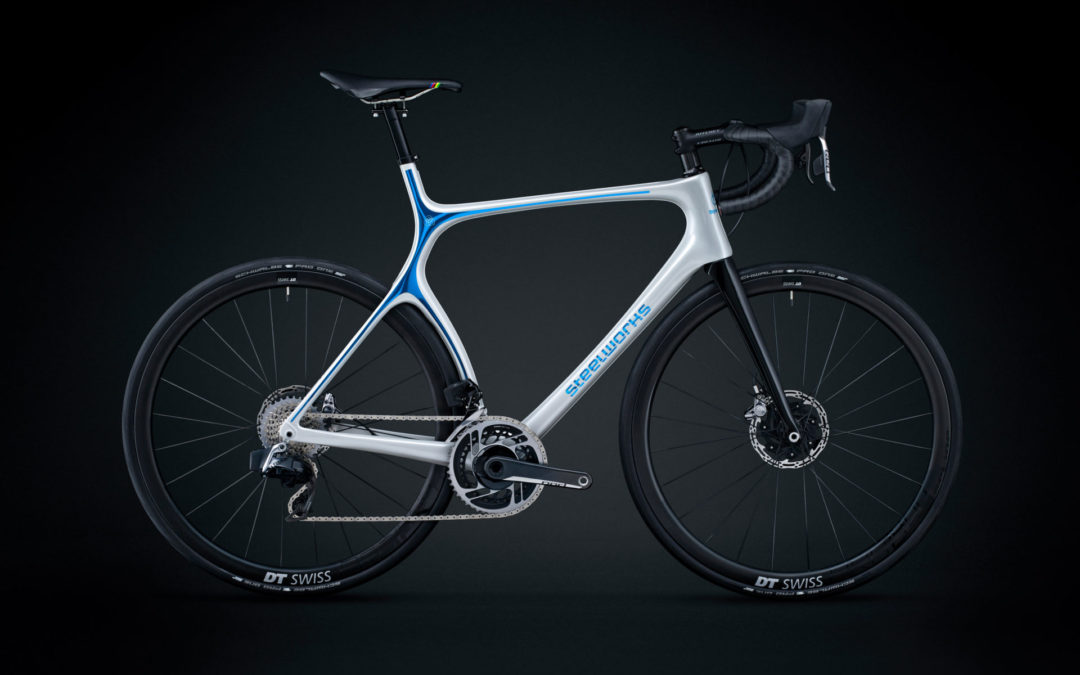
You are most likely wondering why WorldAutoSteel is writing a blog about a bicycle. It is because when we talked to Jia-Uei Chan, Regional Business Development at our member company, thyssenkrupp Steel Europe (TKSe), about the journey of inventing the world’s first Advanced High-Strength Steel road bike, we were incredibly inspired. This is more than a story about a steel bicycle. This is the story of steel innovation, conceived in a WorldAutoSteel members workshop to brainstorm ideas on transforming steel’s image to the sophisticated and advanced material it is. Their journey led to new steel applications, patentable processes, and in the steelworks bicycle, ideas that we think can inspire new automotive applications as well. And anyway, who doesn’t like an inspiring story?
Bikes of this genre have some of the same requirements of modern vehicles: lightweight, strength and durability, affordability, and high performance. To achieve these, the thyssenkrupp steelworks team developed what they called inbike® technology, which combines high-strength steel, half-shell technology and automated laser welding.
The bike frame is made from DP 330/590 steel, used for its cold forming abilities, stamped as thin as 0.7mm. The steel blanks are pressed into a die to form two half-shells in a deep-drawing process.
A major challenge was to bring these two half shells together in such a way that minimized gaps and achieved a tight fit, enabling automated laser welding (this process requires no gaps over 6 meters of contact length), while ensuring that the frame achieves an elegant, seamless look. Enter innovation.
At the stamping plant, the half-shells were fitted with “dimples,” (See Figure 1) tiny bumps on the welding flanges that create channels at the weld seam for the zinc, preventing vaporized zinc from remaining trapped in the seam during subsequent welding. The half shells were then clamped in a special device and shipped to the laser specialist (See Figure 2).
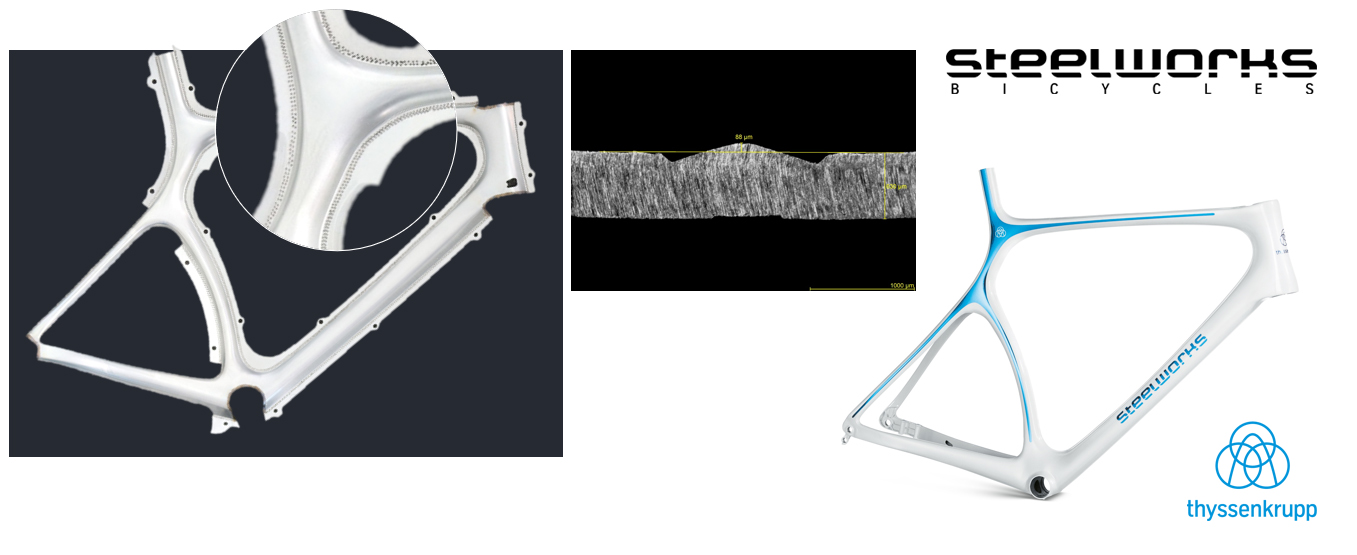
Figure 1: Tiny bumps prevent vaporized zinc from remaining trapped in the seam during subsequent welding.
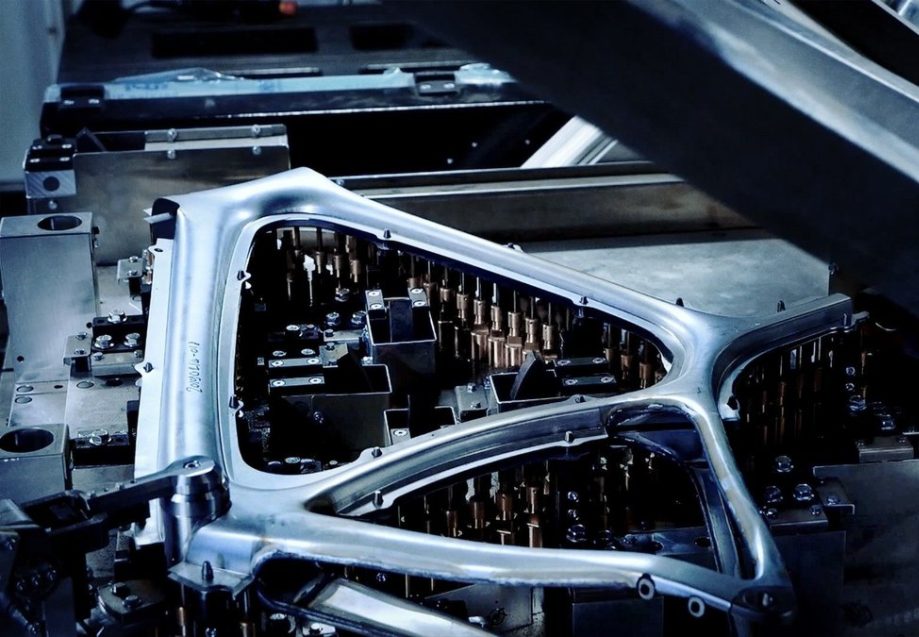
Figure 2: Frame half-shells clamped in the device for laser welding.
The particular challenge lay in the reliable processing and fusing of both frame halves by means of automated laser welding in such a way that no damage to the frame would occur, while also ensuring the weld seam lay as close as possible to the bend radius of the frame halves. The complex frame shape is welded by following a sophisticated trajectory in a 3-D space. After countless continuous improvement exercises, the steelworks team was able to achieve a very flat, elegant weld seam design. This translates into a very stable bike, with a frame that has the needed rigidity in the bottom bracket area to enable high biomechanical power transmission, but with high elasticity in the seat tube configuration to make for an unusually comfortable ride. In comparison, aluminium and carbon fiber bikes are very stiff and characteristic of an unpleasant ride experience.
Tackling a project that is such a reach beyond the norm is never easy. The thyssenkrupp steelworks team repeatedly heard from qualified experts that the project was actually not feasible. At the same time, they had partners who were so fascinated by the challenge that they wanted to make it possible. Chan related to WorldAutoSteel that there were many times when giving up was the more attractive option. Endurance won out. And as it turns out, the half-shell technology invented out of necessity for this bike could find an application in the tough requirements of an electric vehicle battery case.
Says Chan, “We genuinely believed that steel is the perfect material for a road bike. And we wanted to break with convention and make the most out of steel with high-tech engineering.” Have a look at steelworks.bike, and you will undoubtedly agree they did just that.
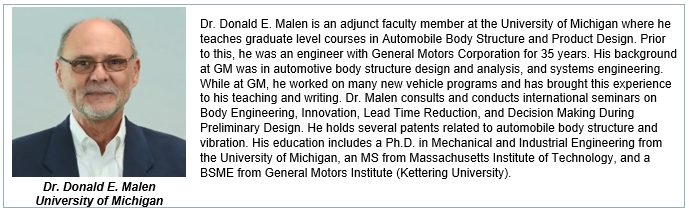
Dr. Donald Malen, College of Engineering, University of Michigan, reviews the use of two recently developed Powertrain Models, which he co-authored with Dr. Roland Geyer, University of California, Bren School of Environmental Science.
The use of Advanced High-Strength Steel (AHSS) grades offer a means to lightweight a vehicle. Among the benefits of this lightweighting are less fuel used over the vehicle life, and better acceleration performance. Vehicle designers as well as Greenhouse Gas analysts are interested in estimating these benefits early in the vehicle design process. G-13
Models are constructed for this purpose which range from the use of a simple coefficient, (for example fuel consumption change per kg of mass reduction), to very detailed models accessible only to specialists which require knowledge of hundreds of vehicle parameters. Draw backs to the first approach is that the coefficient may be based on assumptions about the vehicle which do not match the current case. Drawbacks to the detailed models are the considerable expense and time needed, and the lack of transparency in the results; It is difficult to relate inputs with outputs.
A middle way between the simplistic coefficient and the complex model, is described here as a set of Parsimonious Powertrain Models. G-10, G-11, G-12 Parsimony is the principle that the best model is the one that requires the fewest assumptions while still providing adequate estimates. These Excel spreadsheet models cover Internal Combustion powertrains, Battery Electric Vehicles, and Plug-in Electric Vehicles, and predict fuel consumption and acceleration performance based on a small set of inputs. Inputs include vehicle characteristics (mass, drag coefficient, frontal area, rolling resistance), powertrain characteristics (fuel conversion efficiency, gear ratios, gear train efficiency), and fuel consumption driving cycle. Model outputs include estimates for fuel consumption, acceleration, and a visitation map.
Fuel consumption is determined by the quantity of fuel used over a driving cycle. The driving cycle specifies the vehicle speed vs. time. An example of a driving cycle is the World Light Vehicles Test Procedure (WLTP) cycle shown in Figure 1.
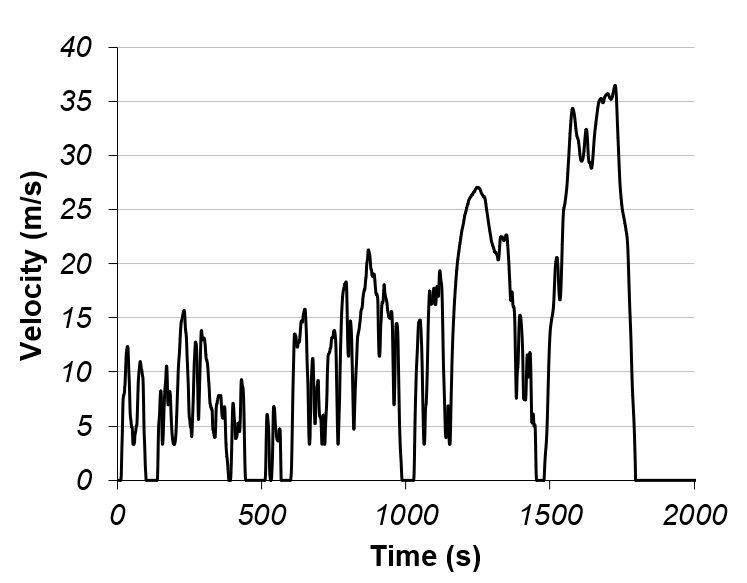
Figure 1: Fuel Consumption Driving Cycle (WLTP Class 3b).
Given the velocity history of Figure 1, the forces on the vehicle resisting forward motion may be calculated. These forces include inertia force, aerodynamic drag force, and rolling resistance. The total of these forces, called tractive force, must be provided by the vehicle propulsion system, see Figure 2.
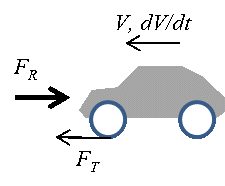
Figure 2. Tractive Force Required.
Once vehicle speed and tractive force are known at each point of time during the driving cycle, the required torque and rotational speed may be determined for each of the drivetrain elements, as shown in Figure 3 for an Internal Combustion system, and Figure 4 for a Battery Electric Vehicle.
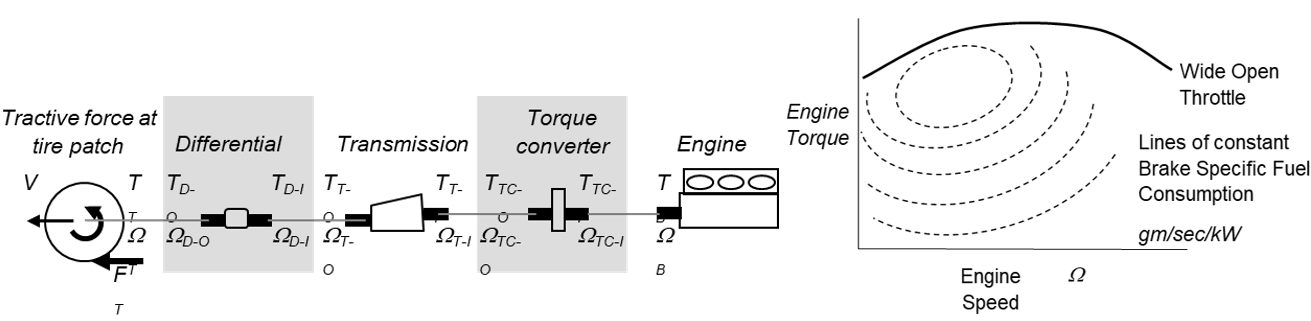
Figure 3. Internal Combustion Powertrain.
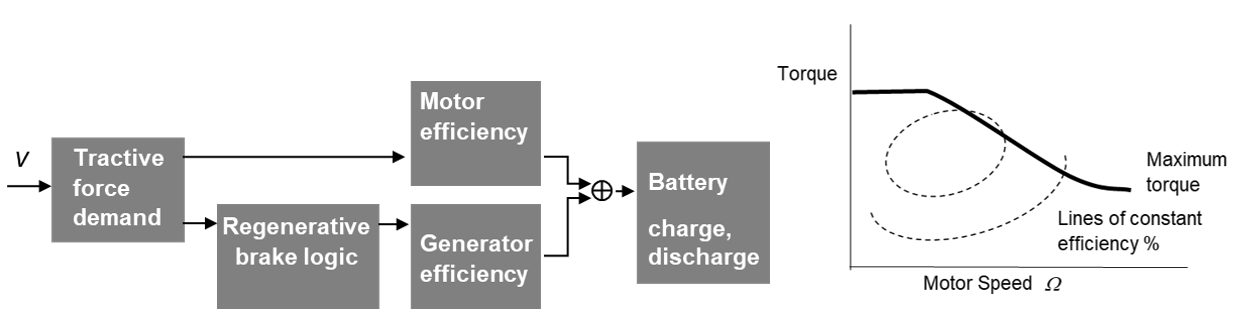
Figure 4. Battery Electric Vehicle Powertrain.
In this way, the required torque and speed of the engine or motor may be determined. Then using a map of efficiency, shown to the right in Figures 3 and 4, the energy demand is determined at each point in time. Summing the energy demand over time yields the fuel used over the driving cycle. The reader is referred to References 1 and 2 for a much more in depth description of the models.
As an example application, consider the WorldAutoSteel FutureSteelVehicle (FSV).W-7 The FSV project, completed in 2011, investigated the weight reduction potential enabled with the use of AHSS, advanced manufacturing processes and computer optimization. The resulting material use in the body structure is shown in Figure 5.
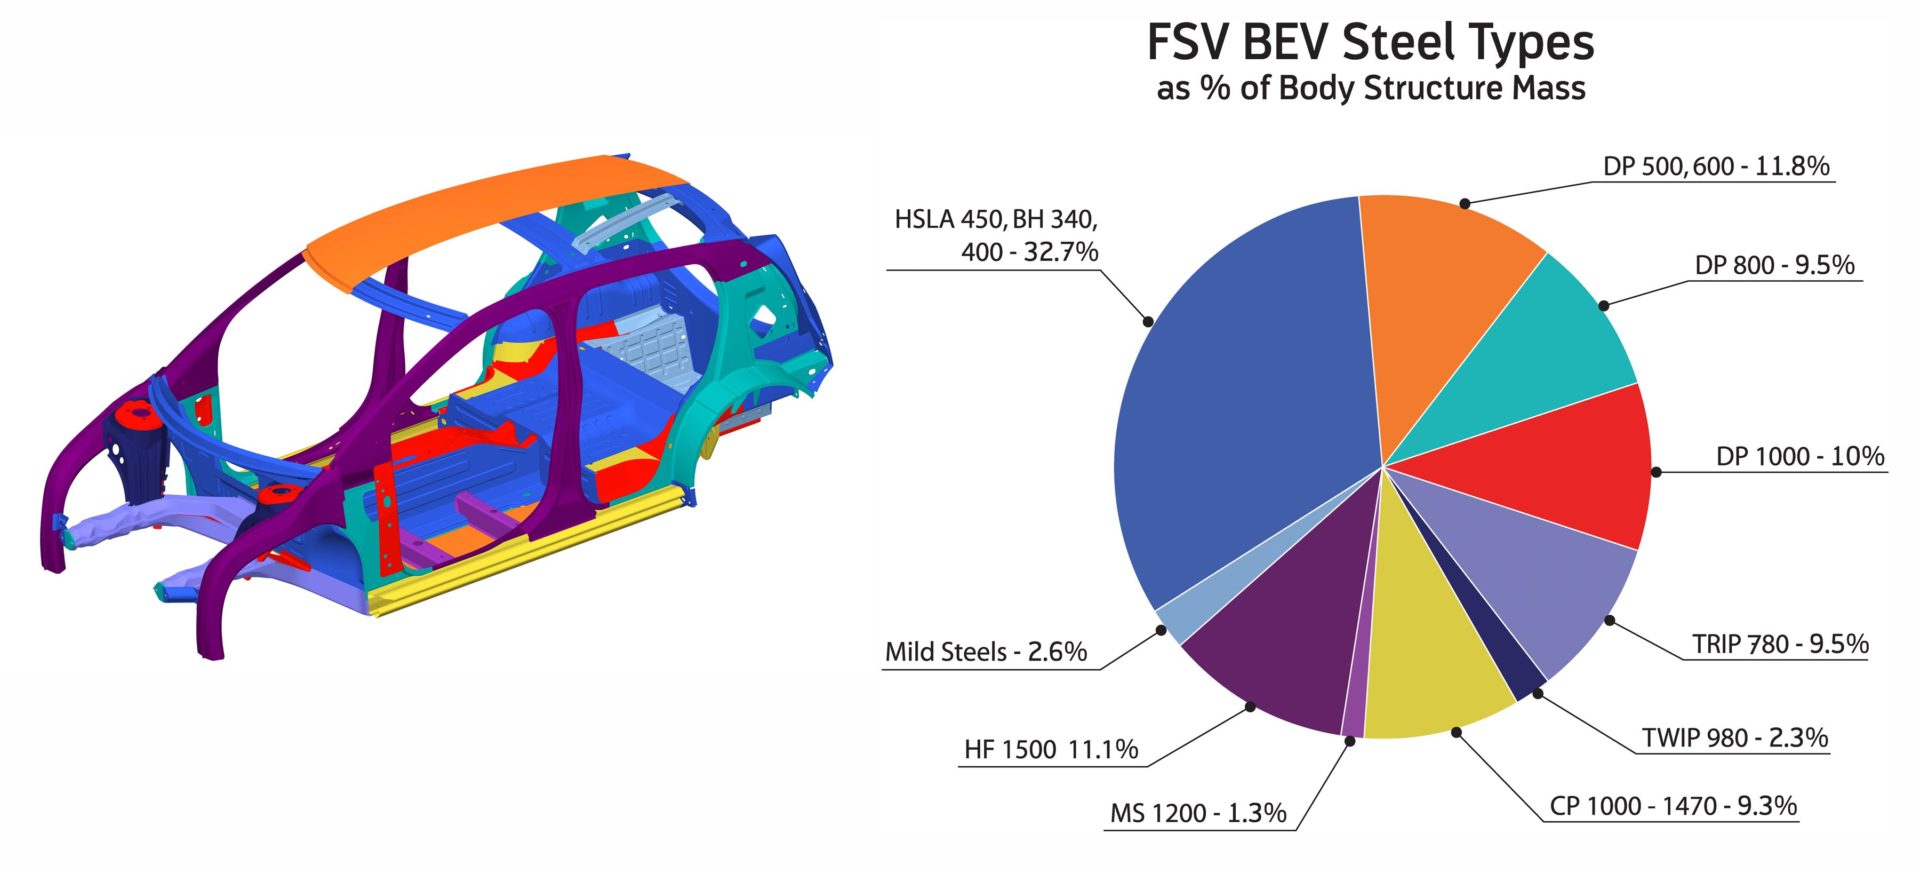
Figure 5. FutureSteelVehicle steel grade application.
This use of AHSS allowed a reduction in the vehicle curb mass from 1200 kg to 1000 kg. What are the effects of this mass reduction on fuel consumption and acceleration performance? The inputs required for the powertrain model are shown in Table 1 for the base case.
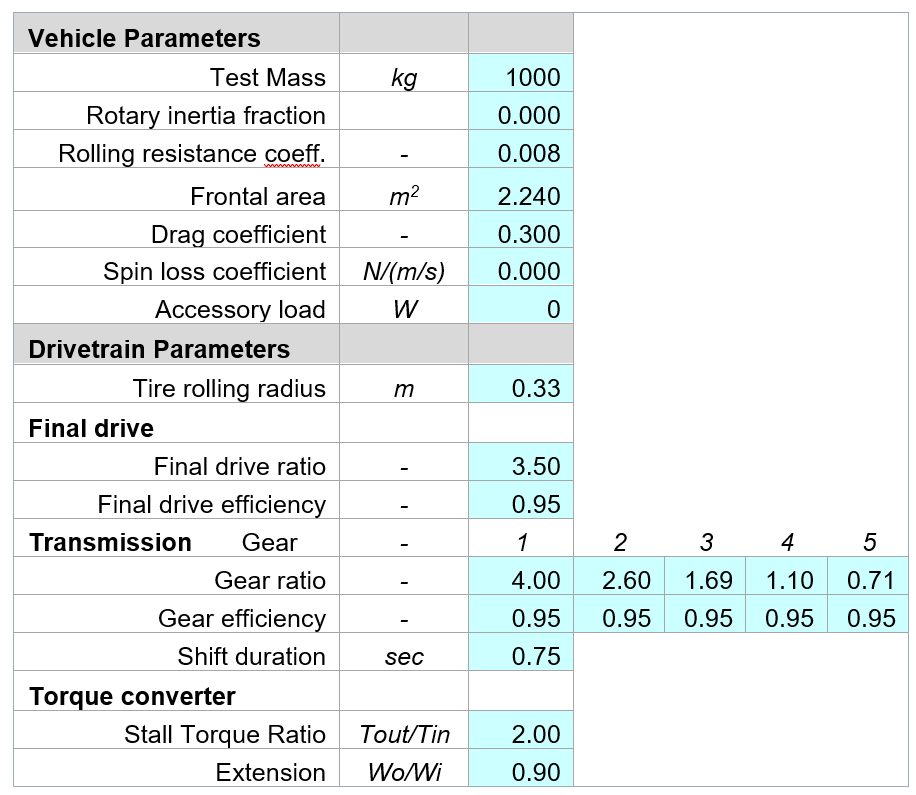
Table 1: Model Inputs for Base Case.
The results provided by the powertrain model are summarized in the acceleration-time vs. fuel consumption graph of Figure 6. Point A is the base case at 1200 kg curb mass. The lightweight case with same engine is shown as Point B. Note the fuel consumption reduction and also the acceleration time reduction. Often the acceleration time is set as a requirement. For the lighter vehicle, the engine size may be reduced to achieve the original acceleration time and an even greater reduction in fuel consumption as shown as Point C.
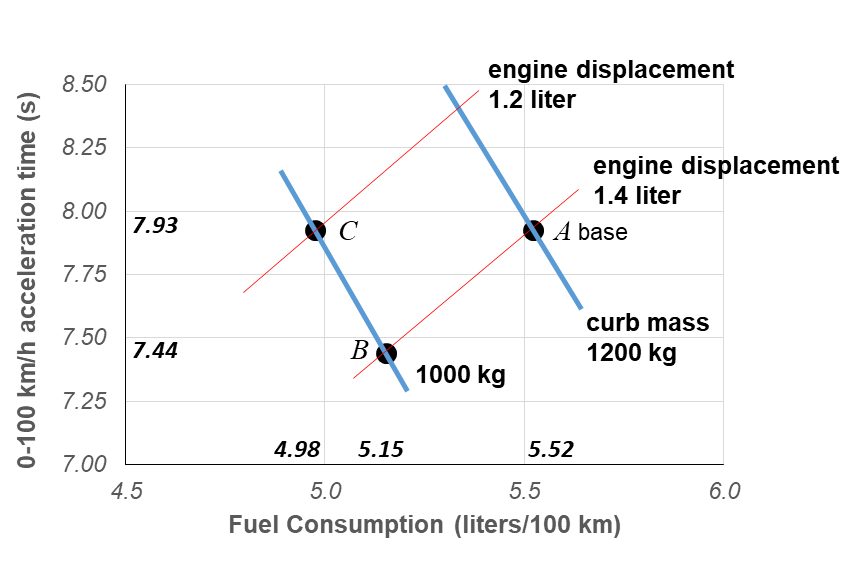
Figure 6. Summary of results of base vehicle and reduced mass vehicle.
Using the parsimonious powertrain models allows such ‘what-if’ questions to be answered quickly, with minimal data input, and in a transparent way. The Parsimonious Powertrain Models are available as a free download at worldautosteel.org.
G-13. R. Geyer, UCSB Automotive Energy & GHG Model, Mar 14, 2017.