![Bulge and Dome Testing]()
Testing and Characterization
Local necking during uniaxial tensile testing limits the characterization of the stress-strain response to true strain values below uniform elongation. Extrapolating the true stress – true strain curve beyond uniform elongation requires selecting a hardening law on which to base the extrapolation. However, the chosen hardening law dramatically affects the extrapolated the true stress – true strain curve. Figure 1L-20 shows an example of this extrapolation using a bake hardenable steel. Deviation from the real performance leads to inaccurate thinning and fracture predictions, inaccurate springback predictions, and inaccurate predictions of press force and press energy requirements.
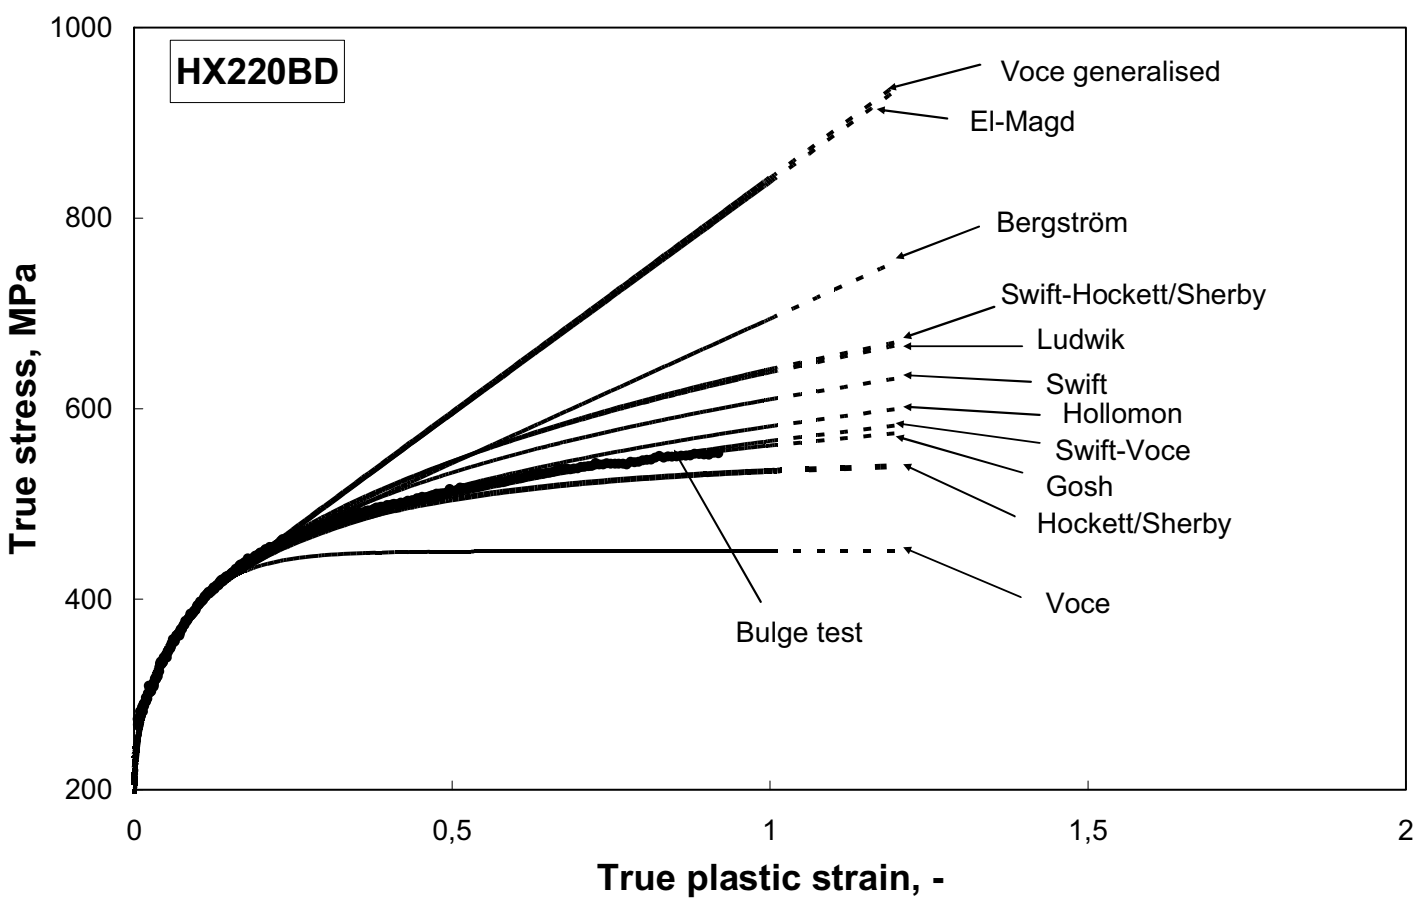
Figure 1: The selected hardening law leads to vastly different stress-strain responses extrapolated beyond uniform elongation.L-20
Bulge testing is one method to generate stress-strain data at higher strains, minimizing the need for extensive extrapolation. Another benefit is that the deformation occurs in two directions (biaxial), which is similar to the metal motion seen in most forming operations and in contrast to uniaxial tensile testing.
In biaxial bulge testingK-17, V-7, a circular sample is clamped around its periphery and pressurized from one side using a viscous incompressible medium, forcing the metal to bulge and expand into a cavity as the pressure increases. Figure 2 shows a typical testing configuration.F-12 Flow stress is calculated from the dome height of the bulging blank and the pressure in the viscous medium. A non-contact system equipped with Digital Image Correlation (DIC) measures strain. The ISO 16808 Test Standard details the requirements.I-12
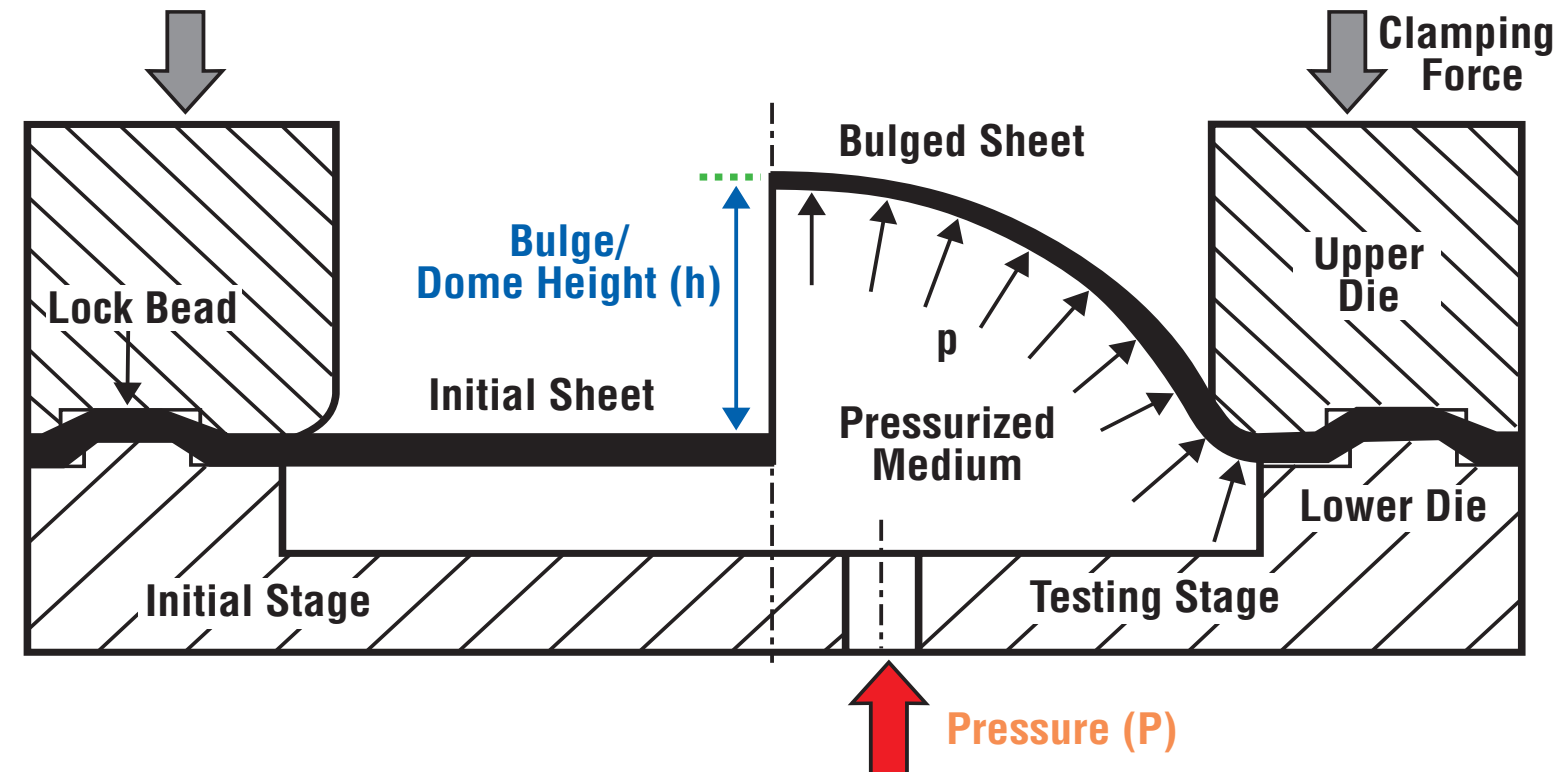
Figure 2: Bulge testing configuration.F-12
For various reasons, flow stress data at the lowest strains are not as accurate as what is generated at higher strains. This leads to practitioners combining curves, using tensile data at low strains through uniform elongation, and bulge data after that. These blended curves result in a thorough true stress – true strain characterization over a wide range of strains, making it applicable to a variety of formed parts. Figure 3 shows a blended curve for the same alloy highlighted in Figure 1.
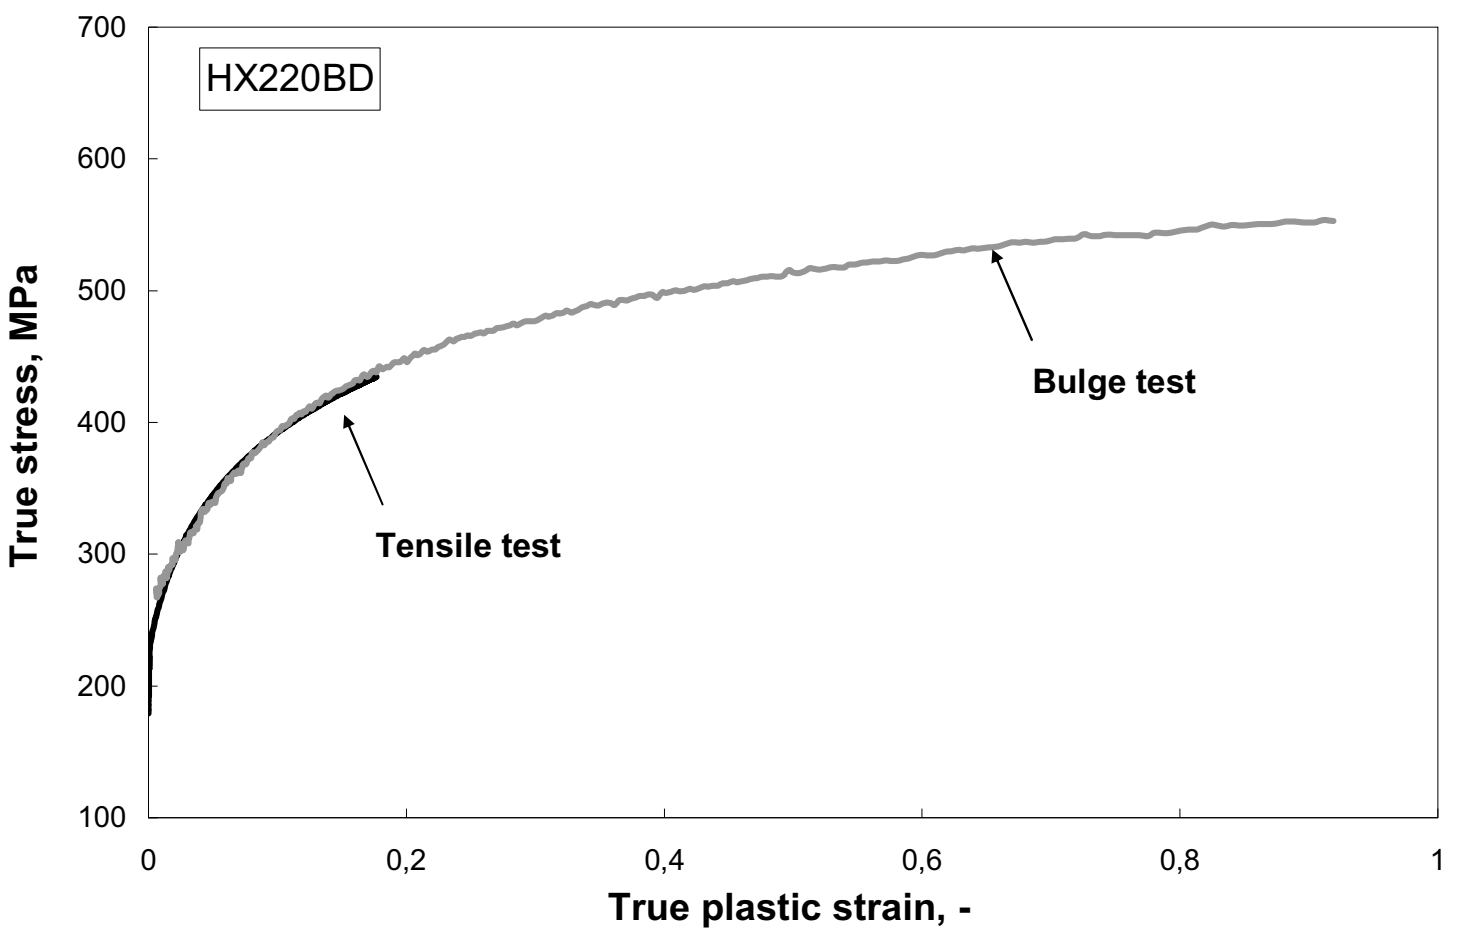
Figure 3: Flow curves for a bake hardenable steel generated by combining tensile testing with bulge testing.L-20
Biaxial bulge testing provides two critical inputs for advanced material characterizations required for simulation: biaxial anisotropy and biaxial yield stress.
Citations
Citation:
L-22. T.M. Link, “Effects of Paint Baking on the Axial Crash Performance of Advanced High Strength Steels,” Proc. Materials Science and Technology Conference (MS&T’08), Pittsburgh, Pennsylvania, USA, p. 1989-2000, October 2008.
Blog, main-blog
A New Software Application for Thin Wall Section Analysis
Advanced High-Strength Steel (AHSS) grades offer increased performance in yield and tensile strength. However, to fully utilize this increased strength, automotive beam sections must be designed carefully to avoid buckling of the plate elements in the section. A new software application, Geometric Analysis of Sections—GAS2.0, available through the American Iron and Steel Institute, is a tool to aid in this design effort.
Plate Buckling in Automotive Sections
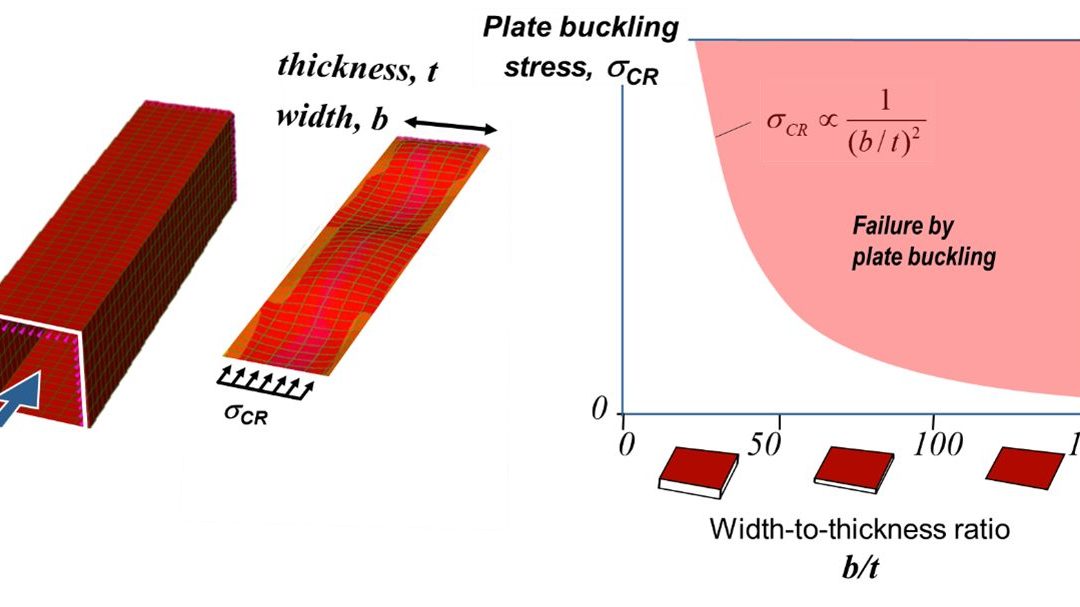
To understand how plate buckling affects the strength of a thin walled beam consider Figure 1. A square beam is made of four identical plates connected at their edges. Under an axial compressive load each plate may buckle. Considering just one of the plates, the stress that will cause buckling depends on the ratio of plate width and thickness (b/t). Thinner wider plates with large b/t ratio will buckle at a lower stress than thicker narrower plates.
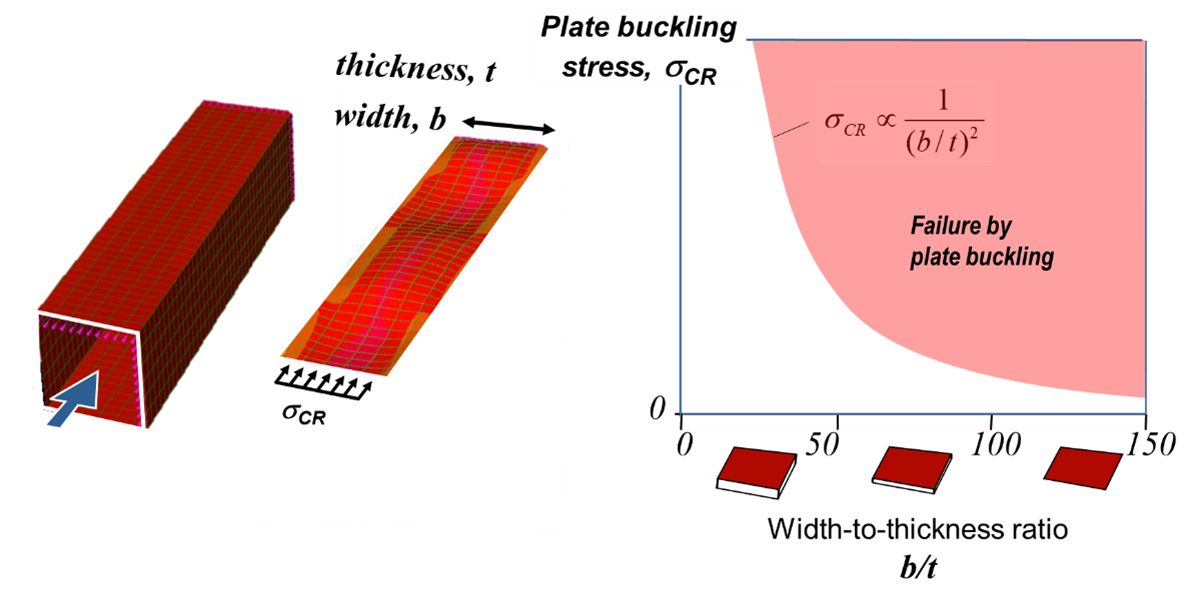
Figure 1: Plate Buckling Behavior.
Now consider a plate of mild steel (200 MPa yield stress) which has been designed to buckle just as yield stress is reached, Point A in Figure 2. The plate would have a b/t ratio of approximately 60. This design is taking full advantage of the yield strength of the material.
Now consider the same plate but substituting an AHSS grade (600 MPa yield stress) as shown in Figure 2. The plate will buckle at the same 200 MPa before reaching the material’s potential, Point B in the figure. To take advantage of this materials yield strength, the proportions of the plate will need to be changed, Point C. This illustration demonstrates the need to consider plate buckling particularly in the application of AHSS grades.
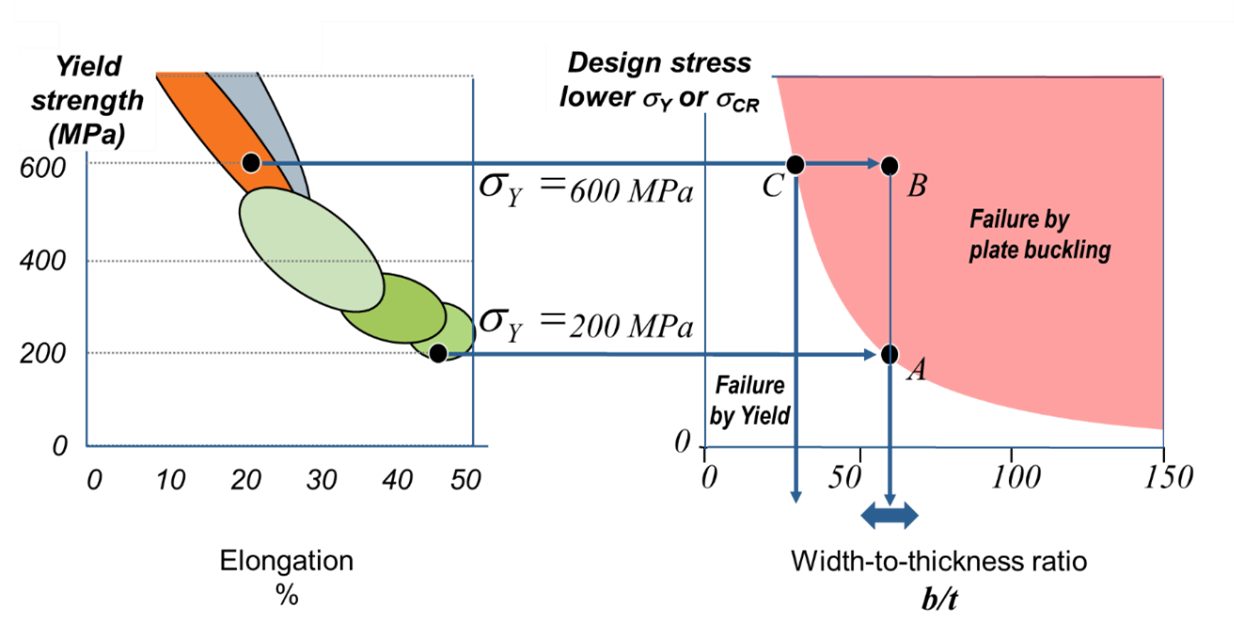
Figure 2: AHSS Substitution in a Plate.
Moving from a single plate to the more complex case of a beam section of several plates, consider Figure 3. On the left is the beam made of four plates with a compressive load causing the plates to just begin to buckle. However, this condition does not represent the maximum load carrying ability of the beam. The load can be increased until the stress at the corners of the buckled plates are at the material yield stress, center in Figure 3. Note that in this condition the stress distribution across the plate is nonlinear with lower stress in the center of each plate. One means to model this complex state is by using an imaginary Effective Section. Here the center portion is visualized as being removed and the remainder of the section is stressed uniformly at yield. The amount of plate width to be removed is determined by theory.W-21, A-42, Y-9, M-18 The effective section is a convenient way to visualize the efficiency of a section design given the material grade and provides an estimate of the maximum load carrying ability of the beam.
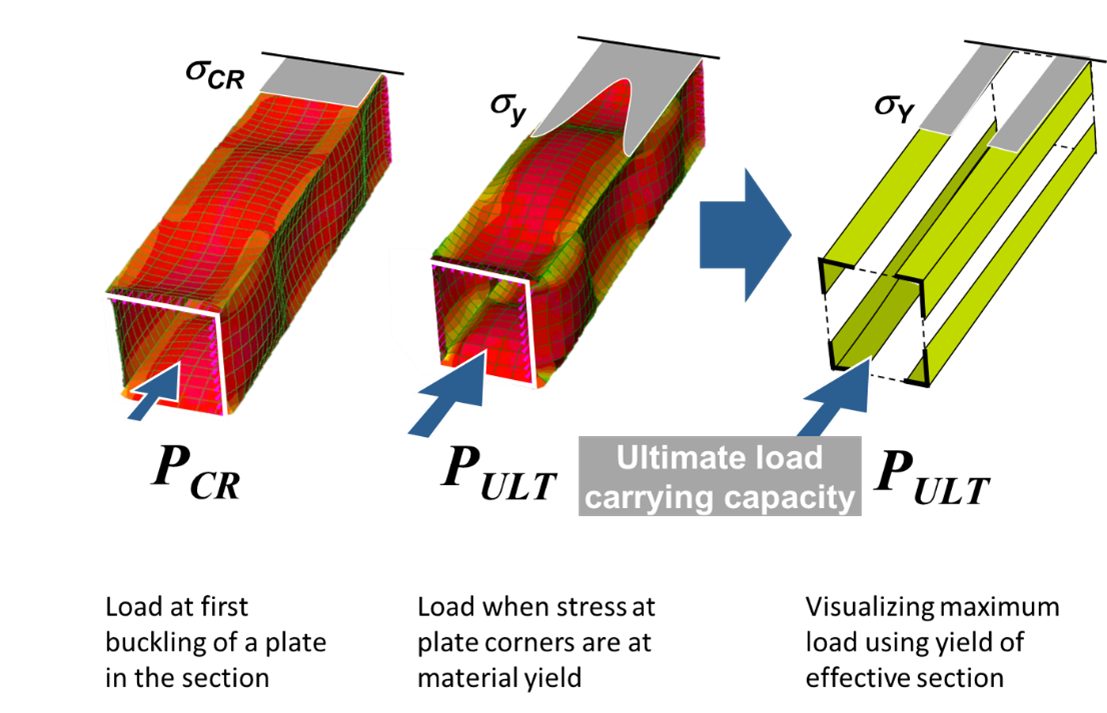
Figure 3: Concept of Effective Section.
Geometric Analysis of Sections – GAS2.0
Geometrical Analysis of Sections software determines the effective section for complex automotive sections. Figure 4 illustrates the GAS2.0 user interface. The user has the ability to construct sections or to import section data from a CAD system. Material properties for 63 steel grades are preloaded with the ability to also add user-defined steel grades. Two types of analysis are available. Nominal analysis, which provides classical area properties of the section, and Effective analysis which determines the effective section at material yield. Figure 5 summarizes both the tabular results and graphical results for each type of analysis.
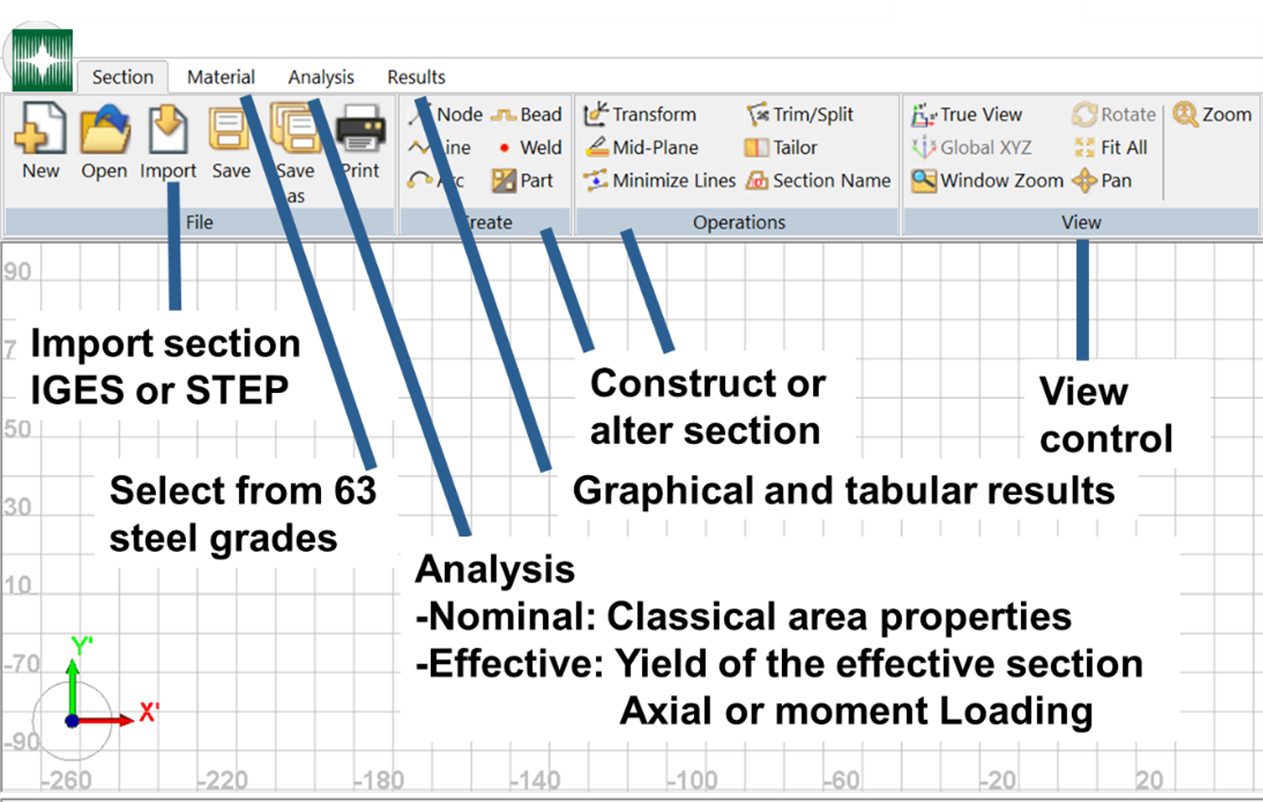
Figure 4: GAS2.0 User Interface.
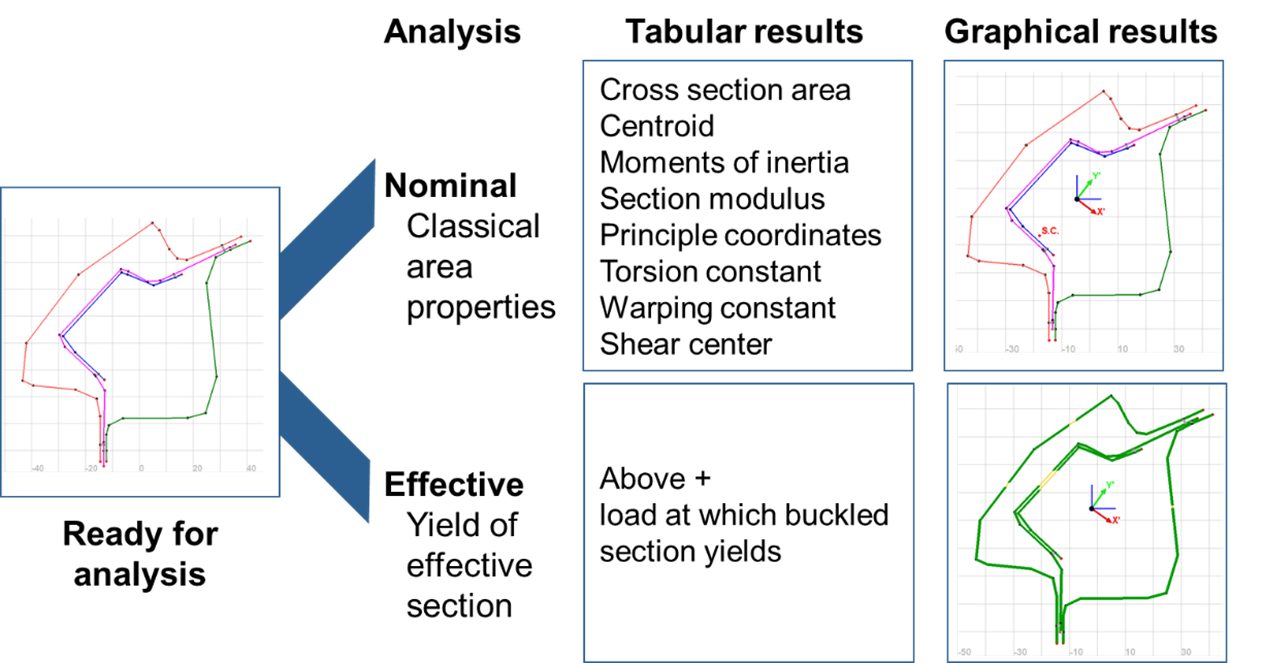
Figure 5. GAS2.0 Analysis Results.
Figure 6 illustrates an example of an Effective Analysis for a rocker section. In the graphical screen, the effective section is shown in green. Ideally, the whole section would be effective to fully use the materials yield capability. Also shown in the graphical screen are the section centroid, orientation of the principle coordinates, and stress distribution. In the right text box are tabular results. At the bottom of the tabular results is the axial load that causes this stress state and represents the ultimate load carrying ability of this section.
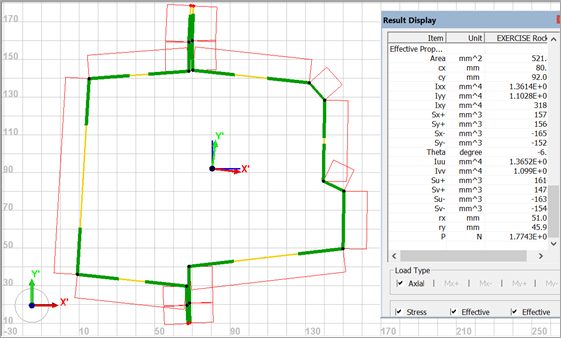
Figure 6: GAS2.0 Graphical Results.
It is clear that much of the material in the section of Figure 6 is not fully effective. GAS2.0 allows the user to conveniently modify the section. For example, in Figure 7 a bead has been added to the left side wall increasing its bulking resistance. Note that the side wall is now largely effective, and the ultimate load at the bottom of the text box has increased substantially.
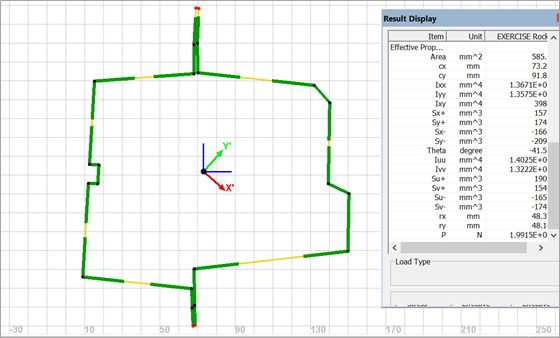
Figure 7: Improved Design Concept.
Role of GAS in the Design Process
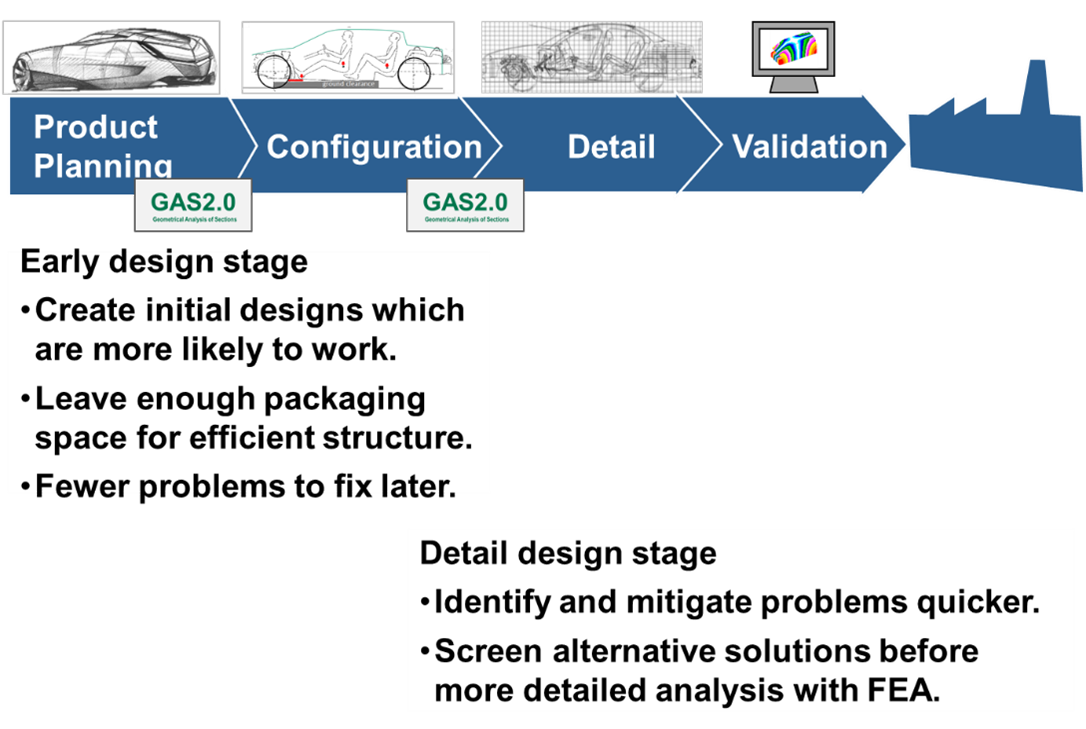
GAS2.0 can play a significant role in early stage design, see Figure 8, by quickly creating initial designs which are more likely to function and to ensure that adequate package space is set aside for structure. This will result in fewer problems to fix later in the design sequence. During the detail design stage, GAS2.0 can supplement Finite Element Analysis by identifying problems earlier, and by screening design concepts for those with the greatest promise prior to more detailed analysis by FEA.
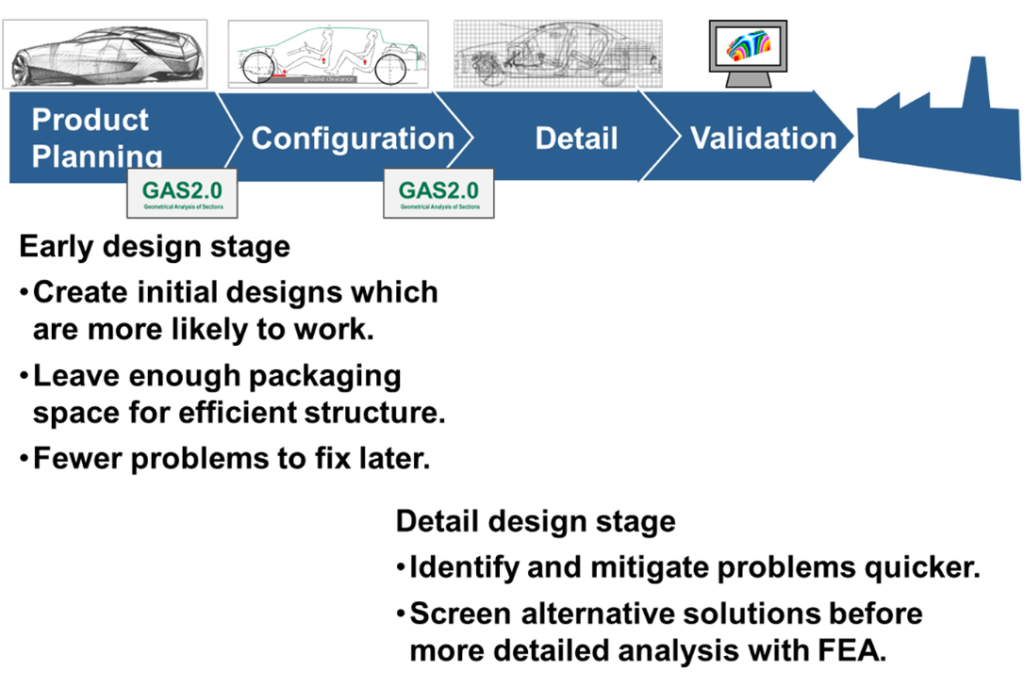
Figure 8: Role of GAS2.0 in Design Process.
GAS2.0 is available for free download at www.steel.org, Included in the resources at steel.org is an American Iron and Steel Institute introductory webinar conducted by Dr. Don Malen on 16 June 2020, as well as a number of GAS2.0 tutorials and training modules.