Arc Welding
This is a summary of a paper of the same title, authored by K. Májlinger, E. Kalácska, and P. Russo Spena, used by permission.M-65
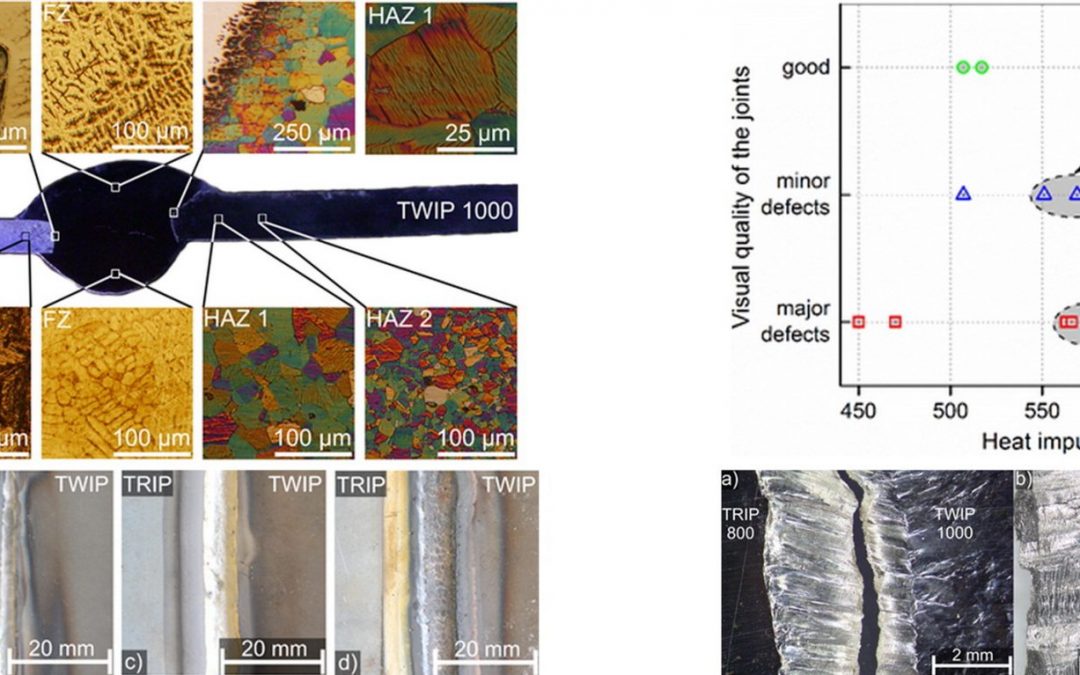
Researchers at the Budapest University of Technology and Economics and the Free University of Bozen-Bolzano tested gas metal arc welding (GMAW) of dissimilar Advanced High-Strength Steel (AHSS) sheets.M-65 The test pieces were 100 x 50 mm samples of 1.4 mm TWIP (TWIP1000) and 0.9 mm TRIP (HCTC800T) sheet steels were welded in a lap joint configuration with 0.8 mm diameter AWS ER307Si austenitic stainless steel wire to determine appropriate GMAW parameters for good quality welds. Quality was determined by external appearance, microstructure, and mechanical properties. Good welds were achieved with linear heat inputs (Q) with ranges from 500-650 kJ/m. The only fractures that occurred appeared within the weld bead by ductile failure modes. The HAZ of the TWIP steel showed grain coarsening and the HAZ of the TRIP steel experienced microstructural changes relative to the distance from the fusion boundary. The ultimate tensile strength (UTS) varies between 73%-84% of the weaker of the two steels.
Welding was conducted with an automated linear drive system with pure Argon (99.996% Ar) shielding gas at 10L/min. Wire feed rates were approximately 3.5 m/min with Direct Current Electrode Positive (DCEP) polarity. Changes in current, voltage, weld speed, and the resulting linear energy are compared in Table 1.
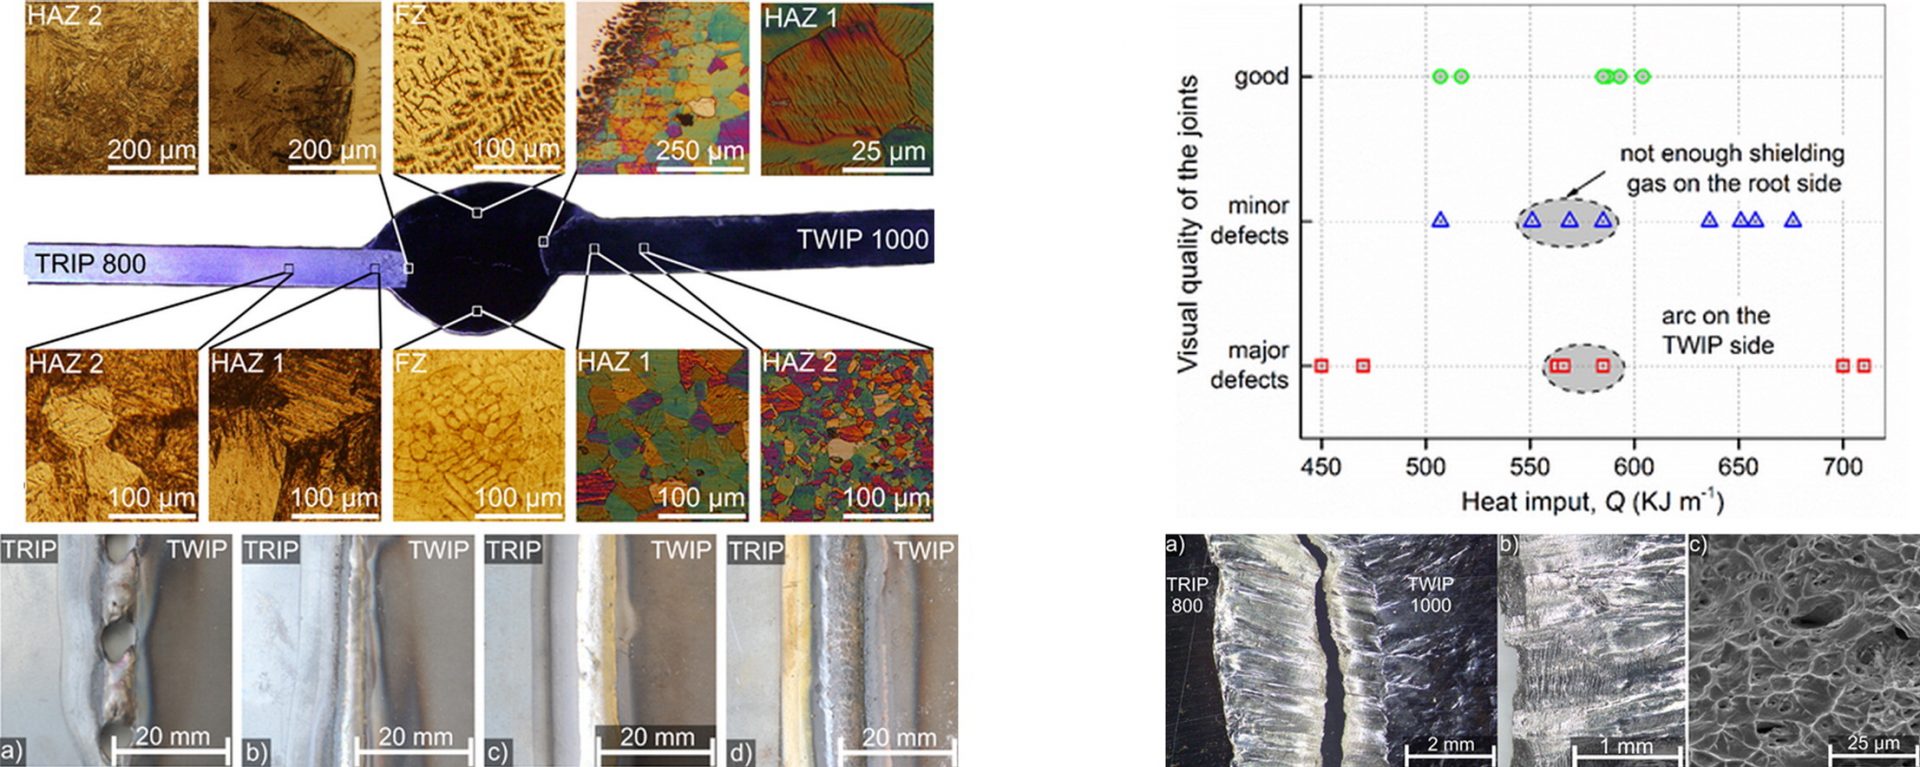
Figure 1: Overview of Dissimilar AHSS GMAW Welding.M-65
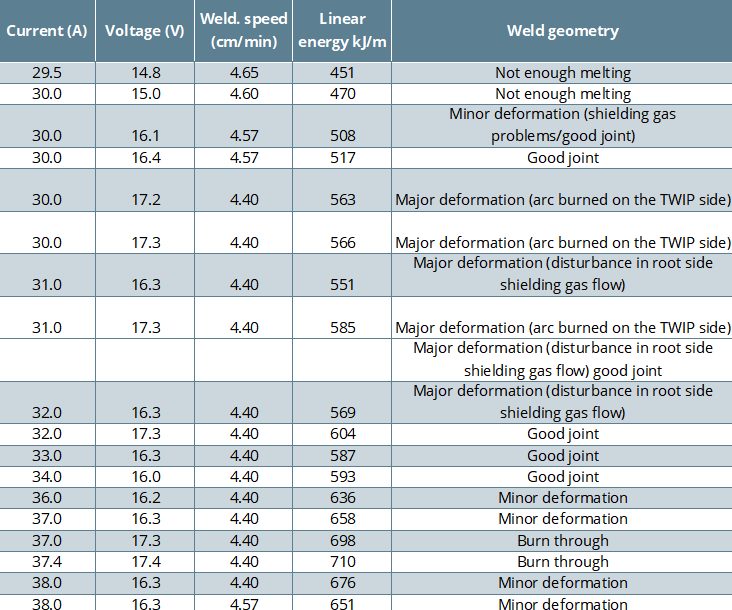
Table 1: Results of the preliminary welding tests in terms of TWIP-TRIP joint quality.M-65
After welding, transverse sections were cut from the welds and etched to show the microstructure. Vickers hardness testing was conducted on the weld samples based on the ASTM E384 standard. Tensile tests were performed on the samples according to the EN ISO 6892-1 standard. Tests were also conducted on unwelded TWIP and TRIP steels for comparison. Scanning electron microscopy (SEM) examinations were made of fracture surfaces to determine failure modes and examine for microscopic weld defects.
The study concluded that dissimilar welds between AHSS steels with the GMAW process can be achieved with consistent results desired for automotive applications.
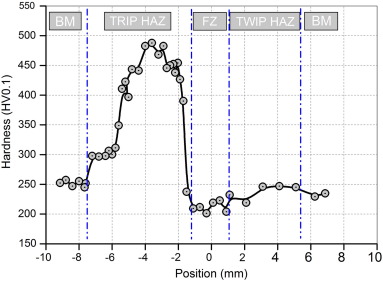
Figure 2: Vickers Hardness Across Weldment.M-65
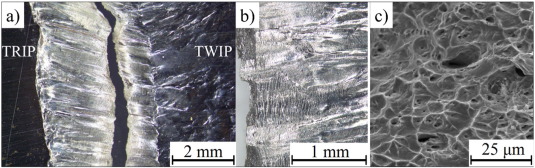
Figure 3: Ductile Failure in the fragile zones (FZ).M-65
Arc Welding, Joining
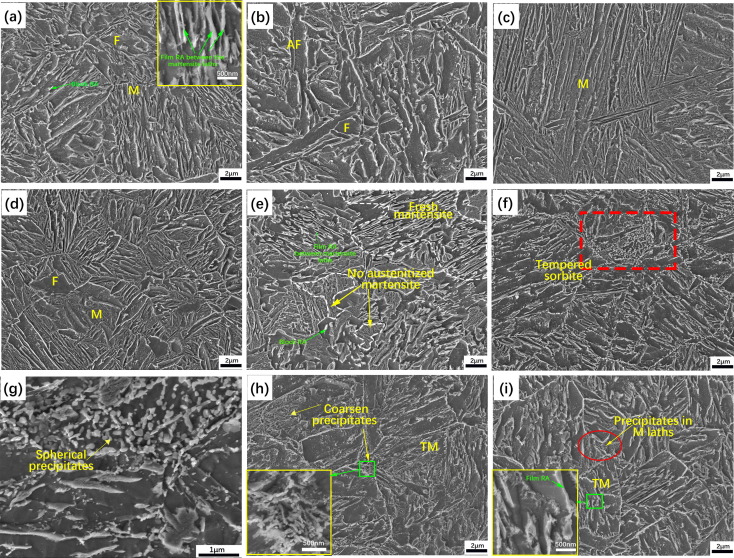
Quenching and partitioning (QP) steels are one of several third generation advanced high strength steel formed by controlled martensite phase fractions and retained austenite. Researchers from the University of Shanghai Jiao Tong tested the effect of HAZ softening in a QP1180 lap joint with the GMAW cold metal transfer (CMT) process.W-1 The steel was welded with ER130s electrode. The fusion zone consisted of chiefly acicular ferrite. The supercritical zone consists of martensite, which is harder than the base metal. There is a drop in hardness (100 HV) in the subcritical zone, and there is a noted lack of retained austenite present in the microstructure. Precipitates are also present in the subcritical zone. The intercritical HAZ only experiences mild softening; where fresh martensite has formed. The softening in the subcritical HAZ presents room for failure that must be accounted for when planning welding using CMT.
Figure 1 shows the different microstructures in detail throughout the weld and the base metal. In the softening zone shown in Figure 2 correlates to the tempered sorbite region in Figure 1 (part f). The hardness maps shows that the fusion zone is approximately as hard as the base metal, with the supercritical HAZ having the highest hardness values before rapidly softening in the intercritical and subcritical HAZ zones. The softened region must be accounted for in designing CMT or other high heat input welded components.
Figure 1: a) Base metal with retained austenite between martensite lathes, b) fusion zone with acicular ferrite and ferrite, c) coarse martensite grains in supercritical HAZ, d) fine martensite grains and ferrite in supercritical HAZ, e) intercritical HAZ with fresh martensite and untransformed martensite, f) softest region in subcritical HAZ; shows tempered sorbite, g)zoomed in region of subcritical zone with precipitates, h) subcritical HAZ with 350-360HV hardness, i) hardness with 380-390HV.W-1
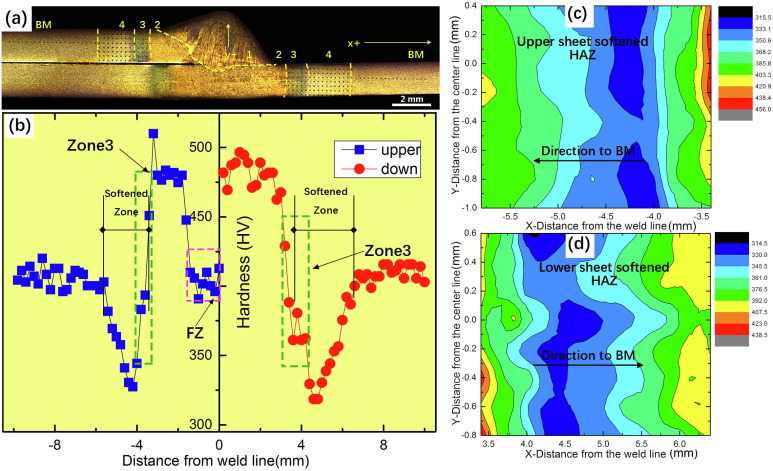
Figure 2: a) macrostructure of the CMT-welded QP1180 joint, b) hardness chart through joint, c) hardness map in upper sheet, d) hardness map in lower sheet. 1) fusion zone, 2) supercritical HAZ, 3) intercritical HAZ, 4) subcritical HAZ, BM = base metal.W-1
Arc Welding, Joining
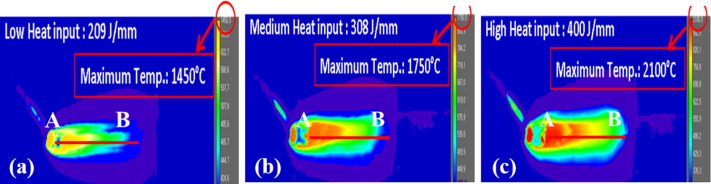
A common issue when welding Advanced High-Strength Steels (AHSS) is with protective coatings causing weld defects. A group of researchers at the NMAM Institute of Technology and Dong-Eui University studied common issues with gas metal arc welding (GMAW) in the cold metal transfer (CMT) mode on a zinc-coated steel.V-2 The study used infrared thermography to observe the welds as they were created, helping to get detailed observations on some defects appearing in real time. With GMAW in CMT mode, the prevailing defect with welding a zinc-coated steel was porosity from metal vapors escaping through the weld. This issue could be addressed by adjusting the heat input and travel speed to provide more time for metal gases to escape.
In Figure 1, it shows that with a higher heat input, more heat is in the weld puddle. In low and medium heat inputs, the puddle is above melting temperature, but not as high as the high heat input. Figure 2 shows that the low heat input also has the fastest solidification rate, and the high heat input has the slowest solidification rate. Figure 3 shows where the zinc vapors from the molten coating evaporate through the weld. In the left picture, at low heat input, the nucleation is contained inside of the weld, and the fusion zone would collect in the fusion zone. In the middle picture, at medium heat input, the zinc vapors bubble out just as the metal starts to solidify. In the right picture, at high heat input, the zinc bubbles out in the weld puddle while it is still molten.
Figure 1: Infrared Thermography of Weld Bead.V-2
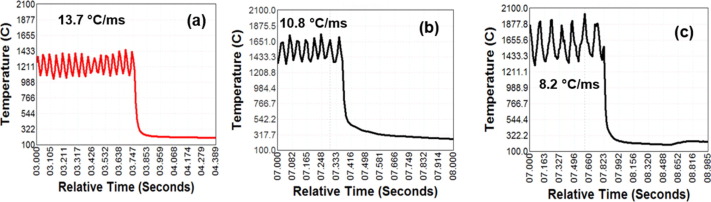
Figure 2: Variation of temperature during CMT for High, Medium, and Low Heat Input.V-2
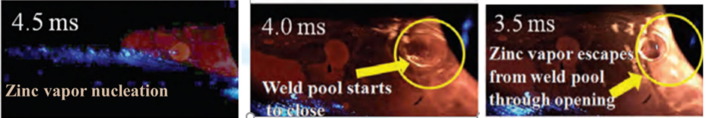
Figure 3: Variation of Zinc Porosity Position vs Low, Medium, and High Heat Input.V-2
These factors combined indicate several factors that influence zinc porosity in GMAW CMT weldments. The researchers concluded that at low heat inputs, the zinc collects in the fusion zone. At medium heat inputs, the solidification rate and temperature gradient through the weld puddle traps the zinc in the fusion zone but also allows some to bubble out through the weld puddle. This caused the worst material properties of the three weldments for the researchers. At high heat inputs, the zinc bubbles out through the weld puddle, before solidification occurs. This condition is optimal, to reduce porosity with zinc metal vapors, the heat input should be increased so that the weldment temperature increases and solidification rate decreases.
Arc Welding, Joining
In production, part geometry or joint application requires the use of gas metal arc welding (GMAW) to weld the joint. A commonly used Advanced High-Strength Steel (AHSS) is Dual Phase (DP) 600 which contains a hard martensite phase in a ferrite matrix (approximately 5-20% martensite). Under the heat input from GMAW, this microstructure near the weld [in the Heat Affected Zone (HAZ)] is destroyed, and a new microstructure develops. Researchers from RWTH Aachen University in GermanyR-24 used representative volume elements (RVE) in tandem with electron probe microanalysis and micromechanical finite element (FE) modeling to develop flow curves for 2.5 mm hot rolled DP 600 steel sheet. This can be used to help predict mechanical properties in the HAZ. The researchers observed bainite, coarse grain ferrite, and tempered martensite in the HAZ.
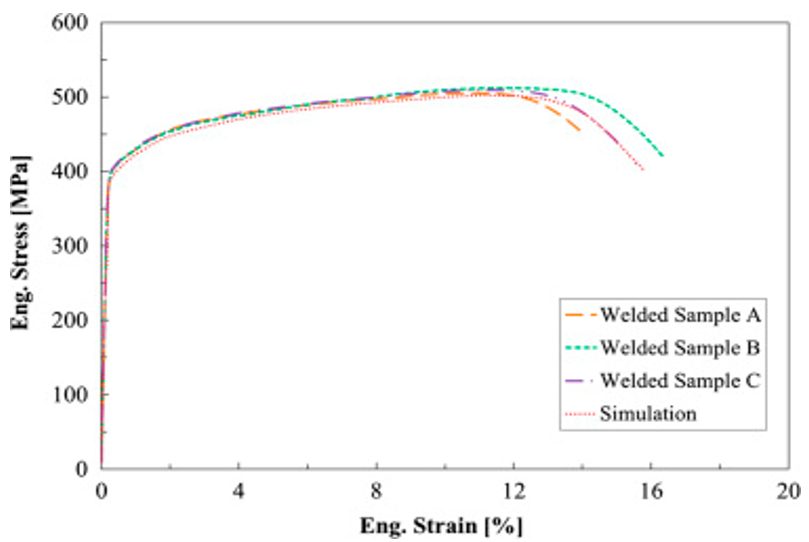
The researchers developed an engineering stress-strain curve for the GMA welded DP 600 steel as depicted in Figure 1. The stress distribution concentrates to the outside edge of the HAZ as shown in Figure 2, primarily in the softest regions of the HAZ (Figure 3). The soft region is where ductile failure is observed as seen in Figure 4. The soft region is a result of a loss of bainite and an increase in ferrite grain growth. Because ferrite is steel’s softest phase, it results in this soft region where plastic strain accumulates. The increasing presence of tempered martensite starts to raise hardness after this region.
Figure 1: Stress-Strain Curve for GMA Welded DP600 Steel.R-24
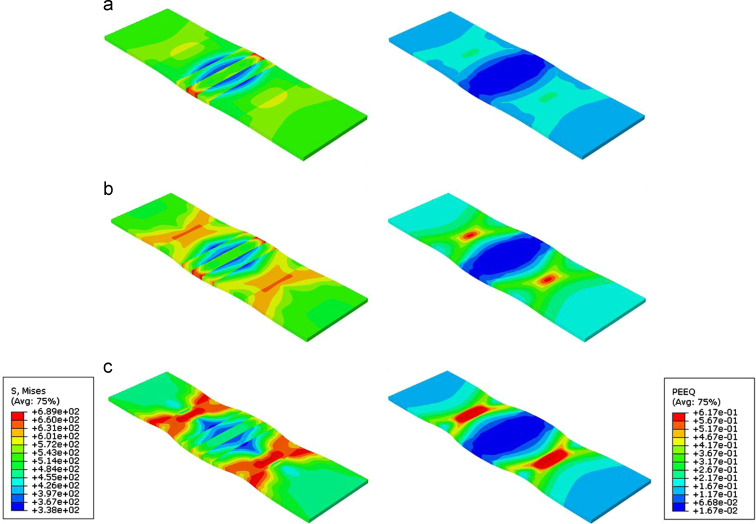
Figure 2: Hardness Map through FZ and HAZ with emphasis on softened zone.R-24
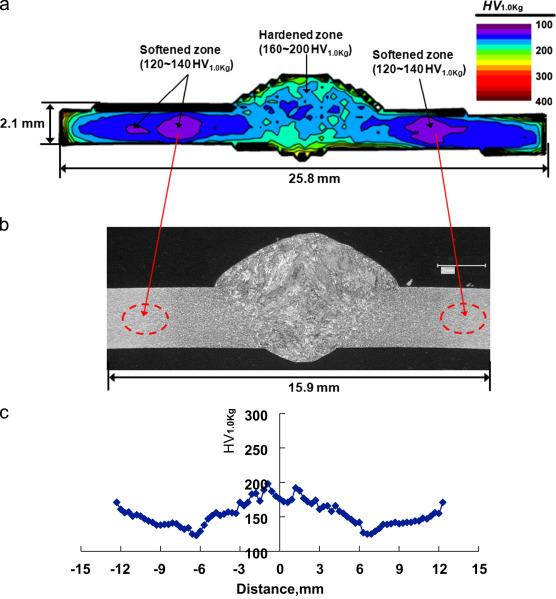
Figure 3: Hardness map of weld and HAZ.R-24
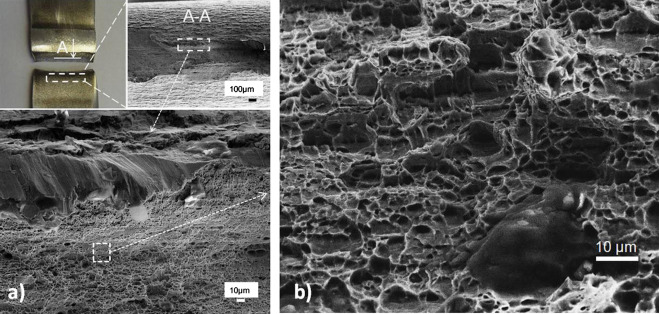
Figure 4: Ductile fracture in softened zone.R-24
The HAZ is composed of a variety of microstructures that vary depending on their distance from the centerline. Close to the middle of the fusion zone, the microstructure is almost 100% bainite with small amounts of ferrite and martensite. Bainite is harder than the tempered steel/ferrite combination, which accounts for the hardness of the fusion zone. Away from the fusion zone, the bainite decreases, and the ferrite increases to where the microstructure is roughly 90% ferrite and 10% martensite, with no bainite in the microstructure (Figure 5).
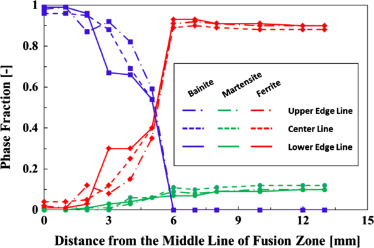
Figure 5: Phase fractions relative to weld centerline.R-24
Arc Welding
This article summarizes a paper by W. Mohr and N. Kapustka, EWI, entitled, “Fatigue of GMAW-P Lap Joints in Advanced High-Strength Steels.”M-13
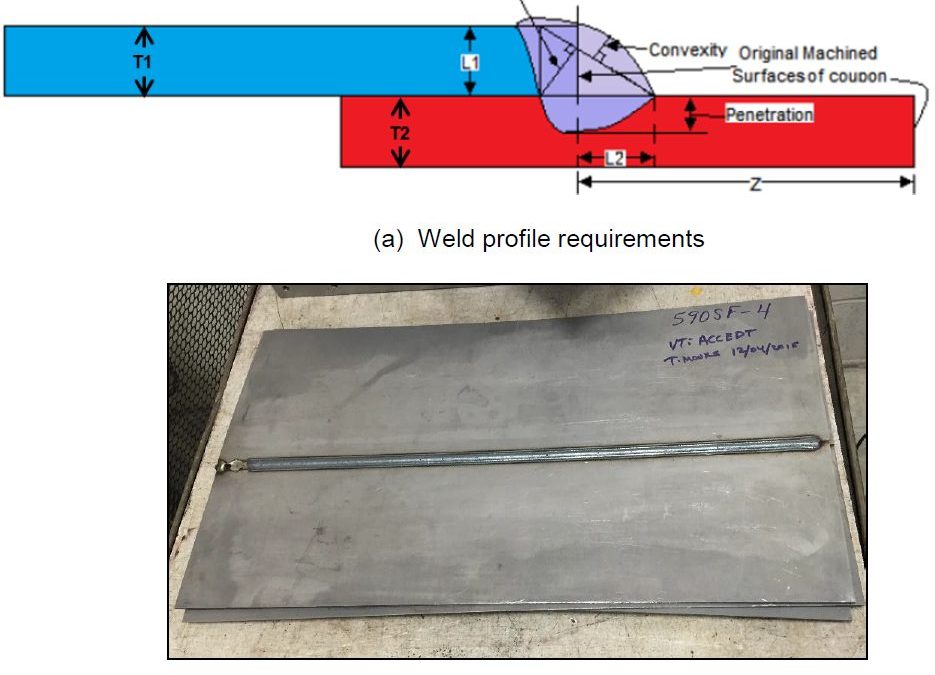
EWI has performed fatigue tests on welds from four Advanced High-Strength Steels (AHSS) in the uncoated condition. The materials were provided in three thicknesses as follows, 2.0-mm DP 780, 1.8-mm 590 SF, 2.0-mm DP 980, and 2.8-mm CP 800. Referring to Figure 1(a), welding parameters were selected to meet the weld profile requirements listed below:
The travel speed to achieve such combinations was 23 mm/s for three of the sheets and 13 mm/s for the 2.8-mm-thick CP 800. Figure 1 shows a completed panel.
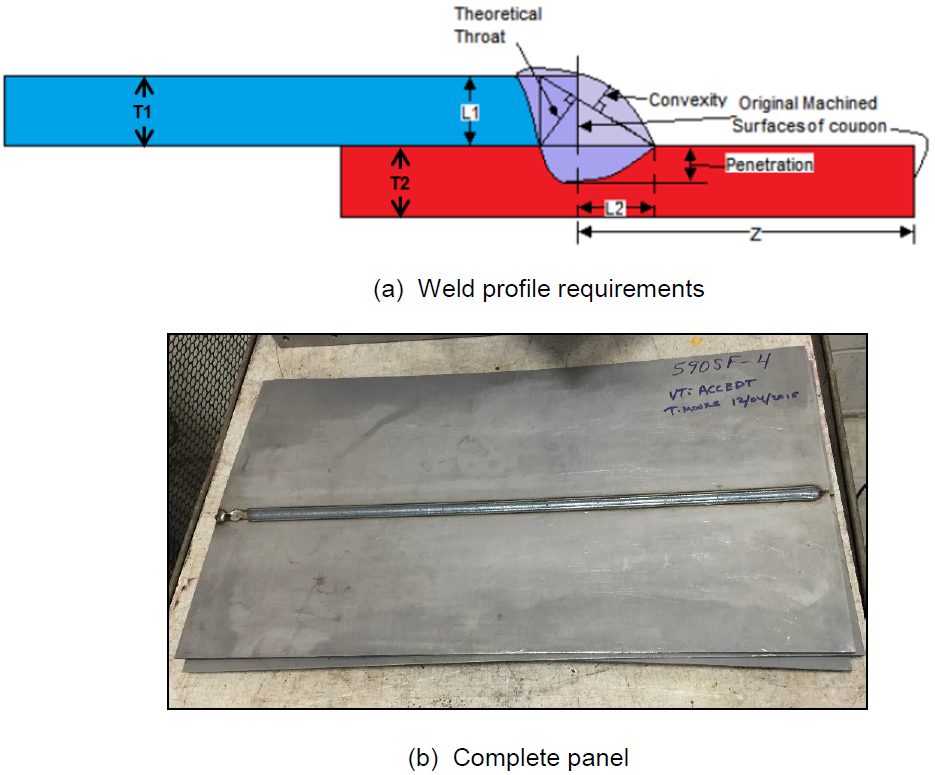
Figure 1: Completed Panel.M-13
Specimens were cut from the lap-welded panels in a configuration recommended by Z 2275, with minimum reduced sections of 20-mm wide, with 20-mm radii on both sides to a full width of 30 mm, as shown in Figure 2.
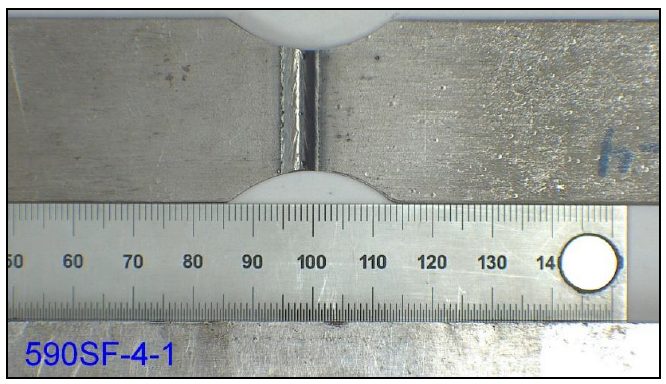
Figure 2: Specimen Design.M-13
Fixtures for the bend testing had eight, 6.3-mm radius rollers, four on top and four on the bottom, with offsets of the roller centers to accommodate the lap-joint configuration and the differing sheet thicknesses. The interior span was 120 mm, while the exterior span was 210 mm. The full bending fixture, with a specimen inserted, is shown in Figure 3.
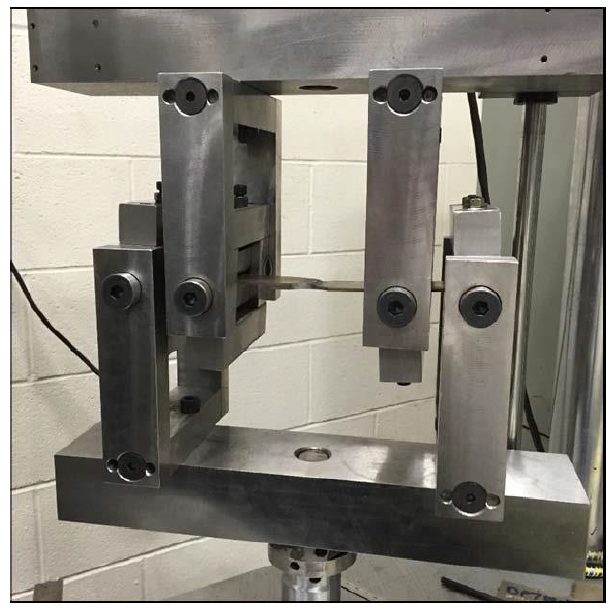
Figure 3: Bending Test Fixture.M-13
Weld profiles were achieved that met the weld profile requirements for each sheet material type. These weld profiles are shown for the four sheet materials in Figure 4. Fatigue testing results in tension at R = 0.3 gave lifetimes between 30,000 and 9 million cycles, with run-outs at 10 million cycles, as shown in Figure 5.
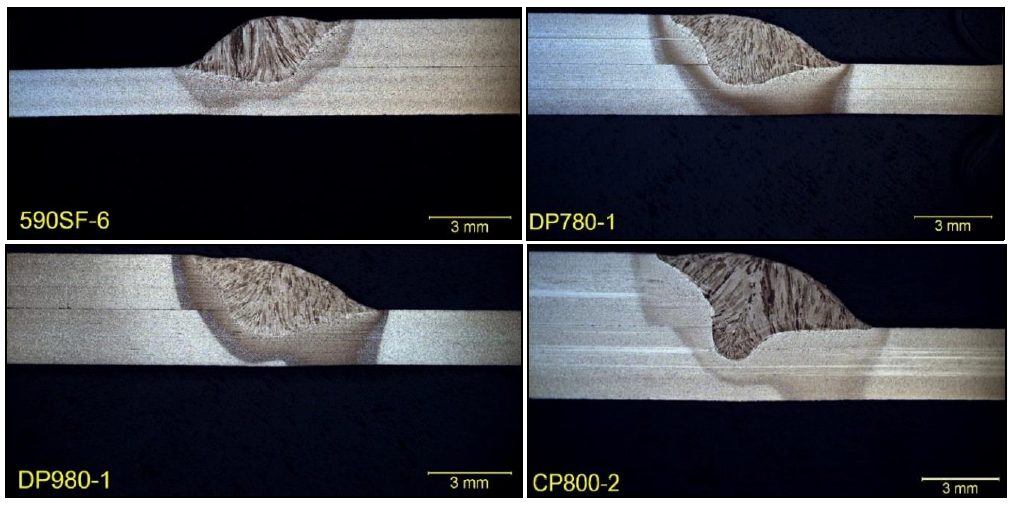
Figure 4: Cross Sections of Lap Joints (etched with 2% Nital).M-13
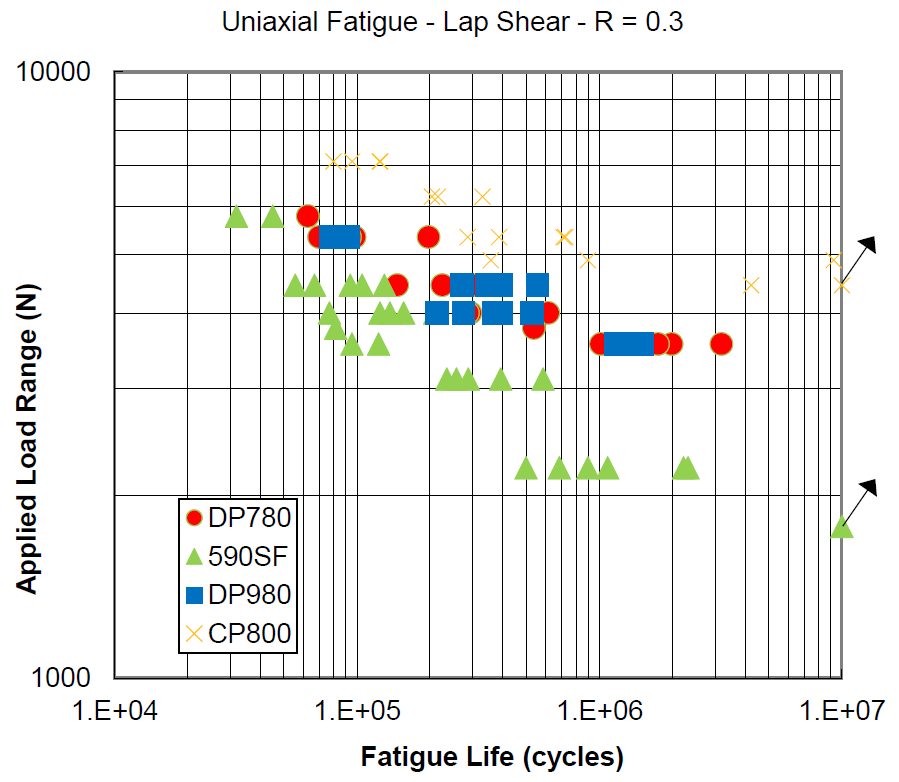
Figure 5: Results of Fatigue Testing in Tension at R= 0.3.M-13
Weld root cracking dominated in the 590 SF, as well as the DP 780 and DP 980, with an example shown in Figure 6. Weld toe cracking was observed on the 2.8-mm-thick CP 800, with an example shown in Figure 7.
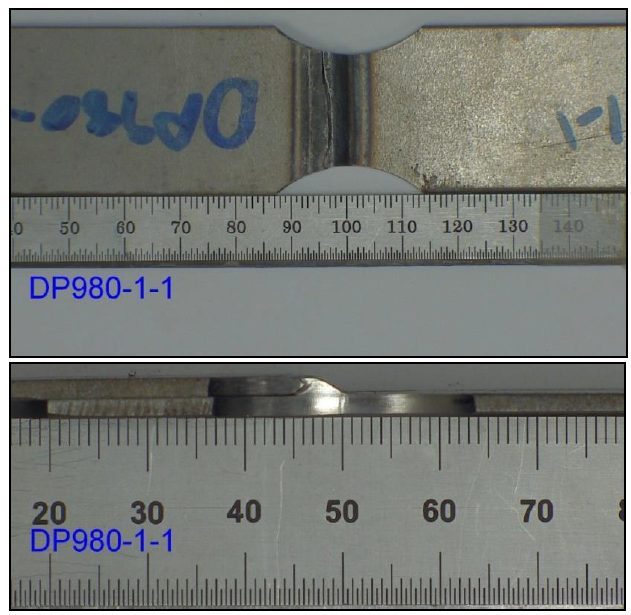
Figure 6: Example for a Root Crack Breaking Through the Weld Metal on DP 980.M-13
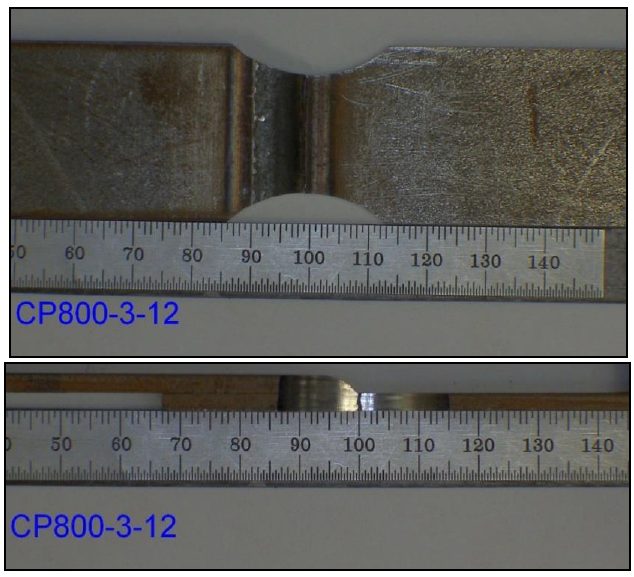
Figure 7: Example of a Toe Crack Breaking Through the Base Metal.M-13
Fatigue testing in bending at R = -1 gave lifetimes between 30,000 and 2 million cycles, with run-outs on tests that continued to up to 7 million cycles, as shown in Figure 8.
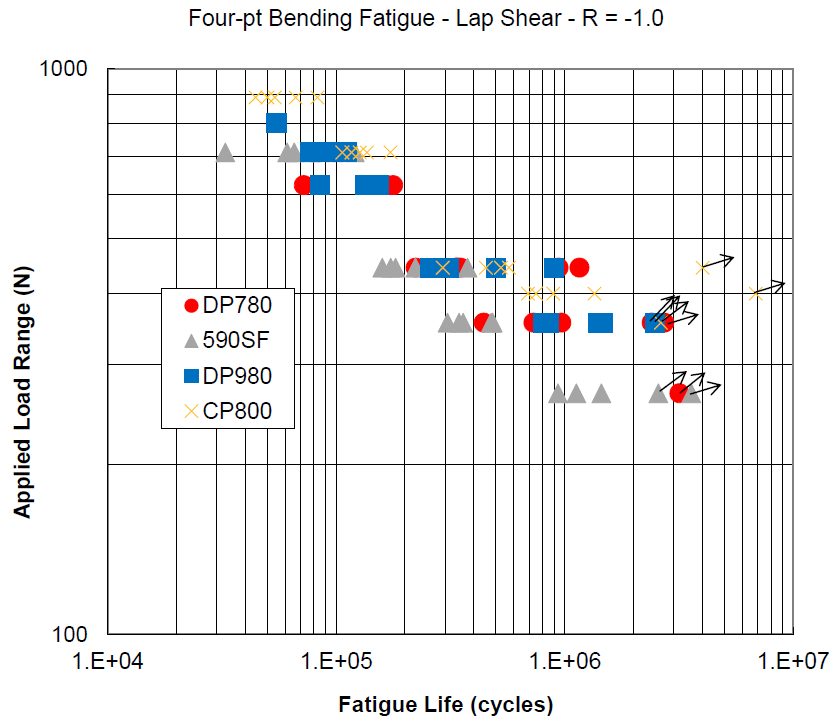
Figure 8: Four-Point Bending Tests at R = -1.M-13
Taking the differing thicknesses, minor variations in minimum width, and the stress concentrations from the radii into account, the concentrated stress range was calculated to compare the four materials on a common basis, as shown in Figure 9.
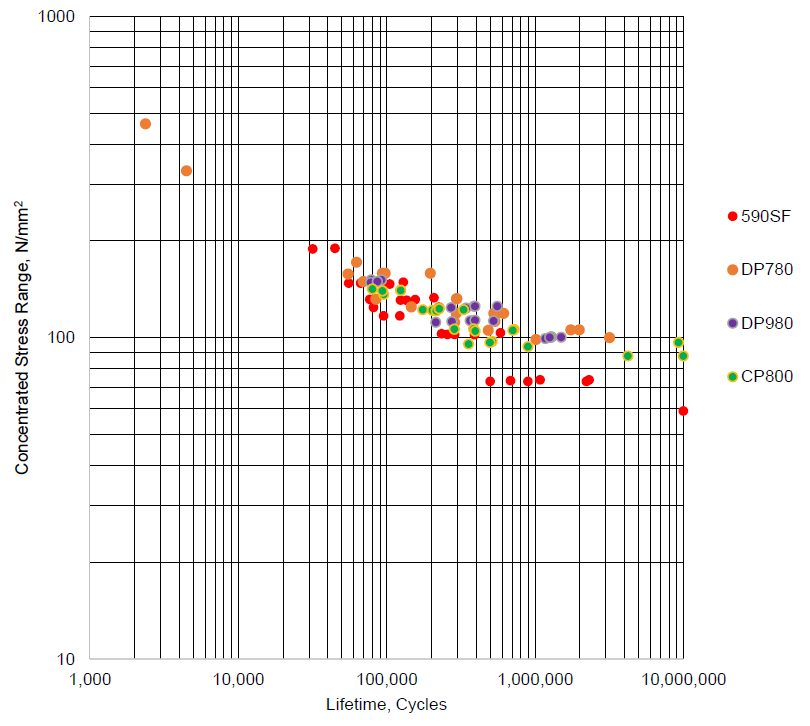
Figure 9: Concentrated Stress Range versus Lifetime for Tension Tests.M-13
The fatigue cracks initiated at the root for the 1.8-mm 590 SF on both tension and bending testing. The fatigue cracks initiated at the weld toe for the 2.8-mm CP 800 on both tension and bending testing. The fatigue cracks initiated from the weld root in the tension testing and from primarily the weld cap in bending testing, for the 2.0-mm-thick DP 780 and 2.0-mm-thick DP 980.
Arc Welding
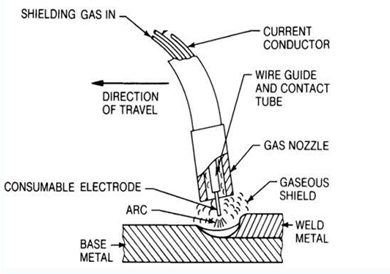
Gas Metal Arc Welding: Introduction
Gas Metal Arc Welding (GMAW) (Figure 1), commonly referred to by its slang name “MIG” (metal inert gas welding) uses a continuously fed bare wire electrode through a nozzle that delivers a proper flow of shielding gas to protect the molten and hot metal as it cools. Because the wire is fed automatically by a wire feed system, GMAW is one of the arc welding processes considered to be semi-automatic. The wire feeder pushes the electrode through the welding torch where it makes electrical contact with the contact tube, which delivers the electrical power from the power supply and through the cable to the electrode. The process requires much less welding skill than Shielded Metal Arc Welding (SMAW) or Gas Tungsten Arc Welding (GTAW) [LINK TO SECTION] and produces higher deposition rates.
Figure 1: GMAW
The basic equipment components are the welding gun and cable assembly, electrode feed unit, power supply, and source of shielding gas. This set up includes a water-cooling system for the welding gun which is typically necessary when welding with high duty cycles and high current.
GMAW became commercially available in the late 1940s offering a significant improvement in deposition rates and making welding more efficient. Deposition rates are much higher than for SMAW and GTAW, and the process is readily adaptable to robotic applications. Because of the fast welding speeds and ability to adapt to automation, it is widely used by automotive and heavy equipment manufacturers, as well as a wide variety of construction and structural welding, pipe and pressure vessel welding, and cladding applications. It is extremely flexible and can be used to weld virtually all metals. Relative to SMAW, GMAW equipment is a bit more expensive due to the additional wire feed mechanism, more complex torch, and the need for shielding gas, but overall it is still relatively inexpensive.
GMAW is “self-regulating”, which refers to the ability of the machine to maintain a constant arc length at all times. This is usually achieved using a constant-voltage power supply, although some modern machines are now capable of achieving self-regulation in other ways. This self-regulation feature results in a process that is ideal for mechanized and robotic applications.
Figure 2 provides important GMAW terminology. Of particular importance is electrode extension. As shown, electrode extension refers to the length of filler wire between the arc and the end of the contact tip. The reason for the importance of electrode extension is that the longer the electrode extension, the greater the amount of resistive (known as I2R) heating that will occur in the wire. Resistive heating occurs because the steel wire is not a good conductor of electricity. This effect can become significant at high currents and/or long extensions, and can result in more of the energy from the power supply being consumed in the heating and melting of the wire, and less in generating arc heating. As a result, significant resistive heating can result in a wider weld profile with less penetration or depth of fusion. The stand-off distance is also an important consideration. Distances that are excessive will adversely affect the ability of the shielding gas to protect the weld. Distances that are too close may result in excessive spatter build-up on the nozzle and contact tip. Various gases are being used for shielding the in GMAW process. The most common ones include argon (Ar), helium (He), and carbon dioxide (CO2) and combinations of these. Figure 3 illustrates the effect of the shielding gas on the weld profile.
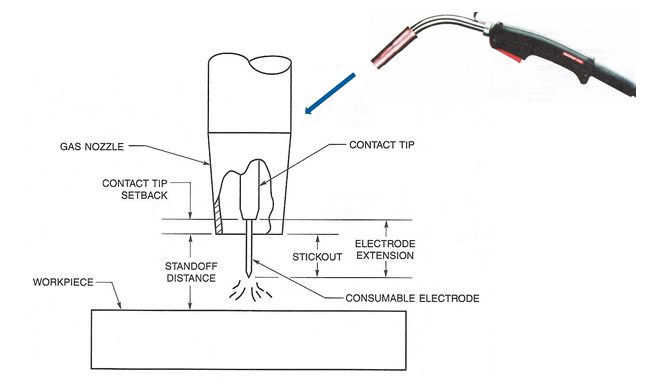
Figure 2: Common GMAW terminology
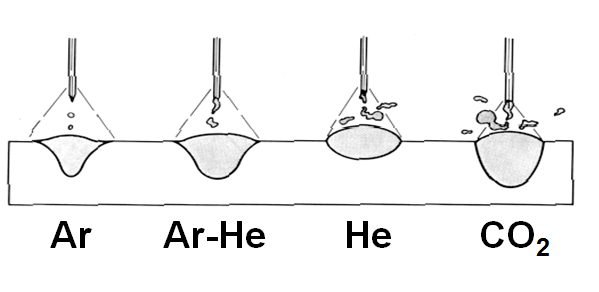
Figure 3: Effect of shielding gas on weld profile
AWS A5.18 is the carbon steel filler metal specification for SMAW, and includes both filler metal for both GMAW and GTAW. A typical electrode is shown on Figure 4. The “E” refers to electrode and the “R” refers to rod which means the filler metal can be used either as a GMAW electrode which carries the current, or as a separate filler metal in the form of a rod that could be used for the GTAW process. The “S” distinguishes this filler metal as solid (vs. the “T” designation which refers to a tubular GCAW electrode or “C” for composite electrode), the number, letter, or number/letter combination which follows the S refers to a variety of information about the filler metal such as composition, recommended shielding gas, and/or polarity.
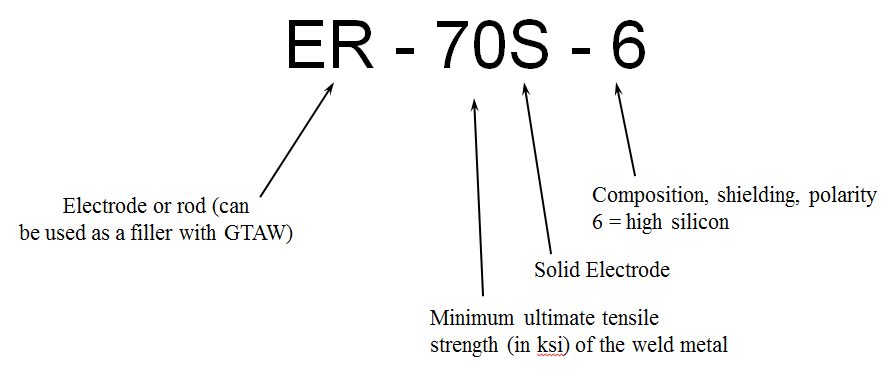
Figure 4: Typical AWS A5.18 electrode.
In summary, the GMAW process offers the following advantages and limitations:
- Advantages:
- Higher deposition rates than SMAW and GTAW
- Better production efficiency vs. SMAW and GTAW since the electrode or filler wire does need to be continuously replaced
- Since no flux is used there is minimal post-weld cleaning required and no possibility for a slag inclusion
- Requires less welder skill than manual processes
- Easily automated
- Can weld most commercial alloys
- Deep penetration with spray transfer mode
- Depending on the metal transfer mode, all position welding is possible
- Limitations:
- Equipment is more expensive and less portable than SMAW equipment
- Torch is heavy and bulky so joint access might be a problem
- Various metal transfer modes add complexity and limitations
- Susceptible to drafty conditions
GMAW Procedures and Properties
Despite the increase alloying content used for Q&P 980, there is no increased welding defect type or rate compared with mild steel Gas Metal Arc Welding (GMAW) welds. Figure 5 is the microhardness profile of 1.6-mm Q&P 980’s GMAW weld joint. Both welded seam and HAZ are all less than 500 HV, and there is no obvious softened zone in HAZ.B-4
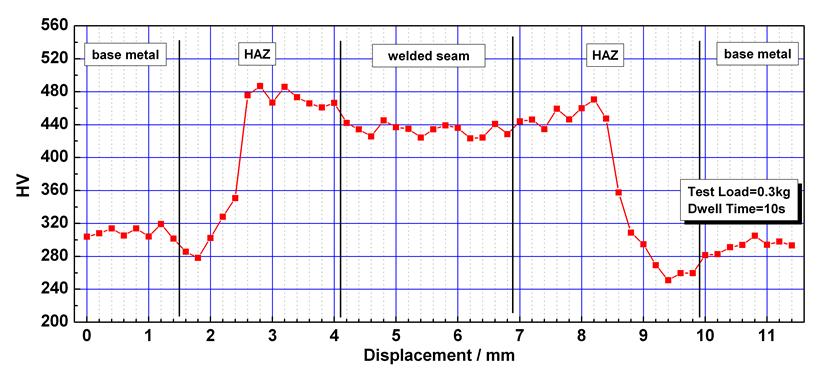
Figure 5: Microhardness profile of 1.6-mm DP 980’s GMAW weld joint. B-4
GMAW was used on three steels studied under a range of conditions. The left represents the FZ location and the middle is the HAZ. The figures show various degrees of HAZ hardening and softening depending on material grade and other conditions. The highest hardness occurs in the near HAZ, while the softest point is in the far HAZ. DP 980 [LINK TO THE MATERIAL IN METALLURGY] shows the greatest degree of HAZ hardening and softening. The nominally high CR condition is a combination of low heat input and heat sink. The plots show that CR tends to have the largest effect on the DP steels, with the TRIP steel being somewhat less affected. Pre-strain has the largest effect on the TRIP Base Metal (BM) , increasing the BM hardness by about 25%. The hardness of the softest location of the TRIP 780 HAZ is also increased by pre-strain, although degree of softening (about 20%) is not significantly changed. Pre-straining increased the DP 780 BM hardness by only about 10%. Pre-straining did not affect the peak HAZ hardness for either material. Post-baking did not appear to have a significant influence on the HAZ hardness profiles of the DP 780 material or the TRIP 780 material, regardless of pre-strain condition (Figures 6 through 8).
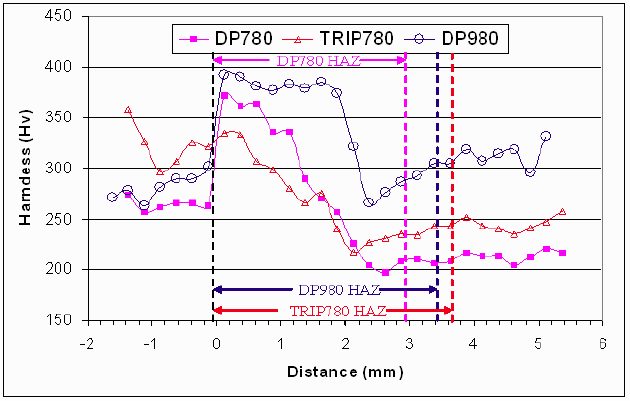
Figure 6: Hardness profiles of DP 780, TRIP 780, and DP 980 lap welds produced with the nominally high CR, no pre-strain or post-baking.P-7

Figure 7: Hardness profiles of DP 780 and TRIP 780 welds
produced both with and without pre-strain for the high CR condition.E-1
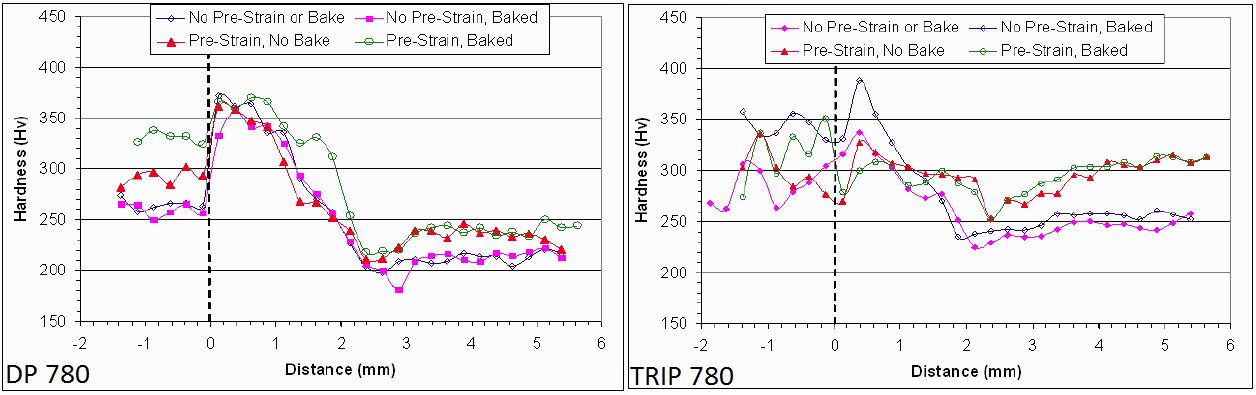
Figure 8: Hardness profiles of DP 780 and TRIP 780 welds produced both
with and without post-baking for both pre-strained sheet and not pre-strained
sheet for the nominally high CR condition.E-1
TRIP 780 lap joint static tensile results for different filler metal and CR conditions are shown in Figure 9. The results are expressed in terms of joint efficiency and the strain at peak load. The data indicates joint efficiencies ranged from about 50% to about 98%. Strains at peak load ranged from less than 3% to nearly 8%. Fracture occurred either in the far HAZ or at the weld fusion boundary. Filler metal strength had no discernable effect on the tensile properties. Figure 9 shows static tensile test results of the TRIP 780 butt joints. All the welds failed in the softened region of the far HAZ with joint efficiencies in excess of 89%. On average, welds made using higher CR experienced higher strains during loading than those made using lower CR. As was the case with the lap welds, filler metal strength did not appear to influence the static tensile properties. The abbreviations of high and low “CR” indicate high and low CR used for each weld.
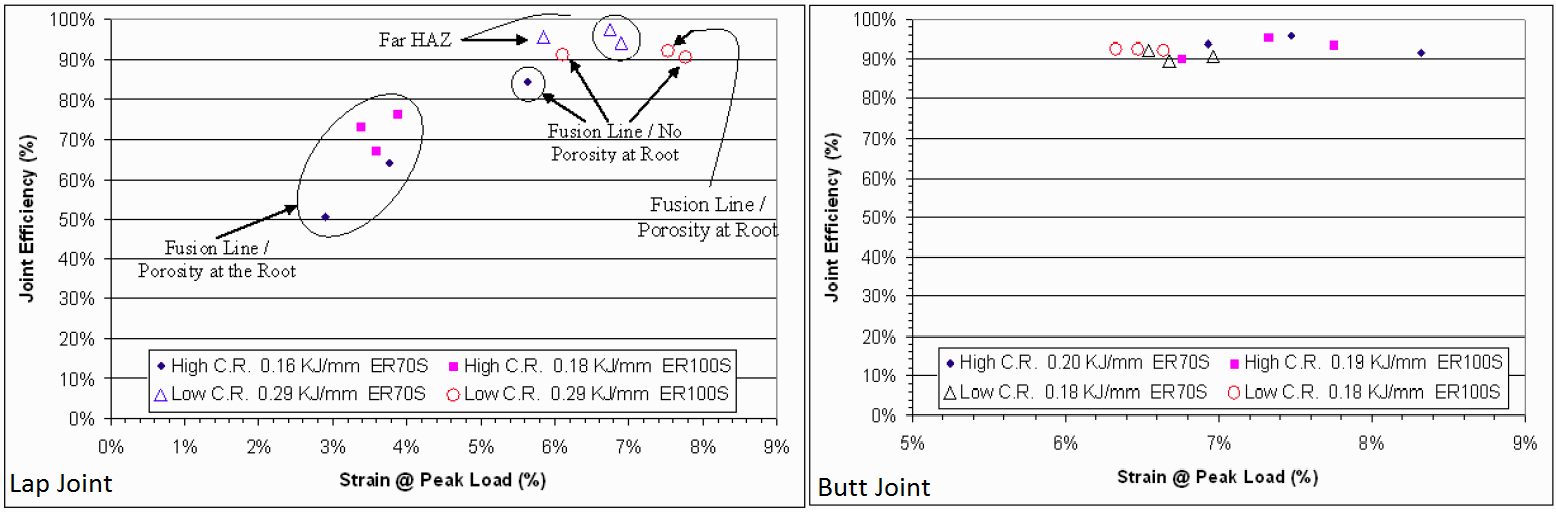
Figure 9: Static tensile test results of TRIP 780 lap and butt joints.E-1
The static tensile test results of the DP 780 butt welds are shown in Figure 10. All welds failed in the softened region of the far HAZ. As shown, the high CR welds had joint efficiencies in excess of 90%. The high CR welds also appear to have slightly greater strains at peak load.
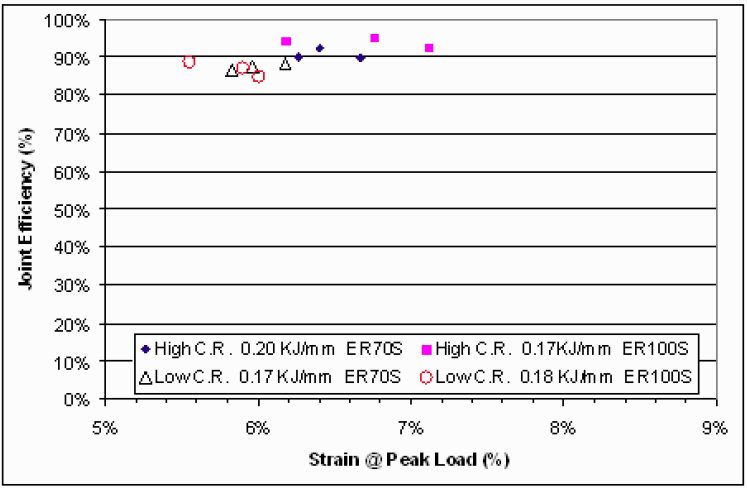
Figure 10: Static tensile test results of DP 780 butt joints.E-1
Figure 11 (left) shows the TRIP 780 lap joint dynamic tensile results for different filler metal and CR conditions. UTS ranged from 372 to 867 MPa (54 to 126 ksi) and strain at peak load ranged from less than 1% to over 5%. The high CR lap joints had lower strengths and strains at peak load. These welds failed along the fusion line presumably due to porosity present at the root. All the low CR lap welds produced with the ER70S-6 wire failed in far HAZ of the bottom sheet. Of the low CR lap joints produced with the ER100S-G wire, two dynamic tensile specimens failed in the softened region of the far HAZ, and one failed along the fusion line of the top sheet without the presence of porosity at the weld root. Analysis of Figure 11 (left) indicates that filler metal strength did not have a distinguishable effect on the dynamic tensile test results. Figure 11 (right) shows the dynamic tensile test results of the TRIP 780 butt joints. All failed in the softened region of the far HAZ. The UTS of the butt joints ranged from 840 to 896 MPa (122 to 130 ksi), and strain at peak load was generally between 3 and 4%. The figure indicates that neither filler metal strength nor CR condition had a distinguishable effect on the dynamic tensile test results of the butt joints.
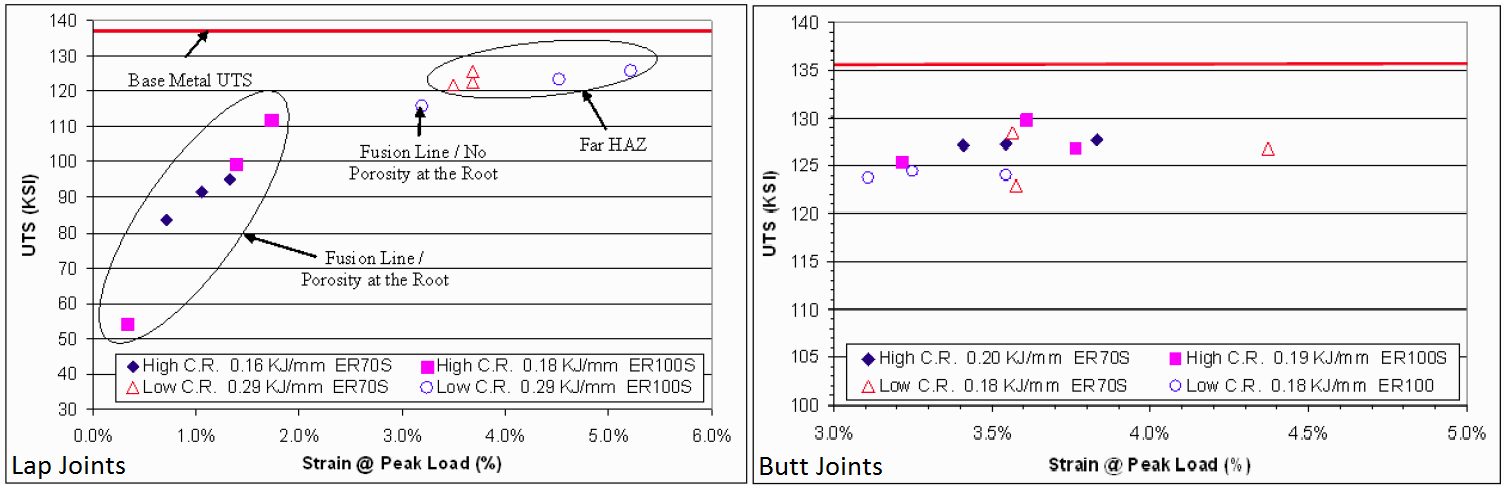
Figure 11: Dynamic tensile test results of TRIP 780 lap joints and butt joints.E-1
The dynamic tensile test results of the DP 780 butt joints are shown in Figure 12. All failed in the softened region of the far HAZ. UTS ranged from 841 to 910 MPa (122 to 132 ksi), and strain at peak load ranged from 2.25% to less than 4.0%. It should be noted that similar UTS were obtained for the DP 780 and TRIP 780 butt joints. On average, TRIP 780 butt joints had slightly higher strain at peak load. Neither filler metal strength nor CR condition appears to have a distinguishable effect on the dynamic tensile properties.
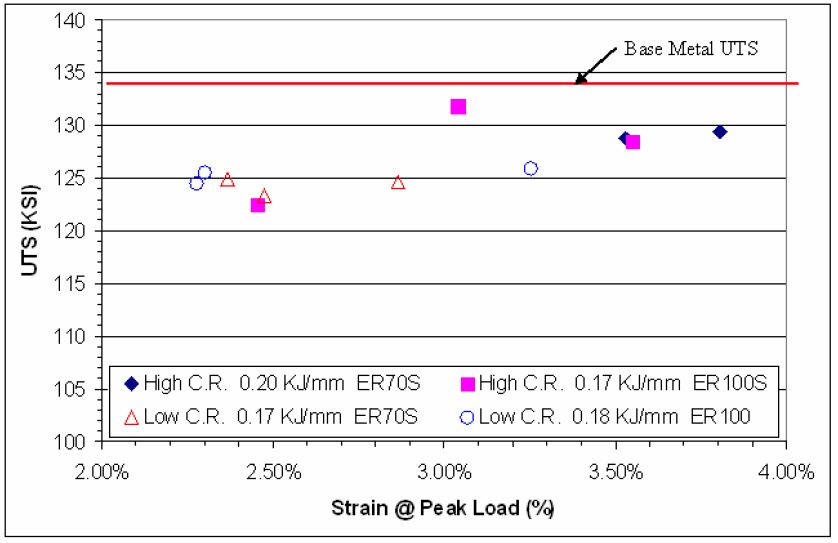
Figure 12: Dynamic tensile test results of DP 780 butt joints.E-1
Back To Top


