Automotive Welding Process Comparison
Introduction
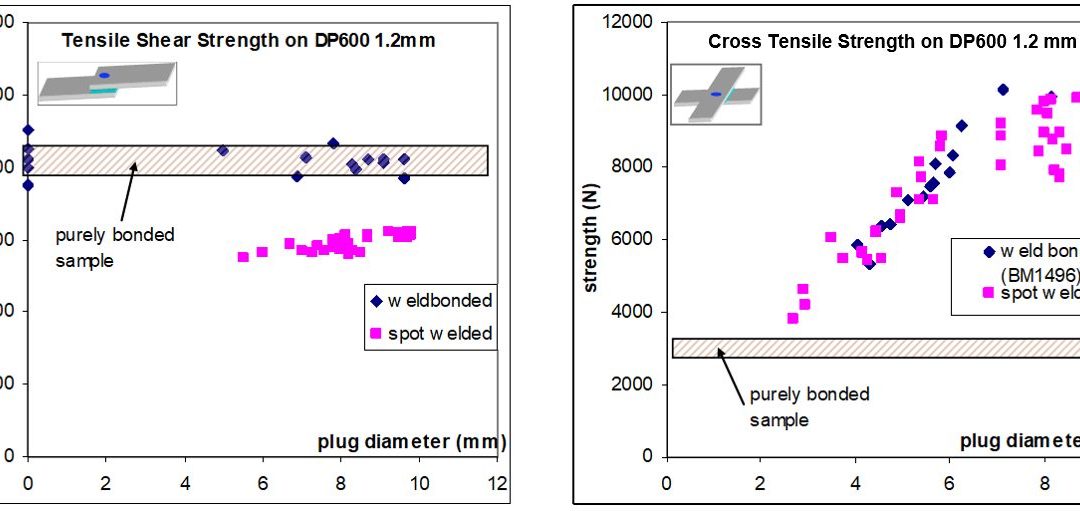
A solution to improve the spot weld strength is to add a HS adhesive to the weld. Figure 1 illustrates the strength improvement obtained in static conditions when crash adhesive (example: Betamate 1496 Dow Automotive) is added. The trials are performed with 45-mm-wide and 16-mm adhesive bead samples.
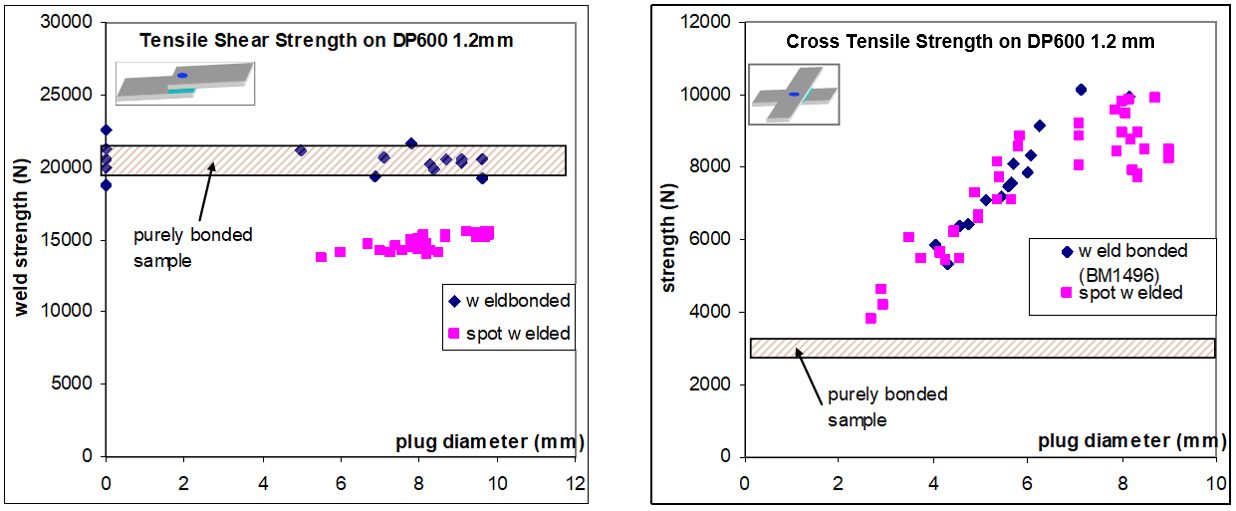
Figure 1: TSS and CTS on DP 600.A-16
Another approach to improve the strength of welds is done by using laser welding instead of spot welding. The technologies based on remote welding optics have been introduced and a high productivity can be obtained. The effective welding time is maximized and a wide variety of weld geometries becomes feasible. Compared to spot welding, the main advantage of laser welding, regarding mechanical properties of the joint, is the possibility to adjust the weld dimension to the requirement. One may assume that, in tensile shear conditions, the weld strength depends linearly of the weld length (Figure 2).
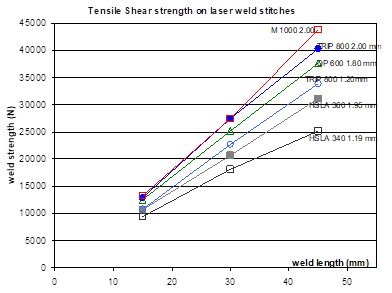
Figure 2: Tensile-shear strength on laser weld stitches of different length.A-16
Comparing spot weld strength with laser weld strength cannot be restricted to the basic tensile shear test. Tests were performed to evaluate the weld strength in both quasi-static and dynamic conditions under different solicitations, on various UHSS combinations. The trials were performed on a high-speed testing machine, at 5 mm/min for the quasi-static tests and 0.5 m/s for the dynamic tests (pure shear, pure tear or mixed solicitation) (Figure 3). The strength at failure and the energy absorbed during the trial have been measured. It should be noticed that the energy absorbed depends also on the deformation of the sample. However, as all the trials were made according to the same sample geometry, the comparison of the results is relevant. Laser stitches were done with a 27-mm length. C- and S-shape welds were performed with the same overall weld length. This lead s to various apparent length and width of the welds. A shape factor, expressed as the ratio width/length of the weld, can be defined according to Table 1.
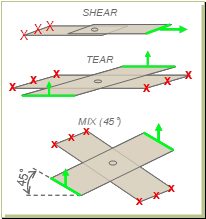
Figure 3: Sample geometry for quasi-static and dynamic tests. A-16
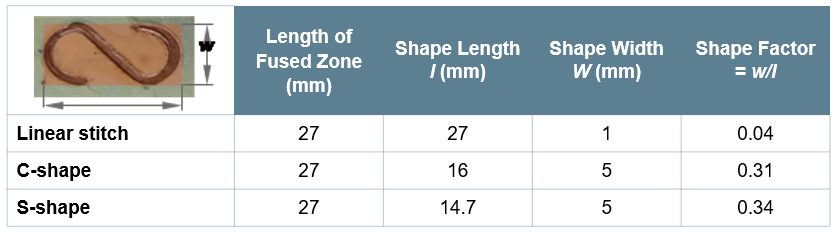
Table 1: Shape factor definition.A-16
The weld strength at failure can be easily described with an elliptic representation, with major axes representing pure shear and normal solicitation (Figure 4). For a reference spot weld corresponding to the upper limit of the weldability range, globally similar weld properties can be obtained with 27-mm laser welds. The spot weld equivalent length of 25-30 mm has been confirmed on other test cases on UHSS in the 1.5- to 2-mm range thickness. It has also been noticed that the spot weld equivalent length is shorter on thin mild steel (approximately 15-20 mm). This must be considered in case of shifting from spot to laser welding on a given structure. There is no major strain rate influence on the weld strength; the same order of magnitude is obtained in quasi-static and dynamic conditions.
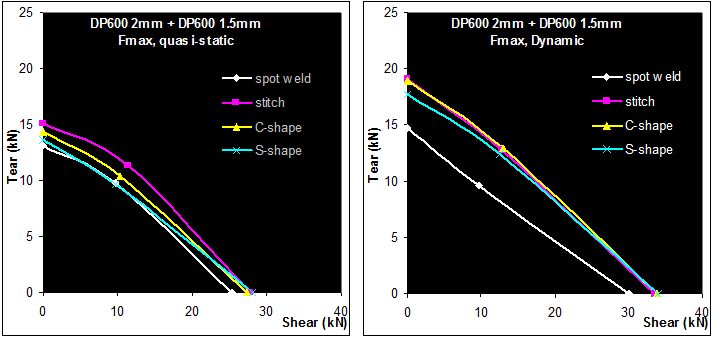
Figure 4: Quasi-static and dynamic strength of welds, DP 600 2 mm+1.5 mm.A-16
The results in terms of energy absorbed by the sample are seen in Figure 5. In tearing conditions, both the strength at fracture and energy are lower for the spot weld than for the various laser welding procedures. In shear conditions, the strength at fracture is equivalent for all the welding processes. However, the energy absorption is more favorable to spot welds. This is due to the different fracture modes of the welds. IF fracture is observed on the laser welds under shearing solicitation (Figure 6). Even if the strength at failure is as high as for the spot weds, this brutal failure mode leads to lower total energy absorption.
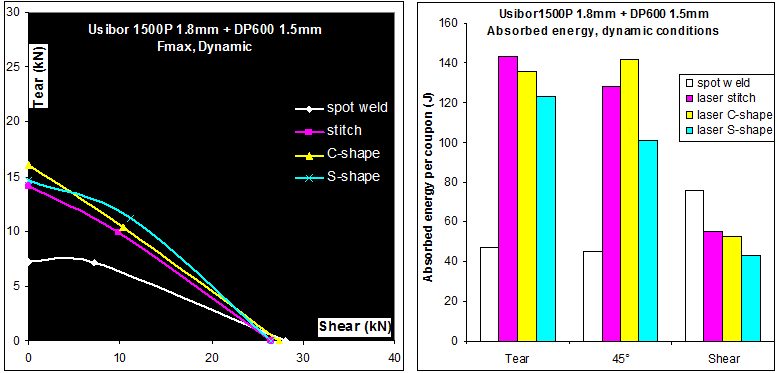
Figure 5: Strength at fracture and energy absorption of HF1500P 1.8-mm + DP 600 1.5-mm samples for various welding conditions. A-16
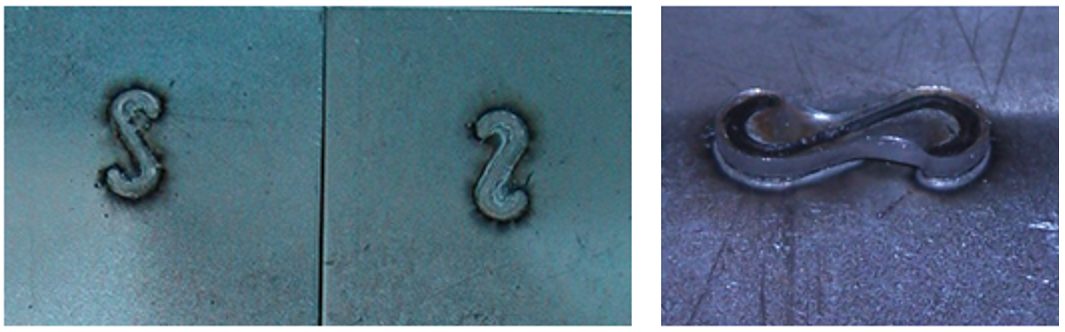
Figure 6: IF fracture mode (left), “plug-out” fracture mode (right).A-16
Figure 7 represents the energy absorbed by omega-shaped structures and the corresponding number of welds that fail during the frontal crash test (here on TRIP 800 grade). It appears clearly that laser stitches have the highest rate of fracture during the crash test (33%). In standard spot welding, some weld fractures also occur. It is known that UHSS are more prone to partial IF fracture on coupons, and some welds fail as well during the crash test. By using either Weld-Bonding or adapted laser welding shape, there is no more weld fractures during the test, even if the parts are severely crashed and deformed. As a consequence, higher energy absorption is also observed.
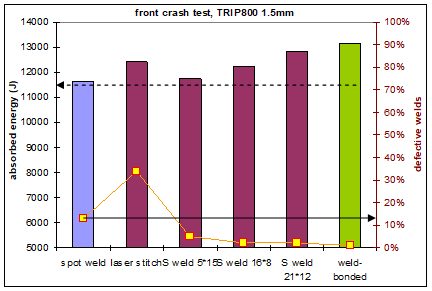
Figure 7: Welding process and weld shape influence on the energy absorption and weld integrity on frontal crash tests. A-16
Regarding stiffness, up to 20% improvement can be obtained. The best results are obtained with continuous joints, and particularly using adhesives. Adhesive bonding and weld- bonding lead to the same results of the stiffness improvement only being due to the adhesive, not to the additional welds.
Figure 8 shows the evolution of the torsional stiffness with the joining process.
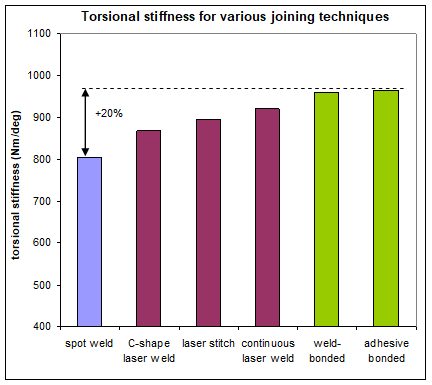
Figure 8: Evolution of the torsional stiffness with the joining process.A-16
Optimized laser joining design leads to same performances as a weld bonded sample regarding fracture modes seen in Figure 9.
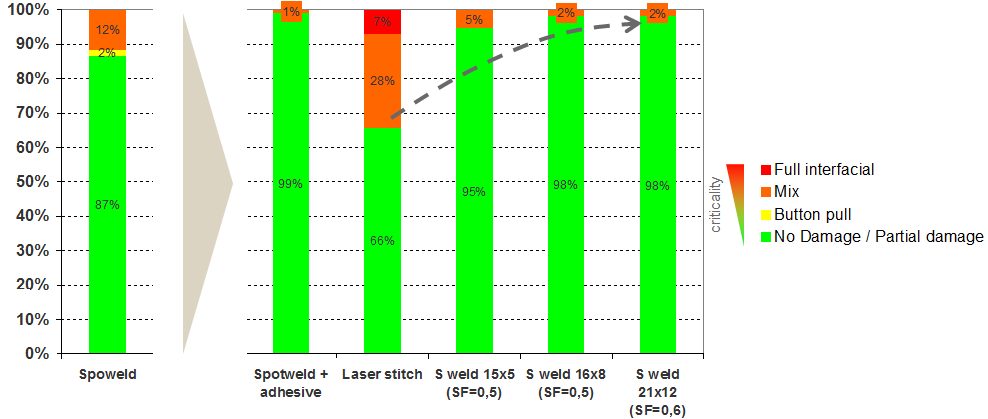
Figure 9: Validation test case 1.2-mmTRIP 800/1.2-mm hat-shaped TRIP 800.
Top-hat crash boxes were tested across a range of AHSS materials including DP 1000. The spot weld’s energy absorbed increased linearly with increasing material strength. The adhesives were not suitable for crash applications as the adhesive peels open along the entire length of the joint. The welded bond samples perform much better than conventional spot welds. Across the entire range of materials there was a 20-30% increase in mean force when WB was used. The implications of such a large increase in crash performance are very significant. The results show that when a 600 MPa steel is weld bonded it can achieve the same crash performance as a 1000 MPa steel in spot-welded condition. It is also possible that some down gauging of materials could be achieved, but as the strength of the crash structure is highly dependent upon sheet thickness only small gage reductions would be possible.
Figure 10 shows the crash results for spot-welded and weld-bonded AHSS.
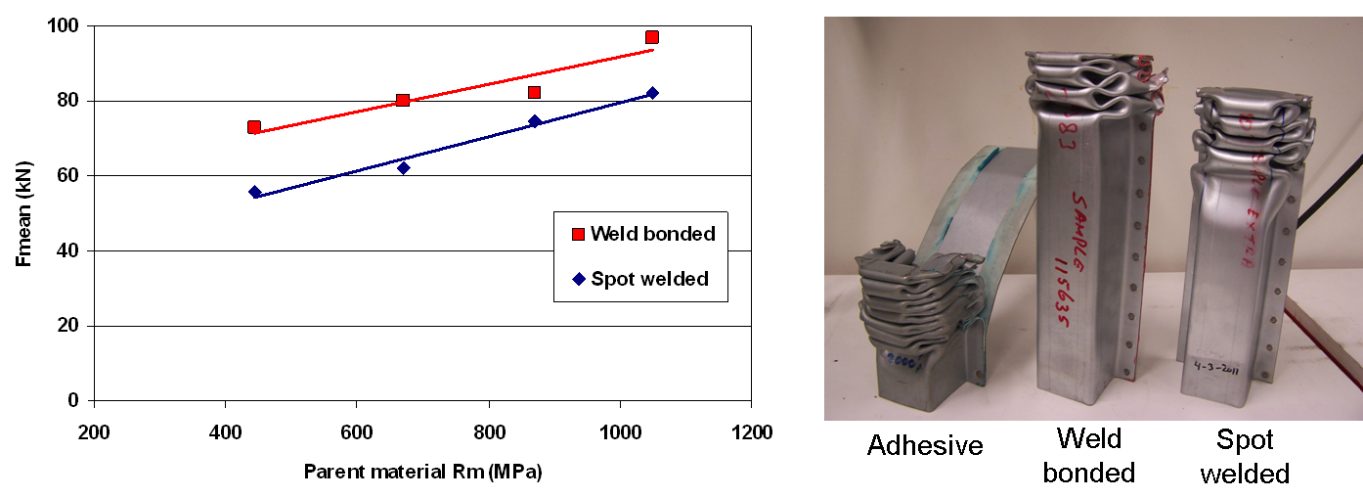
Figure 10: Crash results for spot-welded and weld-bonded AHSS.
There are numerous welding processes available for the welding of AHSS in automotive applications. Each of these processes has advantages and disadvantages that make them more or less applicable for particular applications. These qualities include joint efficiency, joint fit-up and design, joint strength, and stiffness, fracture mode, and cost effectiveness (equipment cost, production rates, etc.). The following data can allow for comparisons to be made for automotive application welding and joining processes, as well as possible repair substitutions.
Many tests were performed using lap and coach joints, reduced specimen overlap distance, and adjusted weld sizes to more closely represent typical joints consistent with automotive industry acceptance criteria. The tests were aimed at providing a baseline reference for a wide variety of welding and joining processes and material combinations. In general, there was no correlation between joint efficiency, normalized energy, and normalized stiffness. Joint efficiency was calculated by dividing the peak load of the joint by the peak load of the parent metal. Some processes, joint configurations and material combinations have high joint efficiency and energy, while others result in high joint efficiency but low energy. Few processes showed high values for all metrics across all materials and joint configurations (Figure 11). It was observed that peak loads tended to increase, on average, as material strength increased for lap joints (Figure 12). However, joint efficiency generally decreased as material strength increased. Therefore, joint strength did not increase in proportion to parent material strength increase for most of the processes and materials studied. Coach joints generally showed lower joint efficiency and stiffness than lap joints (Figure 13). Process and material combinations should be selected based on the required performance, joint design, and cost.A-12
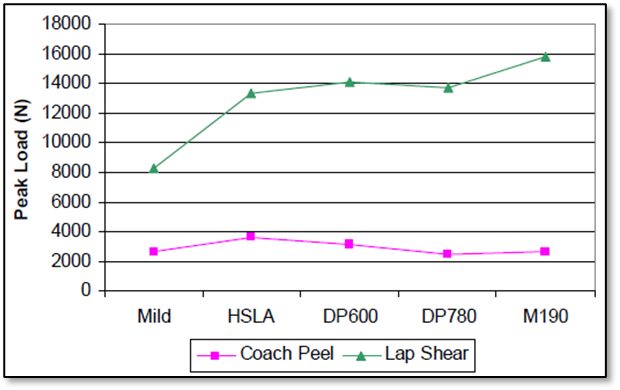
Figure 11: Average peak loads (all processes combined).A-12
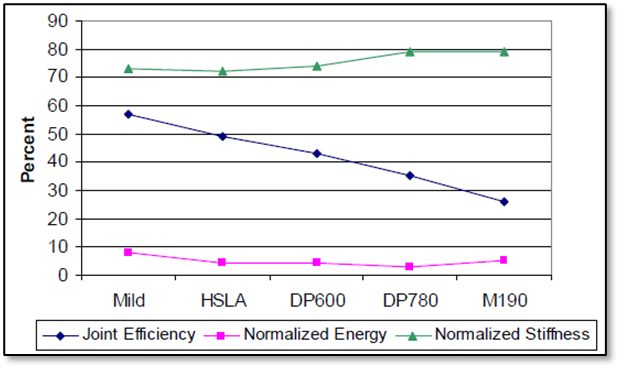
Figure 12: Lap shear average joint efficiency, normalized energy and stiffness (all processes combined).A-12
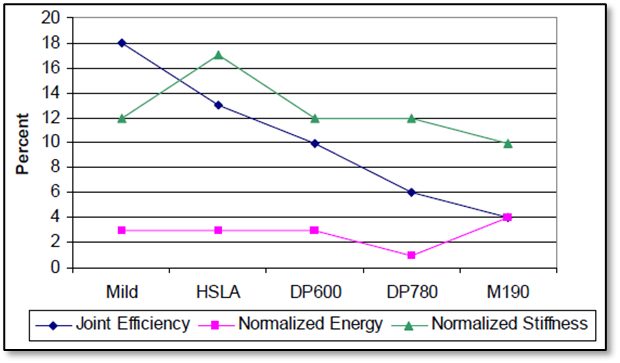
Figure 13: Coach peel average joint efficiency, normalized energy and stiffness (all processes combined).A-12
All Processes General Comparison
Numerous tests were performed using the most popular automotive joining processes including RSW, GMAW/brazing, laser welding/brazing, mechanical fasteners, and adhesive bonding. Joint efficiency and normalized energy of all the processes were compared for HSLA steels, DP 600 samples, DP 780 samples, and M190 samples. Joint efficiency was calculated as the peak load of the joint divided by the peak load of the parent metal. Energy was calculated as the area under the load/displacement curve up to peak load.
The materials used consisted of 1.2-mm EG HSLA, 1.2-mm galvanized DP 600, 1.0-mm GA DP 780, and 1.0-mm EG M190. The testing configuration matrix (Table 2) lists the materials and process combinations studied. The tolerance of weld lengths is ±10%. Lap-shear joints were centered in the overlap for all processes except lap fillet welds and brazes. Coach-peel joints were centered in the overlap for all processes (Figure 14). A-12
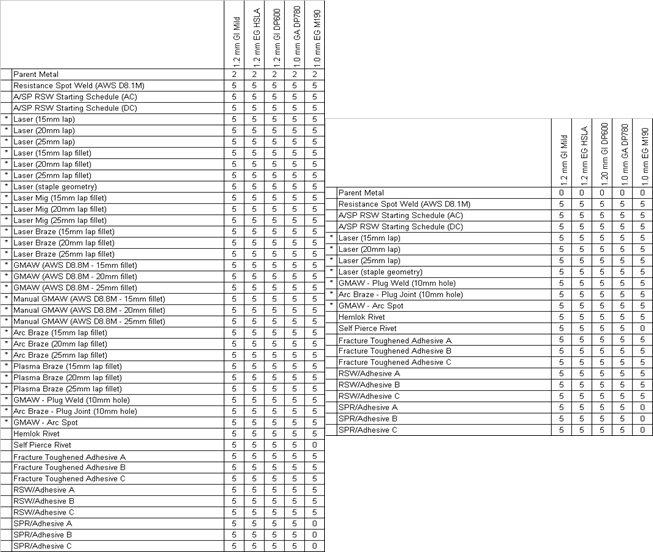
Table 2: Lap-shear (left) and coach-peel (right) test configuration matrix.A-12
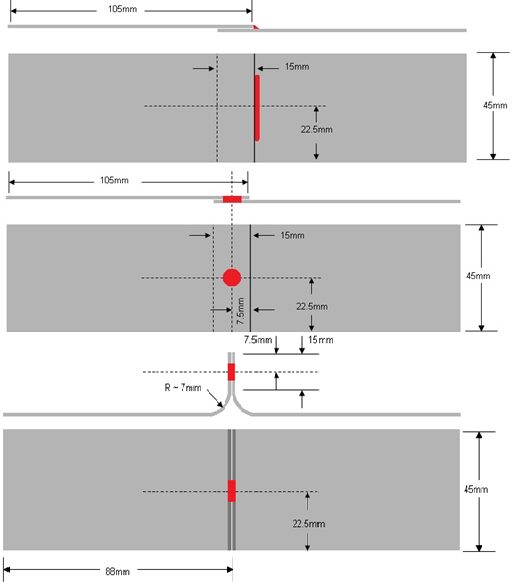
Figure 14: Lap-shear and coach-peel set-up.A-12
DP 600 samples, DP 780 samples, and M190 samples. Joint efficiency was calculated as the peak load of the joint divided by the peak load of the parent metal. Energy was calculated as the area under the load/displacement curve up to peak load.
Self-piercing riveting with adhesive gave the greatest overall joint efficiency for the HSLA lap shear tests, while laser obtained the largest normalized energy (Figure 15a and 15b).
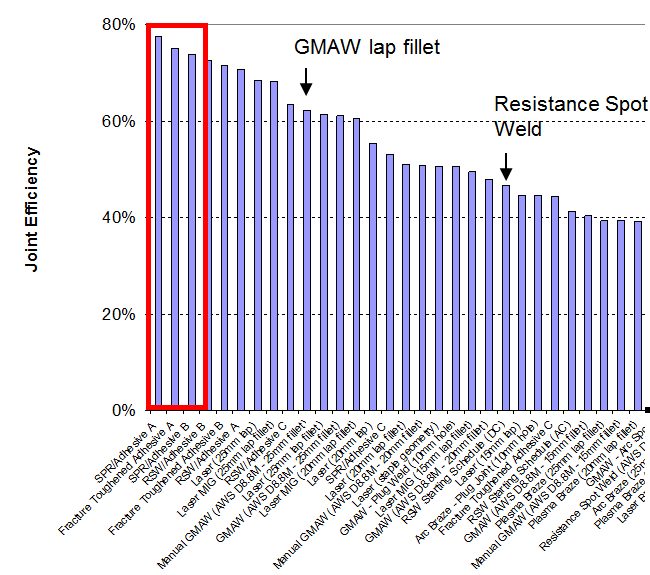
Figure 15a: Joint efficiency of HSLA lap-shear tests for all processes.A-12
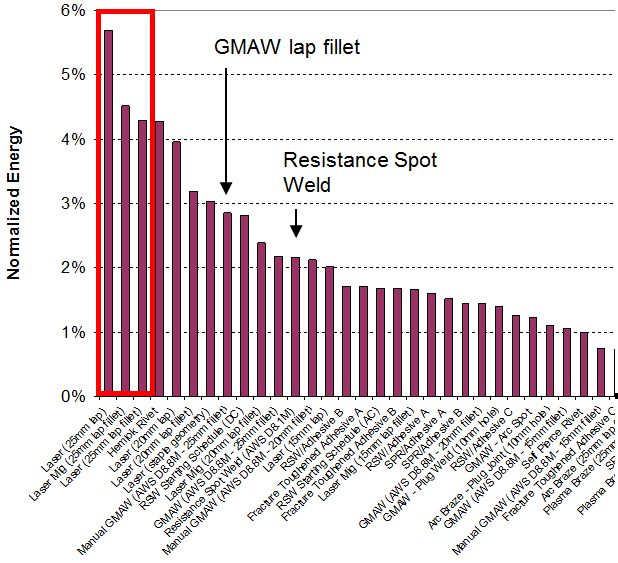
Figure 15b: Normalized energy of HSLA lap-shear tests for all processes.A-12
Self-penetrating riveting with adhesive gave the greatest overall values for both joint efficiency and normalized energy for lap shear testing of DP 600 samples (Figure 16a and 16b). However, coach peel testing of DP 600 obtained the best results with laser welding (Figure 17).
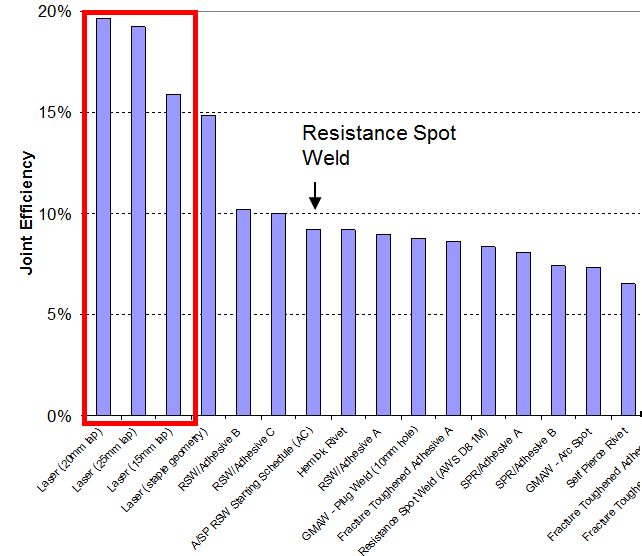
Figure 17a: Joint efficiency of DP 600 lap shear for all processes.A-12
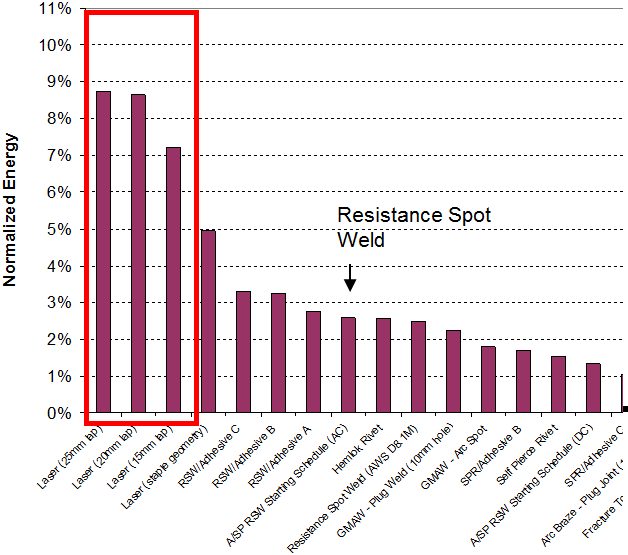
Figure 16b: Normalized energy of DP 600 lap shear for all processes.A-12
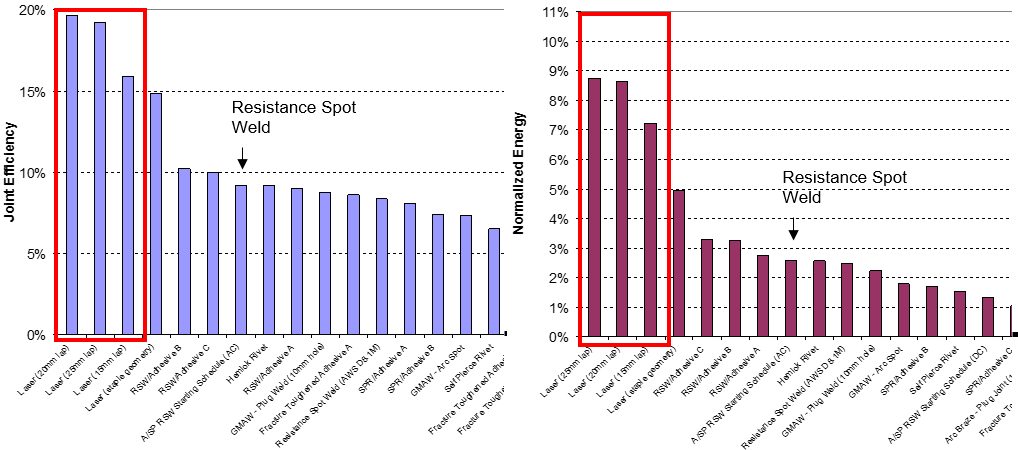
Figure 17: Joint efficiency and normalized energy of DP 600 coach peel for all processes.A-12
For the DP 780 lap-shear test, the best results out of all the tested processes were from laser/MIG welding, leading in both joint efficiency and normalized energy (Figure 18). Full laser welding produced the best results for coach-peel tests of the DP 780 samples (Figure 19).
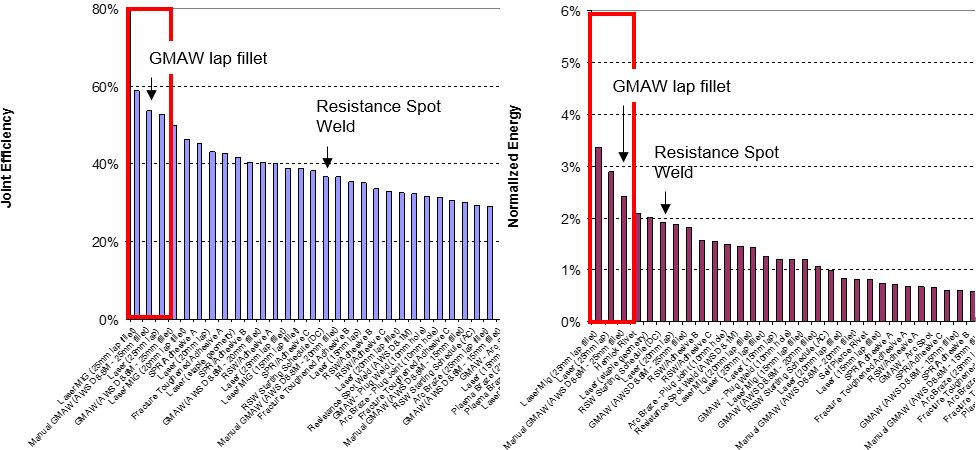
Figure 18: Joint efficiency and normalized energy of DP 780 lap shear for all processes.A-12
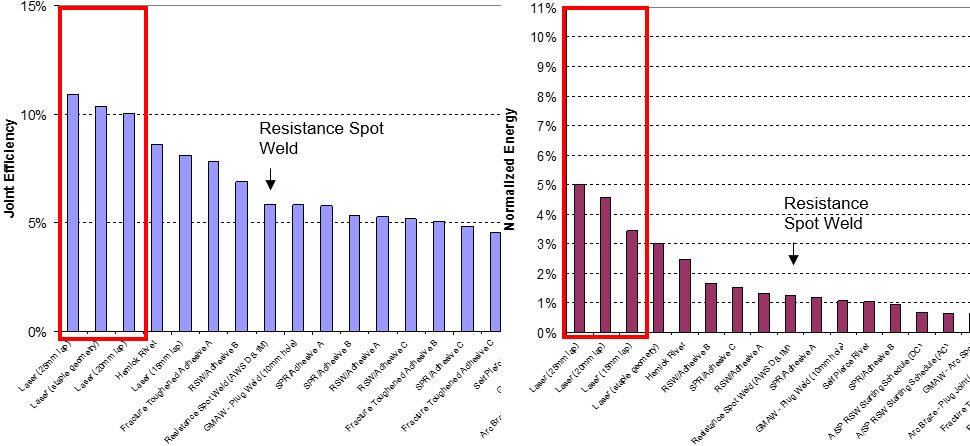
Figure 19: Joint efficiency and normalized energy of DP 780 coach peel for all processes.A-12
The M190 lap-shear samples had the best joint efficiency using RSW with adhesive, but full laser welding gave better normalized energy (Figure 20). The coach peel tests also had the best normalized energy with full laser welding. The best joint efficiency of the coach peel tests was produced from laser welding with staples (Figure 21).
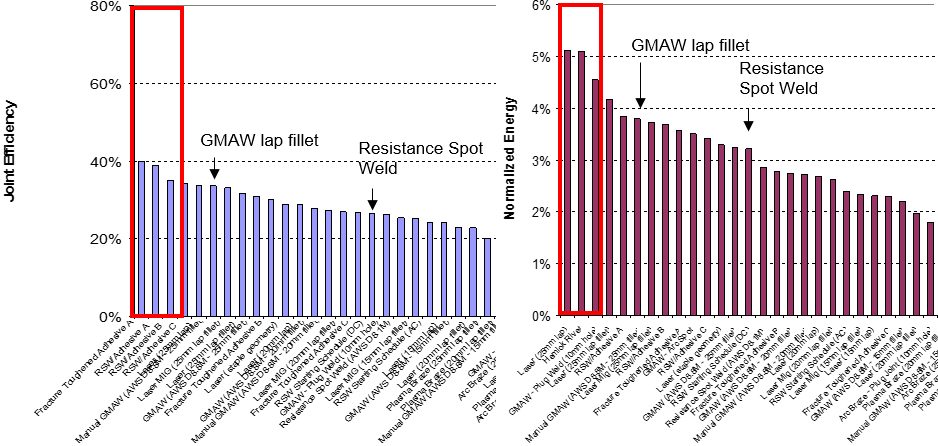
Figure 20: Joint efficiency and normalized energy of M190 lap shear for all processes.A-12
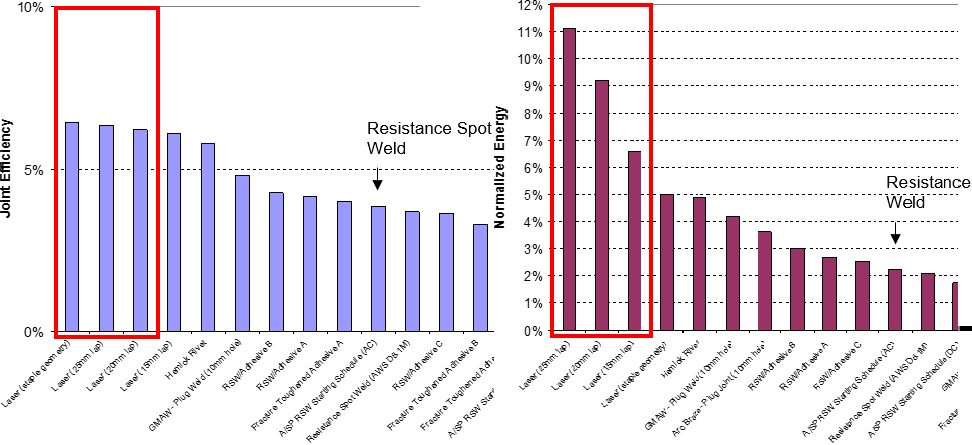
Figure 21: Joint efficiency and normalized energy of M190 coach peel for all processes.A-12
Cost Effectiveness Comparison: Spot Welding to Spot/Laser Welding Mixture
When automotive manufacturers are weighing the advantages and disadvantages of RSW to those of a spot/laser welding mixture process, cost effectiveness is a major concern. Spot/laser mixture welding has 38% lower operation cost compared to full spot welding because the laser installation performs more welds than a spot welding robot. Also, there are fewer robots to maintain and less consumables. The global cost is similar, but the spot/laser solution is about 4% less expensive overall. Figure 22 shows a cost comparison of spot welding and spot/laser welding.
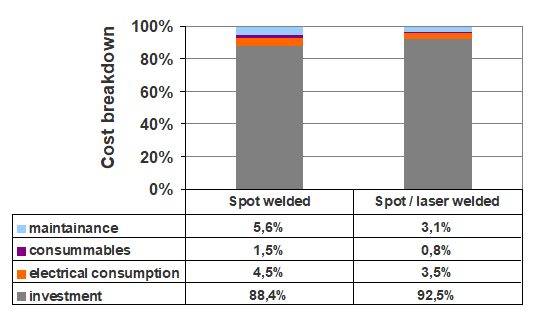
Figure 22: Cost comparison of spot welding and spot/laser welding.A-16
GMAW Compared to Laser Welding
When comparing the advantages and disadvantages of GMAW to those of laser welding in automotive applications, joint efficiency is a key subject. Numerous welds were made using both processes on 15- and 25-mm-thick pieces of materials varying in strength. All results showed that laser welding continuously had greater joint efficiency than GMAW (Figure 23).
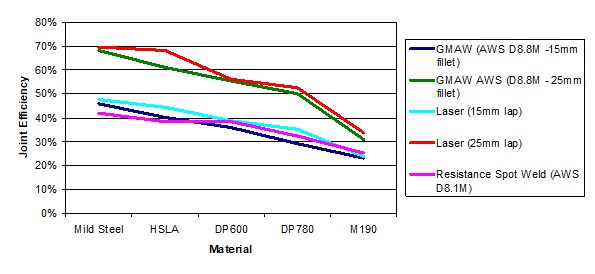
Figure 23: Joint efficiency of GMAW and laser welding for various steel strengths.
Back To Top
Mechanical Joining
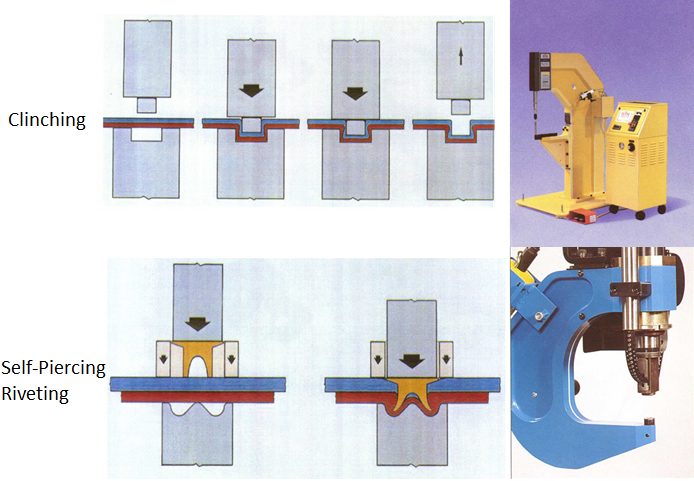
Examples of mechanical joining in automotive manufacturing are clinching and self-piercing riveting. The process steps and typical equipment for both processes are shown in Figure 1. A simple round punch presses the materials to be joined into the die cavity. As the force continues to increase, the punch side material is forced to spread outward within the die side material.
Figure 1: Process steps and equipment for mechanical joining in automotive industries.
This creates an aesthetically round button, which joins cleanly without any burrs or sharp edges that can corrode. Even with galvanized or aluminized sheet metals, the anti-corrosive properties remain intact as the protective layer flows with the material. Table 1 shows characteristics of different mechanical joining methods.
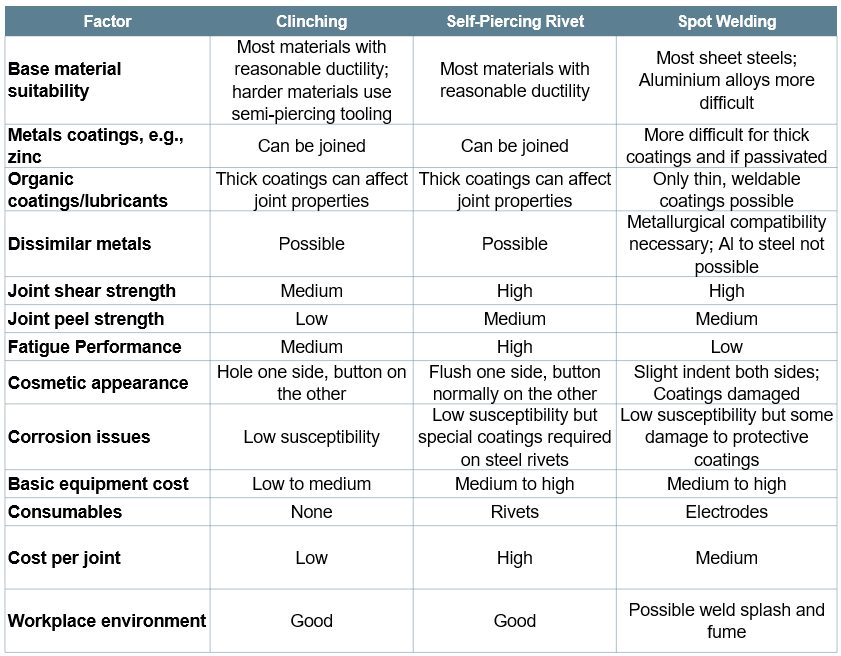
Table 1: Characteristics of mechanical joining systems.T-12
In a recent study conducted to assess the feasibility of clinch joining advanced HSST-8, it was concluded that 780-MPa DP and TRIP [link to steel material grades] steels can be joined to themselves and to low-carbon steel (see Figure 2). However, 980 DP steel showed tears when placed on the die side (Figure 3). These cracks were found at the ferrite- martensite boundaries (Figure 4). However, these tears did not appear to affect the joint strength. More work is needed to improve the local formability of 980 MPa tensile strength DP steel for successful clinch joining.
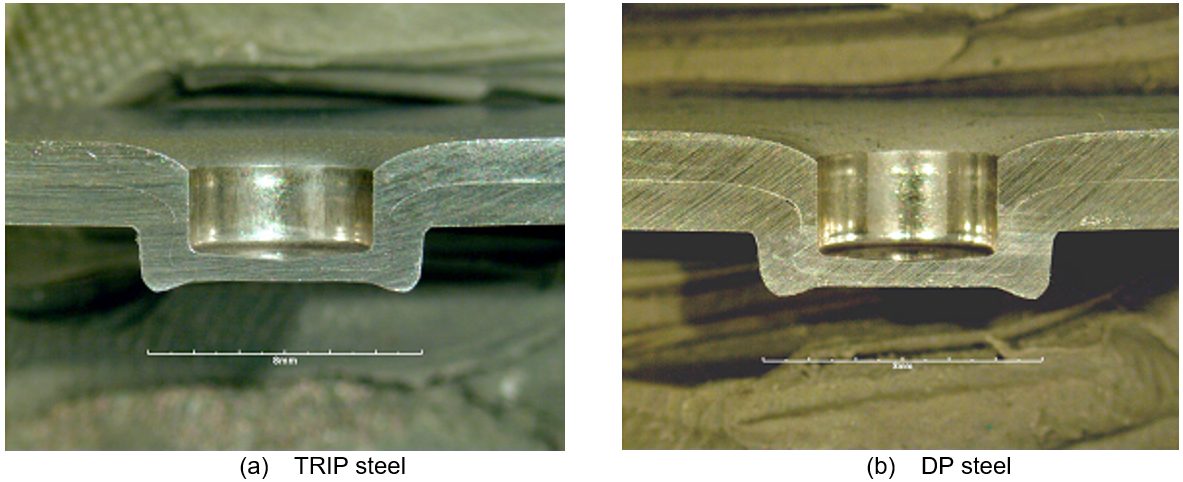
Figure 2: Cross sections of successful clinch joints in 780-MPa tensile.
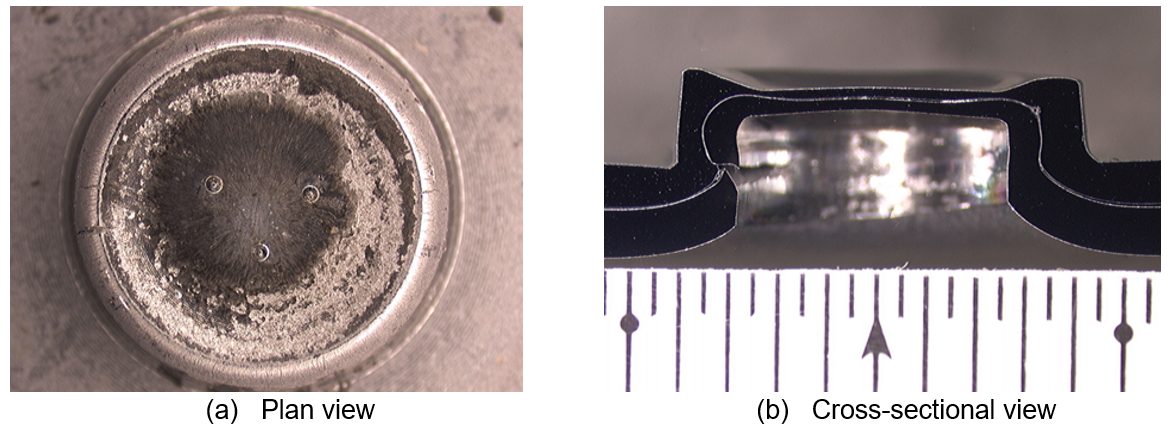
Figure 3: Clinch joint from DP 980-MPa steel showing tears on the die side.
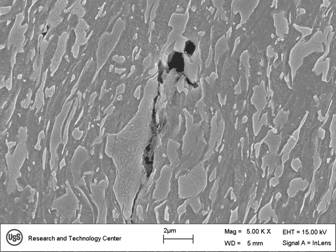
Figure 4: SEM views of tears found in DP 980-MPa steel clinch joints.
Circular clinching without cutting and self-piercing riveting (existing half-hollow-rivets) are not recommended for materials with less than 40% hole expansion ratio (λ) as shown in Figure 5. Clinching with partial cutting may be applied instead.
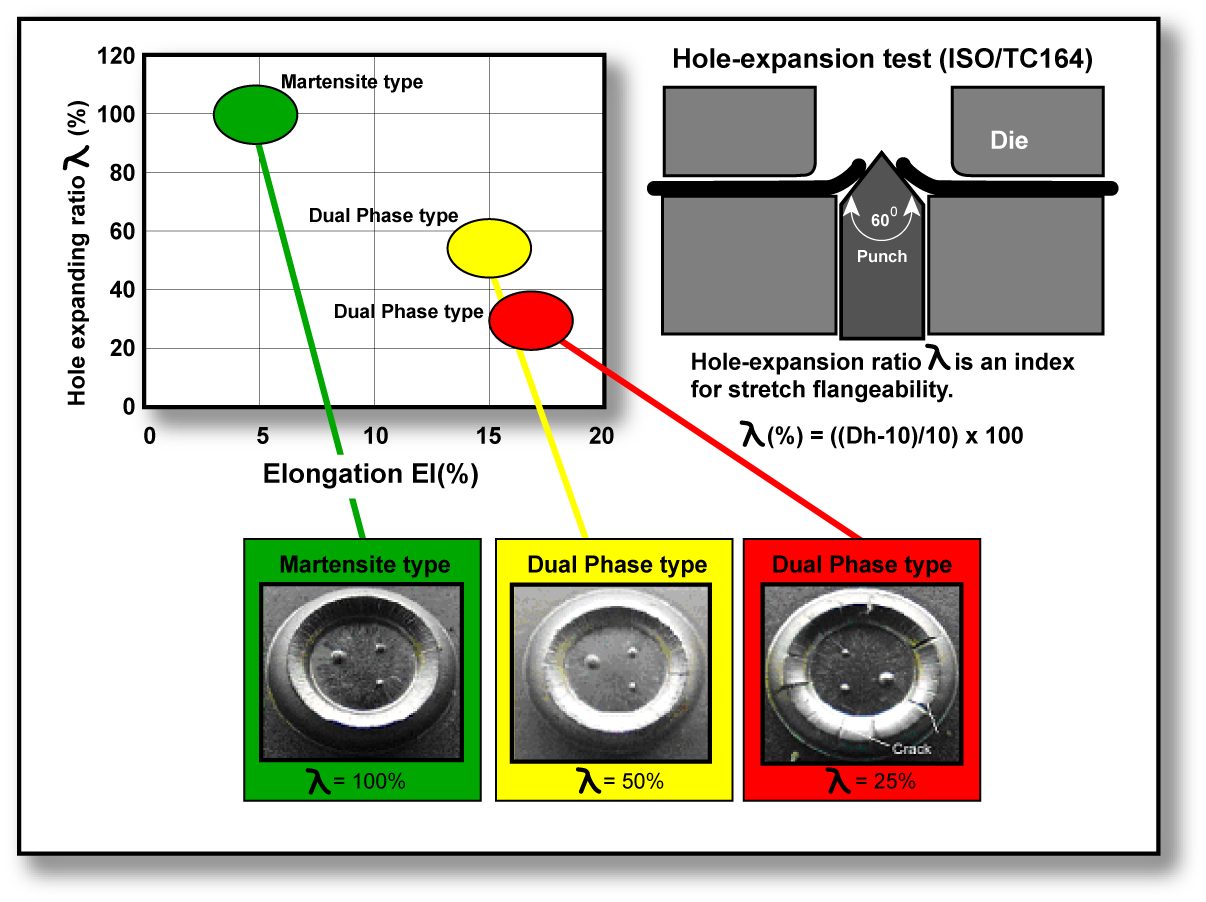
Figure 5: Balance between elongation and stretch flangeability of 980-MPa tensile-strength class AHSS and surface appearance of mechanical joint at the back side.N-1
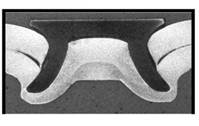
Figure 6: Example of DP 300/500 with a self-piercing rivet.G-2
Warm clinching and riveting are under investigation for material with less than 12T total elongation. As with any steel, equipment size and clinch/pierce force are proportional to the material strength and tool life is inversely proportional to material strength.
The strength of self-piercing riveted AHSS is higher than for mild steels. Figure 4.P-6 shows an example of a self-piercing rivet joining two sheets of 1.5-mm-thick DP 300/500. AHSS with tensile strengths greater than 900 MPa cannot be self-piercing riveted by conventional methods today.
Self-piercing rivet joints are typically similar or slightly weaker in strength when compared to spot welds. It is largely dependent on the punch-die size, design, and rivet size. However, self-piercing rivets usually perform better in fatigue loading compared to spot welds because there is no notch effect such as what exists in spot-welded joints Figure 7 (left)]. Although clinch joining is being used in several automotive applications, their performance is lower as shown in Figure 7 (right). Thus, they are not recommended for critical joints in automotive manufacturing.
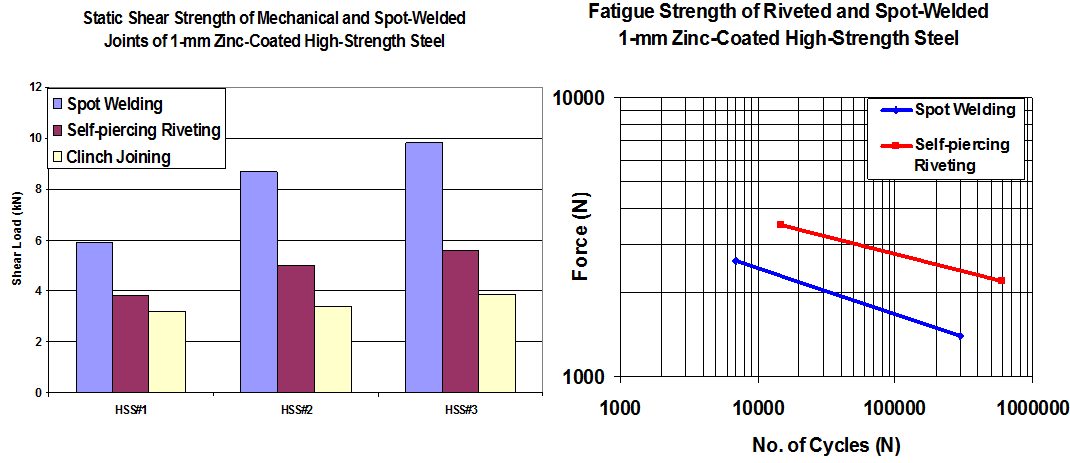
Figure 7: Strength performance for various mechanical joining methods.
Hybrid Riveting Adhesive
Self-piercing rivets can also be combined with adhesives to result in increased initial stiffness, YS, failure loads and fatigue strength when compared to spot welds using adhesives (Figure 8).
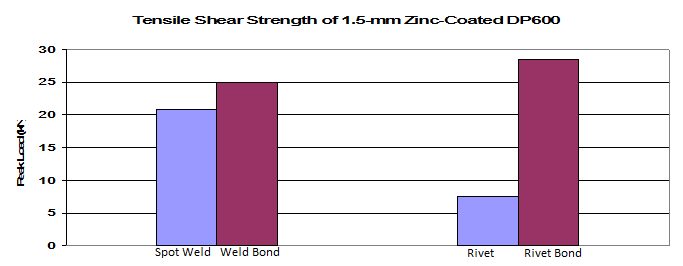
Figure 8: Tensile shear strength of SPR with adhesives and RSW with adhesives.
High Energy Density Welding
The word “laser” is an acronym for “light amplification by stimulated emission of radiation.” Lasers produce a special form of light (electromagnetic energy) consisting of photons that are all of a single coherent wavelength. Light of this form can be focused to extremely small diameters allowing for the creation of the high-energy densities used for welding. The laser beam itself is not useful for welding until it is focused by a focusing lens.
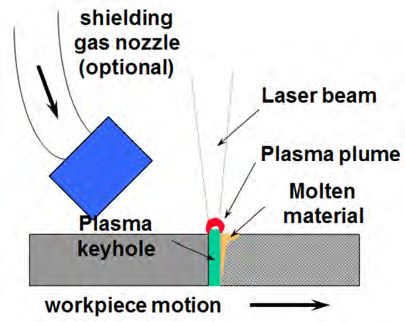
Figure 1: Laser beam welding.
Lasers vary in the quality of the beam produced. A high-quality beam will diffract less when focused, providing for the creation of a smaller spot size. Reflective lenses are important to lasers as well since they are used in the optical cavity where the beam is generated, as well in the beam delivery systems for some lasers. For these reasons, optics play a major role in laser beam welding.
Laser beam welding (Figure 1) does not require additional filler metal and shielding gas is optional. When the beam hits the workpiece, it melts and vaporizes metal atoms, some of which are ionized by the intense beam. This creates what is known as a plume (or plasma) over the weld area that can sometimes interfere with the beam. In these cases, shielding gas may be used to deflect the plume.
The choice of laser type depends on cost, the type and thickness of material to be welded and the required speed and penetration. Lasers are distinguished by the medium used to generate the laser beam, and the wavelength of laser light produced. Although there are many types of lasers, the common lasers for welding include the Nd:YAG, fiber, disk solid-state lasers, and the gas-based CO2 laser. The lasing medium in solid-state lasers are crystals (Nd:YAG and disk lasers) or fibers (fiber laser) that have material added (doped) that will “lase” when exposed to a source of energy, whereas the lasing medium in the CO2 laser is a gas blend consisting of CO2, He, and N2 gas. In all cases, “lasing” occurs when the atoms/molecules of the medium are excited to a higher energy state through the introduction of additional energy (known as pumping). When this occurs, photons are emitted, which, in turn, excite other atoms/molecules. This results in a cascade of photons that travel in coherent waves of a single wavelength, the two properties for which laser light is known.
CO2 lasers produce wavelengths of 10.6 µm, while the wavelength of the solid-state lasers is 1.06 µm. CO2 lasers are generally less expensive, but the longer wavelength of light does not allow its beam to be delivered through fiber optic cables which reduces its versatility. Its light is also more reflective, which limits its use with highly reflective metals such as aluminium. The solid-state lasers are generally more compact and require less maintenance than the CO2 laser. They are more conducive to high-speed production since their beams can be delivered through long lengths of fiber optic cable which can then be attached to a robot. Some of the solid-state lasers such as the fiber laser produce beams of outstanding quality. However, the shorter wavelength of these lasers requires additional safety precautions regarding eye protection.
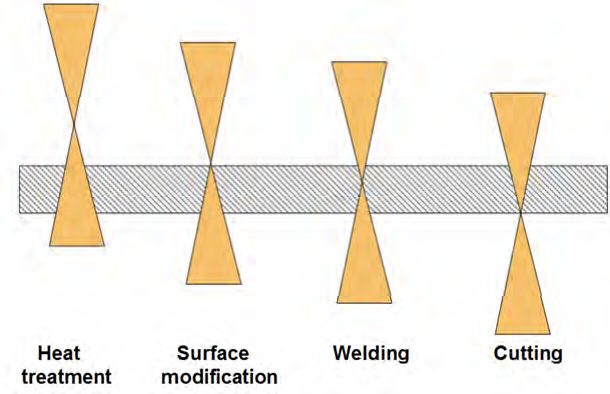
Figure 2: Focusing of the laser beam.
The choices of focus spot size, focus spot location in the joint, and focal length are all important considerations when laser beam welding. Usually, a small focus size is used for cutting and welding, while a larger focus is used for heat treatment or surface modification. As indicated in Figure 2, the location of the beam’s focal point can also be varied based on the application. When welding, it is common to locate the focal point somewhere near the center of the joint. But cutting applications benefit from placing the focal point at the bottom of the joint. Weld spatter onto the focusing lens can sometimes be a problem, especially when there are contaminants on the surface of the parts being welded. Approaches to minimizing the spatter problem include choosing a long focal length lens which keeps the lens a safe distance from the weld area, or the use of an air “knife” to protect the lens. A-11, P-6
In summary, the advantages and limitations of laser beam welding are as follows:
Advantages:
- High energy density process allows for low overall heat input which produces minimal BM degradation, residual stress, and distortion.
- Fast welding speeds.
- No filler metal required.
- Relatively thick (¾ in.) single-pass welds can be made.
- Concentrated heat source allows for the creation of extremely small weld sizes needed for small and intricate components.
- Easily automated, especially with lasers that are conducive to fiber optic delivery.
- Since there is no bulky torch as with most arc welding processes, laser beam welding is capable of welding joints with difficult accessibility.
Limitations:
- Equipment is very expensive
- Portability is usually low
- Requires very tight joint fit-up and accurate positioning of the joint relative to the beam
- Metals that are highly reflective such as Al are difficult to weld with some laser beam welding processes
- High weld CR may create brittle microstructures when welding certain steels
- Laser plume may be a problem
- Energy efficiency of lasers is poor
- Some lasers require special (and expensive) eye protection
- Laser beam welding is complex and requires significant training and knowledge
High Energy Density Welding
Fundamentals and Principles of High Energy Density Welding
High energy density welding processes are those that focus the energy needed for welding to an extremely small size area. This allows for very low overall heat input to the workpiece, which results in minimal BM degradation, residual stress, and distortion. Welding speeds can be very fast. The two main processes known for extreme energy densities are laser (Figure 1) and Electron Beam Welding (EBW).
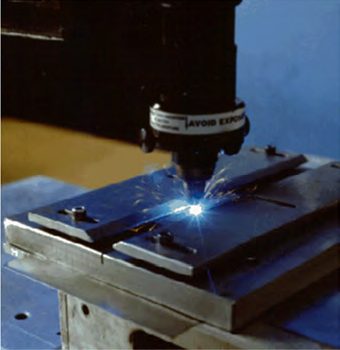
Figure 1: Laser welding.
As shown in Figure 2, energy densities of focused laser and electron beams can approach and exceed 104 kw/cm2. These energy densities are achieved through a combination of high power and beams that are focused to an extremely small diameter. Diameters as small as a human hair (0.05 mm) are possible. PAW[KH1] offers greater energy density than conventional arc welding processes and is sometimes referred to as the “poor man’s laser”.
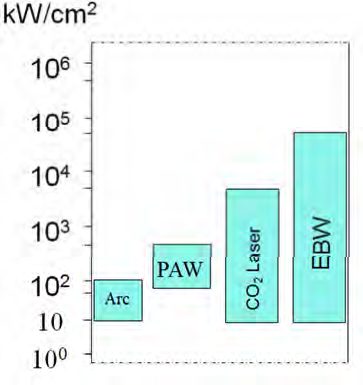
Figure 2: Power densities of various welding processes.
High energy density processes produce weld profiles of high depth-to-width ratio, as compared to other welding processes (Figure 3). As a result, much greater thicknesses can be welded in a single pass, especially with EBW. The figure also illustrates the fact that high energy density processes can produce a weld with minimal heating to the surrounding area as compared to the other processes. However, the high depth-to-width ratio weld profile is much less forgiving to imperfect joint fit-up than the profile produced by arc welding processes.
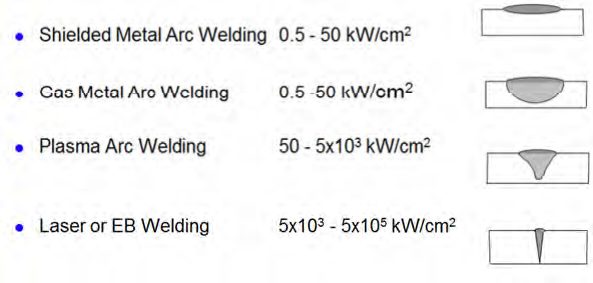
Figure 3: Comparison of typical weld profiles.
Laser and EBW processes are used in a wide variety of industry sectors. Very high weld speeds are possible and the welds are usually aesthetically pleasing. Laser welding is very adaptable to high-speed production so it is common in the automotive sector. The ability to precisely locate welds on smaller sensitive components with minimal heat input makes laser welding very attractive to the medical products industry.
When welding with high energy density processes, the laser or EB is focused along the joint line of the workpieces to be welded. The extreme power density of the beam not only melts the material, but causes evaporation. As the metal atoms evaporate, forces in the opposite direction create a significant localized vapor pressure. This pressure creates a hole, known as a keyhole, by depressing the free surface of the melted metal. The weld solidifies behind the keyhole as it progresses along the joint (Figure 4). This method of welding known as keyhole welding is the most common approach to laser and EB, and produces the characteristic welds of high depth-to-width ratio. There are some cases where the keyhole mode is not used. This mode is known as conductive mode welding. Conductive mode welds have a weld profile closer to that of an arc weld A-11, P-6
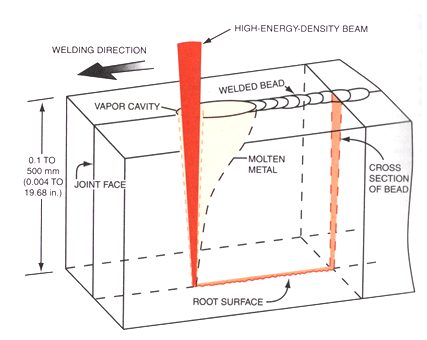
Figure 4: Keyhole mode welding.
High Energy Density Welding
Butt Welds and Tailor-Welded Products
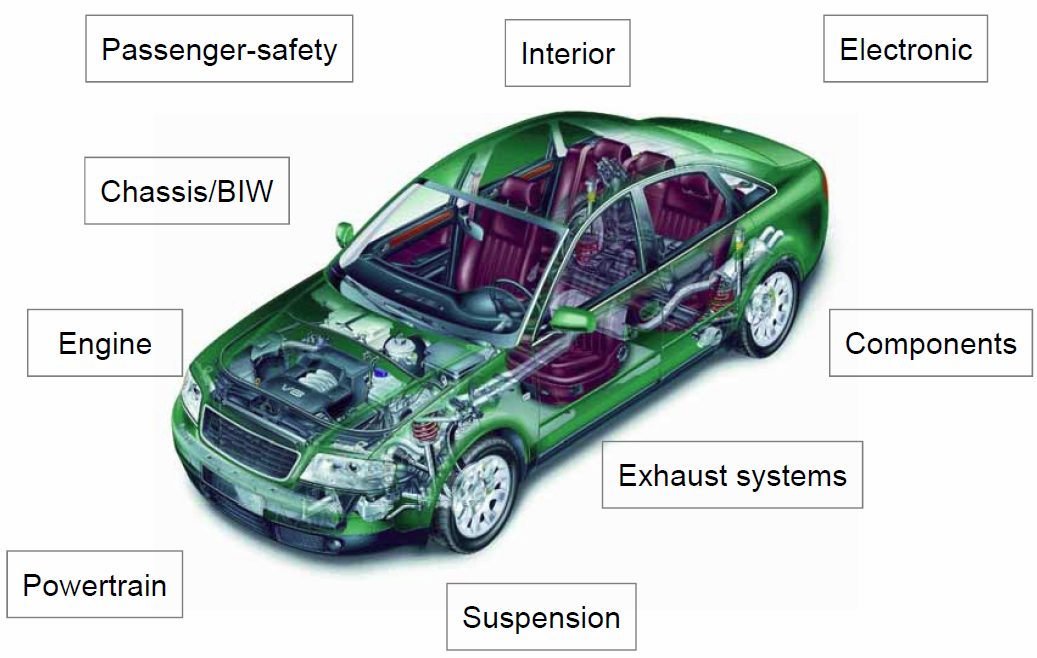
Figure 1: Common automotive applications using laser welding.T-9
AHSS grades can be laser butt-welded and are used in production of tailored products (tailor-welded blanks and tubes). The requirements for edge preparation of AHSS are similar to mild steels. In both cases, a good quality edge and a good fit-up are critical to achieve good-quality welds. The blanking of AHSS needs higher shear loads than mild steel sheets. (see Culling in Blanking, Shearing and Trim Operations)
If a tailored product is intended for use in a forming operation, a general stretchability test such as the Erichsen (Olsen) cup test can be used for assessment of the formability of the laser weld. AHSS with tensile strengths up to 800 MPa show good Erichsen test values (Figure 2). The percent stretchability in the Erichsen test = 100 × the ratio of stretchability of weld to stretchability of BM.
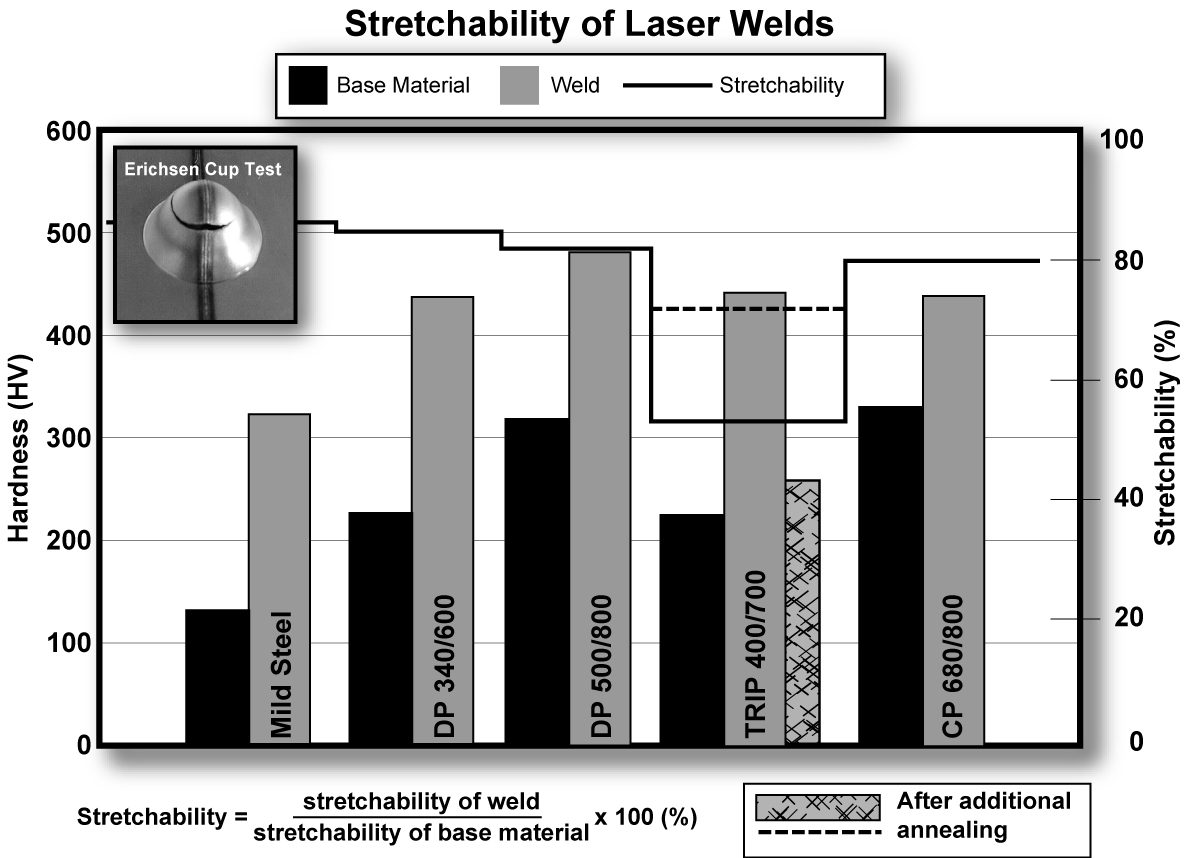
Figure 2: Hardness and stretchability of laser butt welds with two AHSS sheets of the same thickness (Erichsen test values describe the stretchability.B-1)
The hardness of the laser welds for AHSS is higher than for mild steels (Figure 3). However, good stretchability ratios in the Erichsen test can be achieved when the difference in hardness between weld metal and BM is only slightly higher for AHSS compared to mild steels. If the hardness of the weld is too high, a post-annealing treatment (using HF-equipment or a second laser scan) may be used to reduce the hardness and improve the stretchability of the weld.
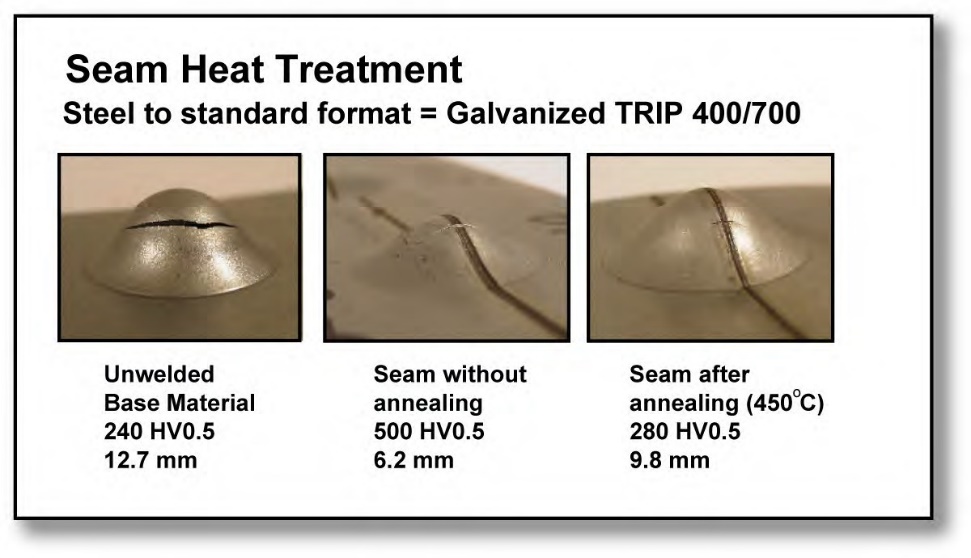
Figure 3: Improved stretchability of AHSS laser welds with an induction heating post-Heat treatment (Testing performed with Erichsen cup test.T-3)
Laser butt-welded AHSS of very high strength (for example Martensite steels) have higher strength than GMAW [LINK TO 3.2.1] welded joints. The reason is that the high CR in the laser welding process prompts the formation of hard martensite and the lower heat input reduces the soft zone of the HAZ.
Laser butt-welding is also used for welding tubes in roll-forming production lines as an alternative method for HF induction welding.
Assembly Laser Welding
Automotive applications use a variety of welding joint designs for laser welding in both lap joint and seam butt joint configurations as shown in Figure 4. Lap joints and seam butt joint configurations use different characteristics. Seam welds on butt joints need less power from the machine than lap joints due to the smaller weld fusion area, producing less distortion and a smaller HAZ. Butt joint configurations are more cost efficient. However, the fit up for seam welds can be more difficult to obtain than those of lap joints. Also, lap joints tend to provide a larger process window.
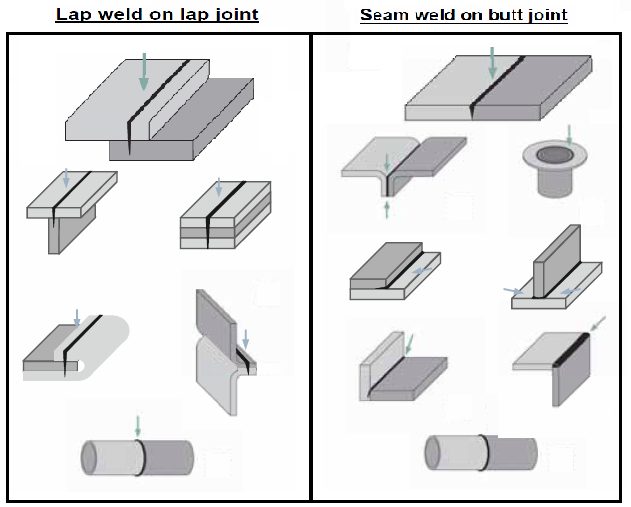
Figure 4: Common seam and joint types for laser welding of automotive applications.T-9
When seam welding butt joint configurations, a general guideline for fit-up requirements include a gap of 3-10% the thickness of the thinnest sheet being welding and an offset of 5-12% thickness of the thinnest sheet. A guideline for lap joints can require a gap of 5-10% the thickness of the top sheet being welded (Figure 5). These general guidelines are not absolute values due to the change of variables such as the focus spot size, the edge geometry for butt welds, strength requirements, etc.
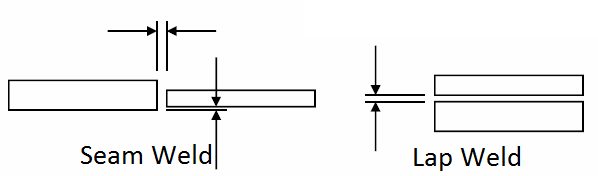
Figure 5: Fit-up requirements for butt joint and lap joint configurations in laser welding.T-9
Laser welding is often used for AHSS overlap joints. This type of weld is either a conventional weld with approximately 50% penetration in the bottom sheet or an edge weld. Welding is performed in the same way as for mild steels, but the clamping forces needed for a good joint fit-up are often higher with AHSS than for mild steels. To achieve good laser-welded overlap joints for Zn-coated AHSS, a small intermittent gap (0.1-0.2 mm) between the sheets is recommended, which is identical to Zn-coated mild steels. In this way, the Zn does not get trapped in the melt, avoiding pores and other imperfections. An excessive gap can create an undesirable underfill on the topside of the weld. Some solutions for lap joint laser welding Zn- coated material are shown in Figure 6.
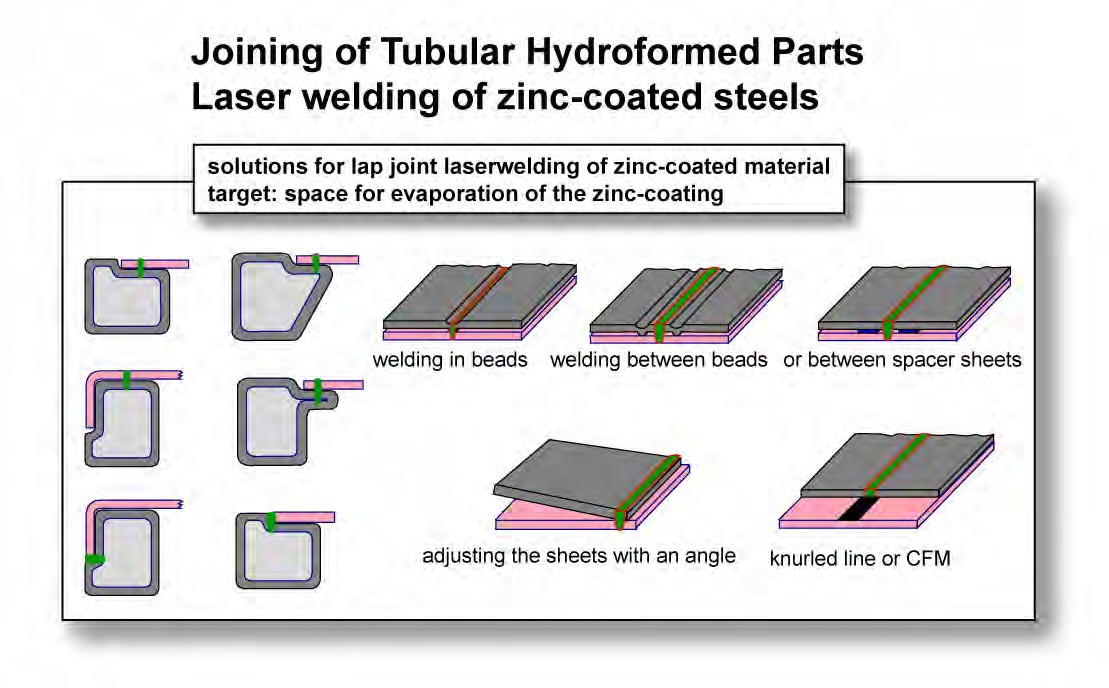
Figure 6: Laser welding of Zn-coated steels to tubular hydroformed parts.L-3
StudiesL-59 have shown welding Zn-coated steels can be done without using a gap between the overlapped sheets. This is accomplished using dual laser beams. While the first beam is used to heat and evaporate the Zn coating, the second beam performs the welding. The dual laser beam configuration combines two laser-focusing heads using custom-designed fixtures.
Remote Laser Welding
Remote scanner welding is used for many automotive applications, including seating (recliners, frames, tracks, and panels), BIW (trunks, rear panels, doors I hang on parts, side walls, and pillars) and interior (IP beams, rear shelfIhat rack) (Figure 7). Compared to conventional laser welding, remote scanner welding has several advantages. Those include a reduced cycle time (via reduction of index time), programmable weld shapes (ability to customize weld shape to optimize component strength), large stand-off (longer protection glass life), and reduced number of clamping fixtures (via reduced number of stations).
Remote laser welding, or “welding on the fly”, combines a robot and scanner optics to position the focused laser beam on the workpiece on the fly. The robot arm guides the scanner optics along a smooth path about half a meter over the workpiece. Extremely nimble scanning mirrors direct the focal point in fractions of a second from weld seam to weld seam. A fiber-delivered, solid-state laser is the source of the joining power far away from the processing station. The scanning optic or Programmable Focusing Optic (PFO) at the end of the laser’s fiber-optic cable is the central element for precise positioning of the laser’s focus point on the component to be welded. Inside the PFO, two scanner mirrors direct the beam through a “flat field” optic, which focuses the beam onto a common focus plane no matter where it is in the work envelope of the PFO. The PFO is also equipped with a motorized lens that allows the focus plane to be moved up and down in the Z-axis. The repositioning of the focused laser beam from one end of the entire work envelope to the other takes about 30 ms.T-9
Figure 7: Remote laser welding of automotive applications.T-9
There are three basic preconditions for welding on the fly. First, a solid-state laser is needed as the beam source. Solid-state lasers enable delivery of the laser beam through a highly flexible fiber optic cable, which is required when joining components in 3D space with a multi-axis robot. Second, a laser with excellent beam quality and the appropriate power is required. Beam quality is the measure of focus-ability of a laser, and the long focal lengths required for remote welding necessitate superior beam quality (i.e., 4 to 8 mm-mrad) to achieve the appropriate focused spot size (i.e., about 0.6 mm) at the workpiece. For remote welding in automotive body production, typically about 4 to 6 kW of laser power is used. The third essential precondition is precise positioning of the weld seams, which requires axis synchronization between the robot and the scanner control. This allows the weld shape programmed in the scanner control for a specific shape weld to have proper shape with the robot moving at various speeds over the part to be welded. Some control architectures use “time” synchronization. The problem here is that if the robot speed is changed for any reason, the weld shape will also change because the axes are not synchronized.T-9
Body-in-White (BIW) Joining
Laser-based solutions can offer a high- and cost-effective improvement potential for steel-based BIW joining. The laser joining design’s stiffness increases in direct relation to the laser weld length. Also, at low process time, there is up to a +14% torsional stiffness increase without any additional joining technique, shown in Table 1.
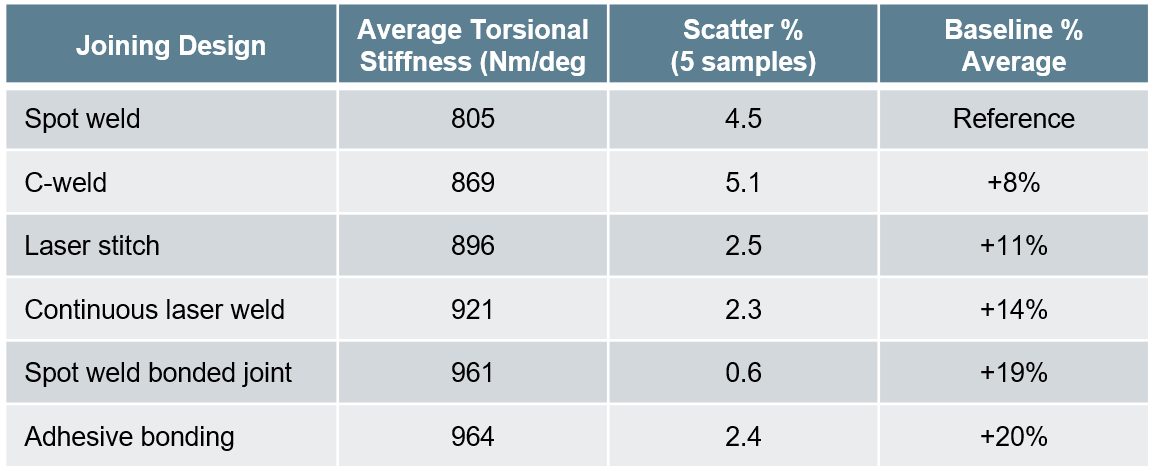
Table 1: Stiffness performances comparison for several joining designs.A-16
Laser weld shape optimization can help to homogenize performances and increasing the laser weld shape factor leads to a signification reduction of IF fracture risk (Figure 8).
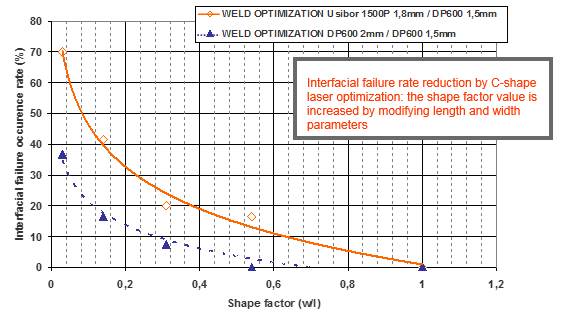
Figure 8: Impact of laser weld design optimization on fracture type.A-16
DP 800 (with additional retained austenite and associated bainite) has the advantage of weight reduction and equally good properties when laser welding as the DP 800. The absolute strength of DP 800 is slightly higher, but the ductility for the DP 800 is greater, shown in Figure 9.
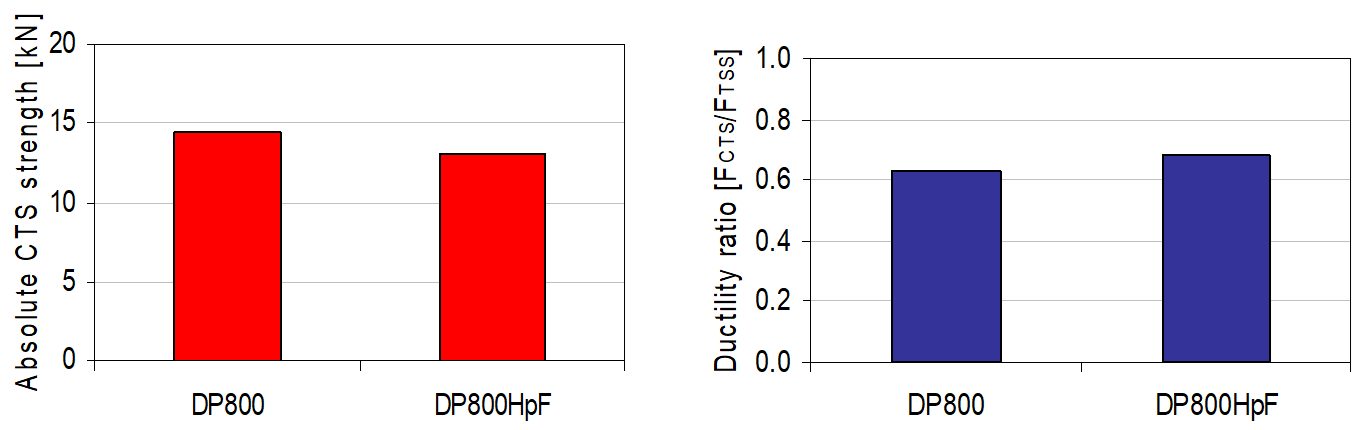
Figure 9: Absolute strength and ductility of DP 800 and DP 800.T-10
Figure 10 shows a cross-tension test in which both materials fail outside the weld zone, DP 800 failing entirely in the HAZ and DP 800 failing partly in the HAZ and partly in the BM.
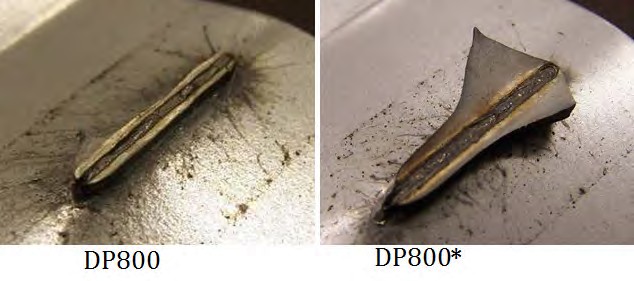
Figure 10: Cross-tension testing of DP 800 and DP 800.T-10
Figure 11 is the microhardness profile of 1.6-mm Q&P 980’s laser weld joint. Microhardness of both welded seam and HAZ are all higher than BM, and there is no obvious softened zone in HAZ.
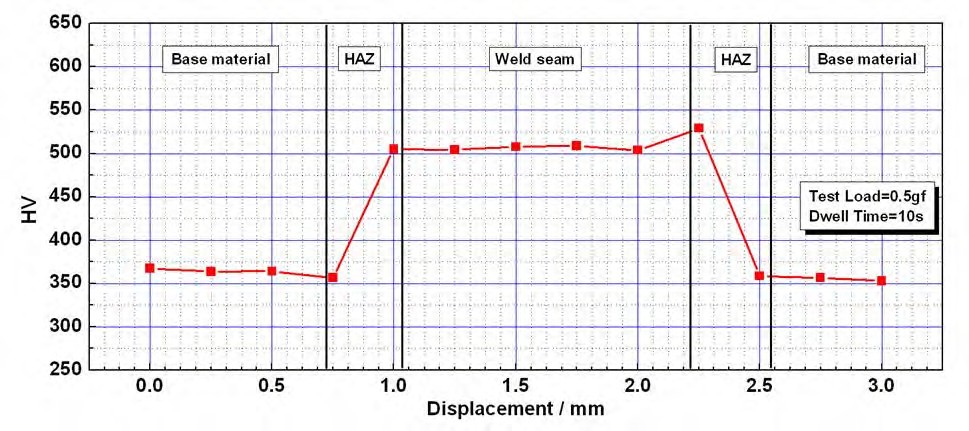
Figure 11: Microhardness profile of 1.6-mm Q&P 980’s laser weld joint.B-4
Figure 12 is Erichsen test result for the BM and weld seam of 1.6-mm Q&P 980, showing good stretchability.
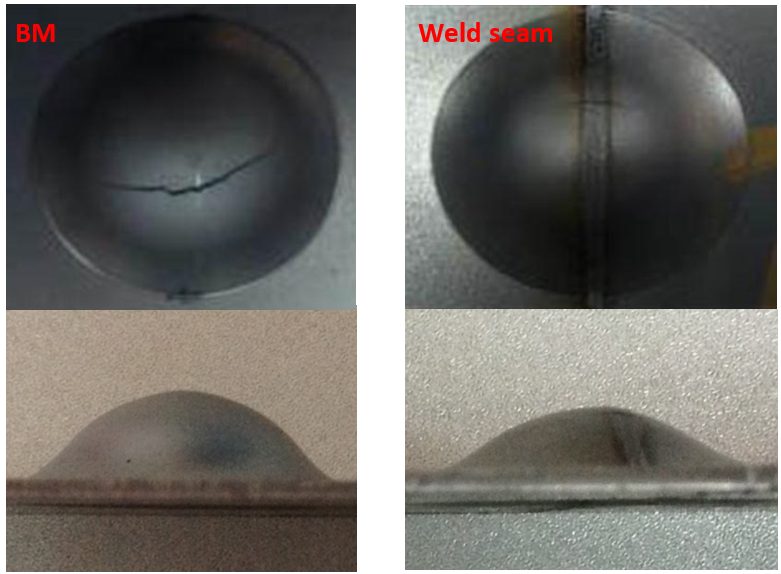
Figure 12: Erichsen test result of 1.6-mm Q&P 980, laser welded.B-4
Hybrid Laser and GMAW Welding
In hybrid welding process parameters such as stick out and torch angle are very important to decide overall joint performance. A model has been developed to predict the penetration and toe length under similar heat input conditions, shown in Figure 13. The gap, stickout and angle shows synergic agreement with penetration and toe length but the interactions among them can show disagreement.
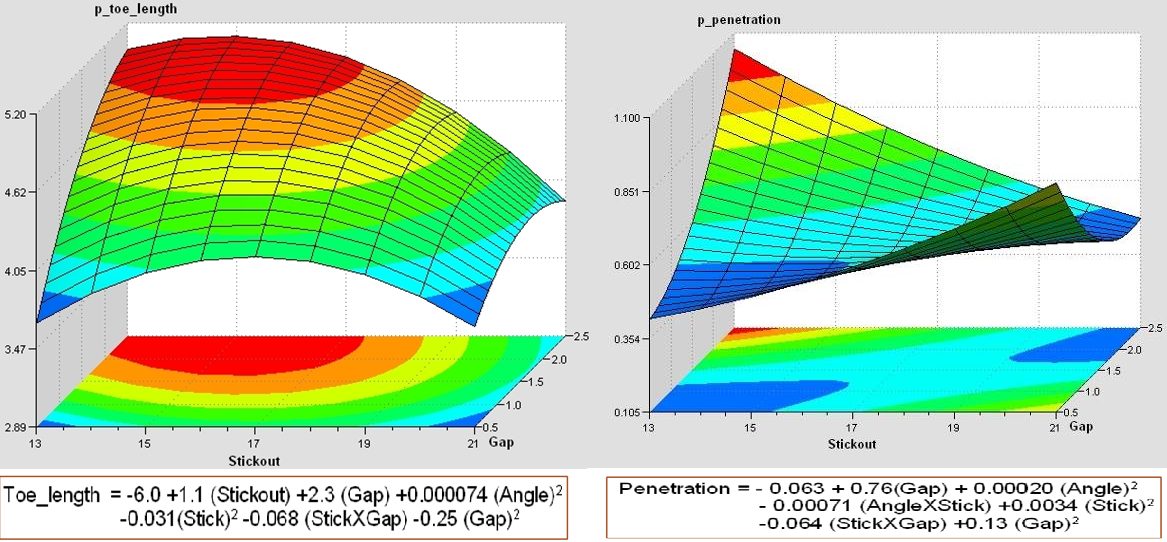
Figure 13: Effects of toe length and penetration.T-10
The weld joint strength increases with the increase in wire feed rate for a given laser power shown in Figure 14.
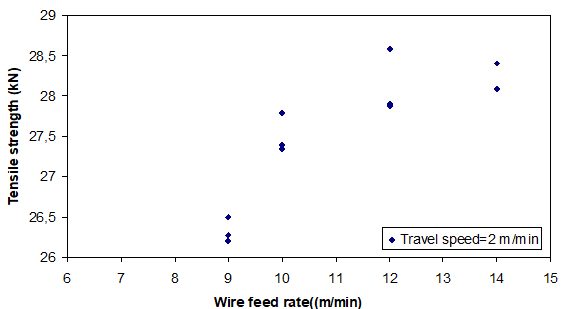
Figure 14: Wire feed rate versus tensile strength of hybrid laser and MIG welds.T-10
Back To Top


