HS Boron Methodologies
This paper summarizes a paper, entitled “Resistance Welding Projection Methodologies as Applied to Hot-Stamped Boron”, by D. Crist, et al.C-11
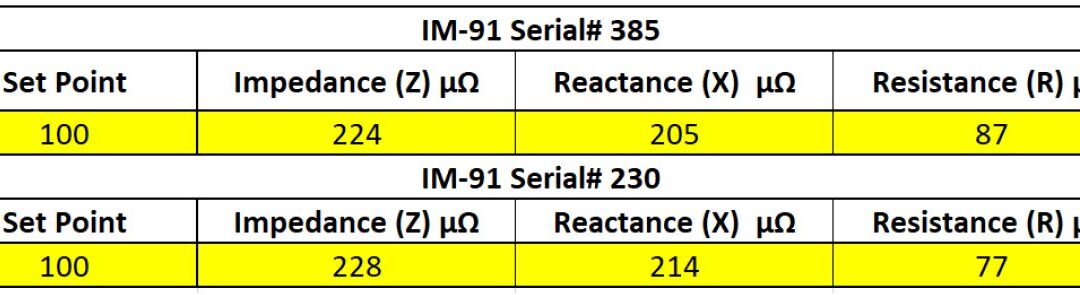
The study focuses on two different Resistance Projection Welding approaches and compares the welding parameters, mechanical properties and destructive results. Table 1 lists the secondary impedance measurements and Table 2 lists the material information for the PHS-CR1500T-MB-AS.
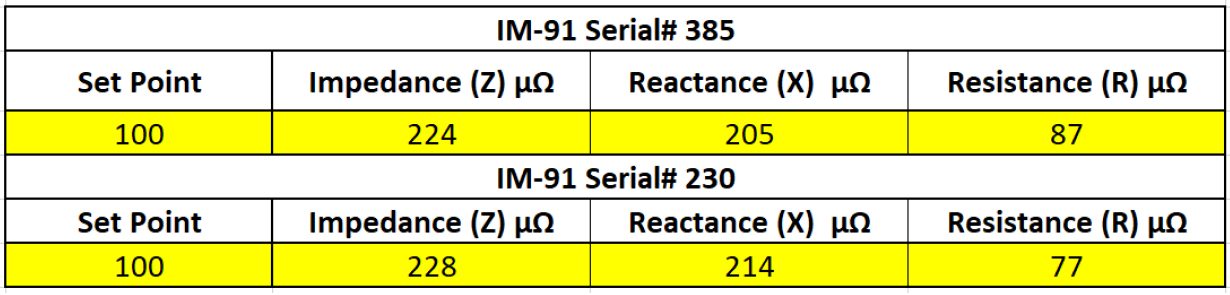
Table 1: Secondary Impedance Measurements.C-11
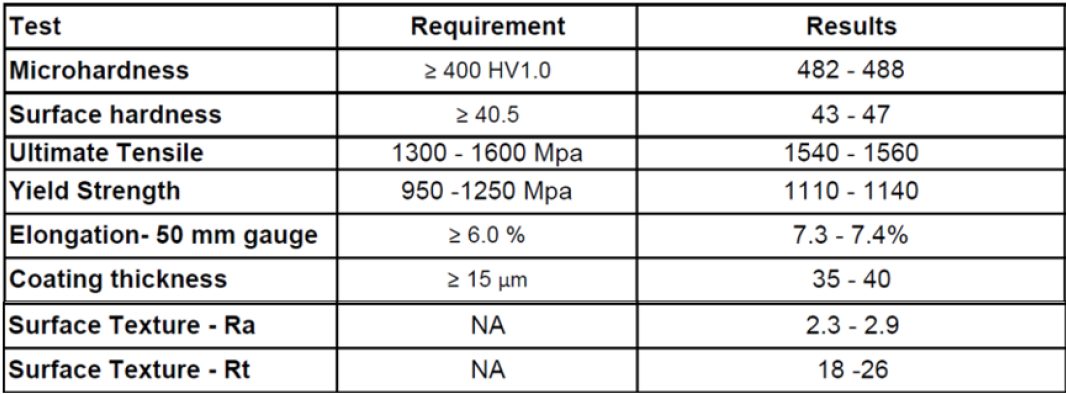
Table 2: Coupon Material Information.C-11
The thickness of the material chosen was 1.80 mm and the weld coupon dimensions are shown in Figure 1.
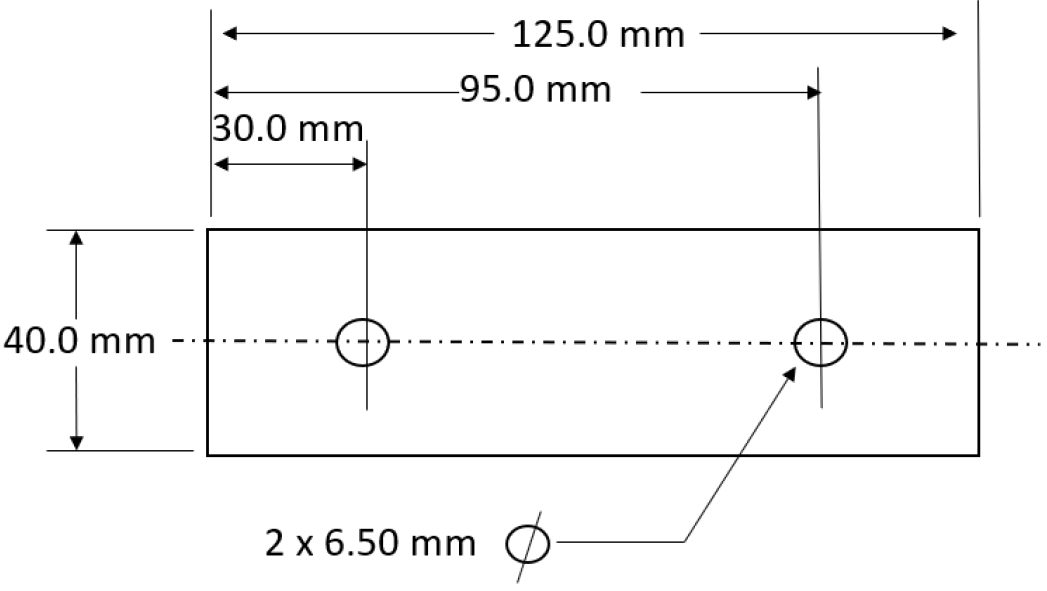
Figure 1: Weld Coupon Dimensions (not to scale).C-11
The projection weld nut used for testing is an M6 hex flange, three projections, non-piloted weld fastener. Detailed dimensions are shown in Figure 2.
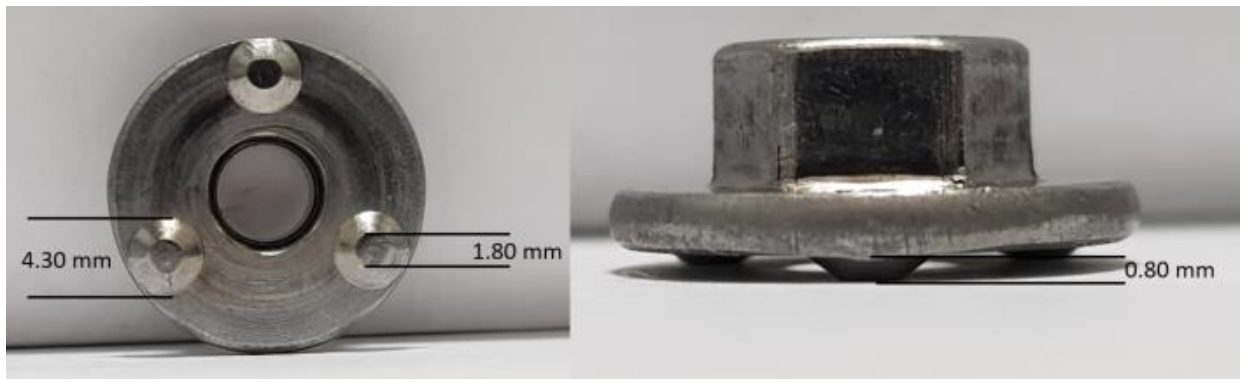
Figure 2: Projection Weld Nut.C-11
Table 3 lists the weld schedule methodologies tested in this study. Table 4 shows the optimized weld schedules based upon push-off strength and visual weld flash level.
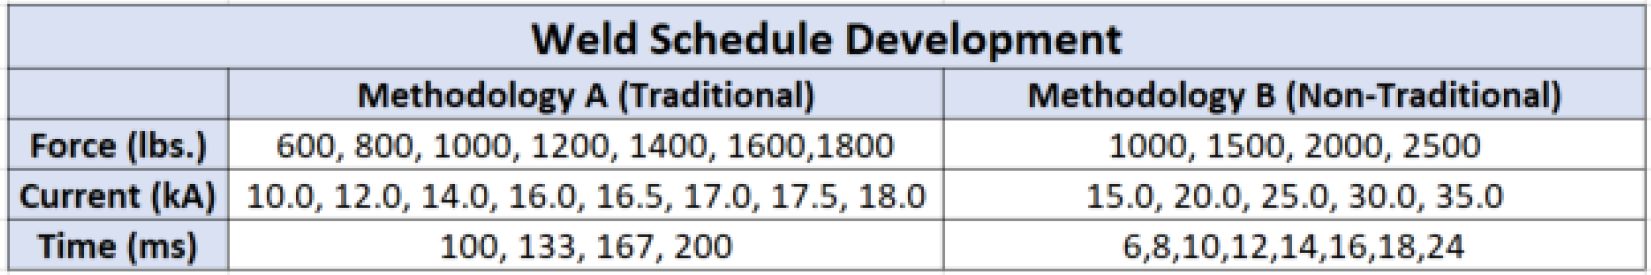
Table 3: Weld Schedule Development.C-11
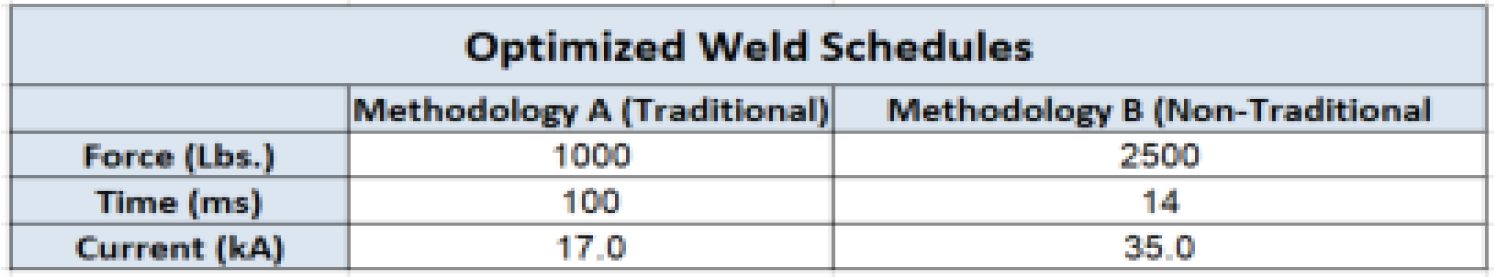
Table 4: Optimized Weld Schedules.C-11
Repeatability testing for both Methods A and B are shown in Figures 3 and 4. The data produced for Method B shows a higher average of repeatability.
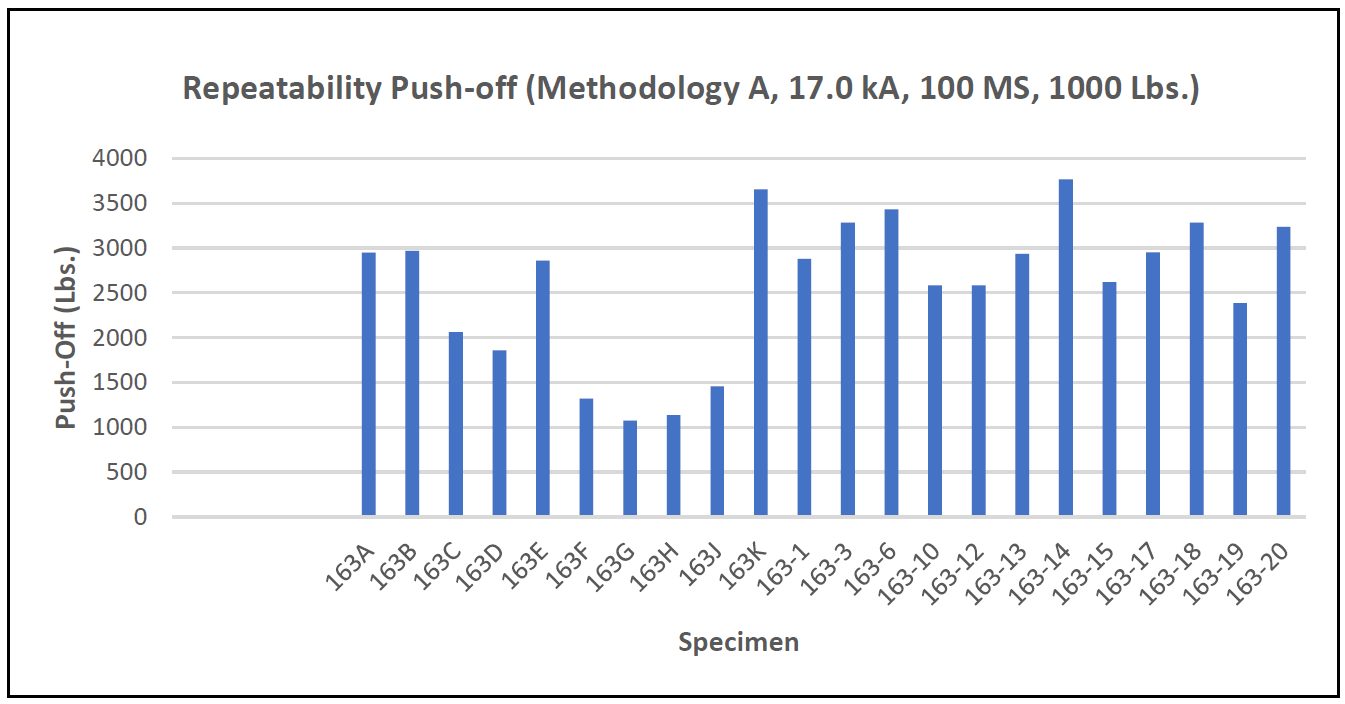
Figure 3: Repeatability Push-Off Method A.C-11
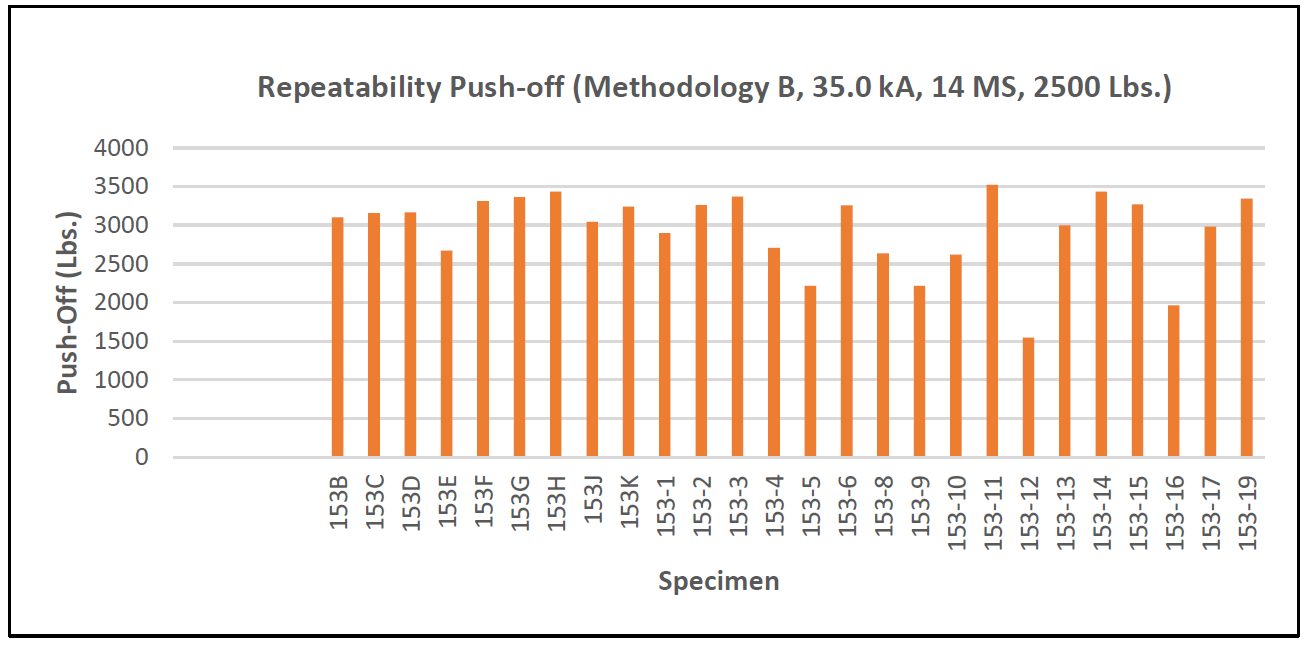
Figure 4: Repeatability Push-Off Method B.C-11
Two different failure methods were observed. Figure 5 shows full thickness buttons were pulled thought the flange for Method A and Figure 6 demonstrates partial thickness failure for Method B.
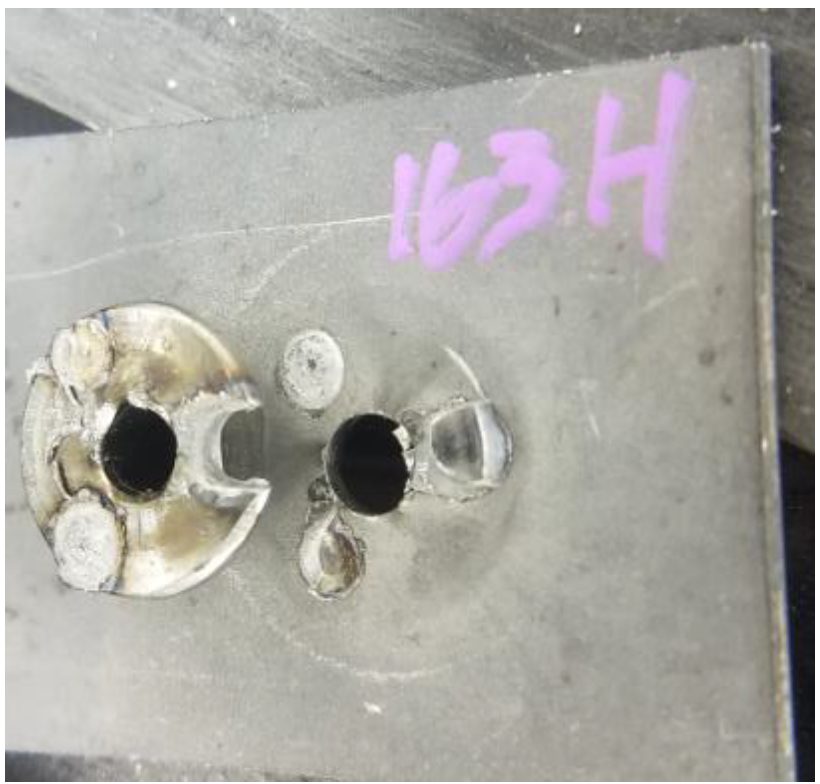
Figure 5: Method A (17.0 kA, 100 ms, 1000 lb.) Common Failure Mode.C-11
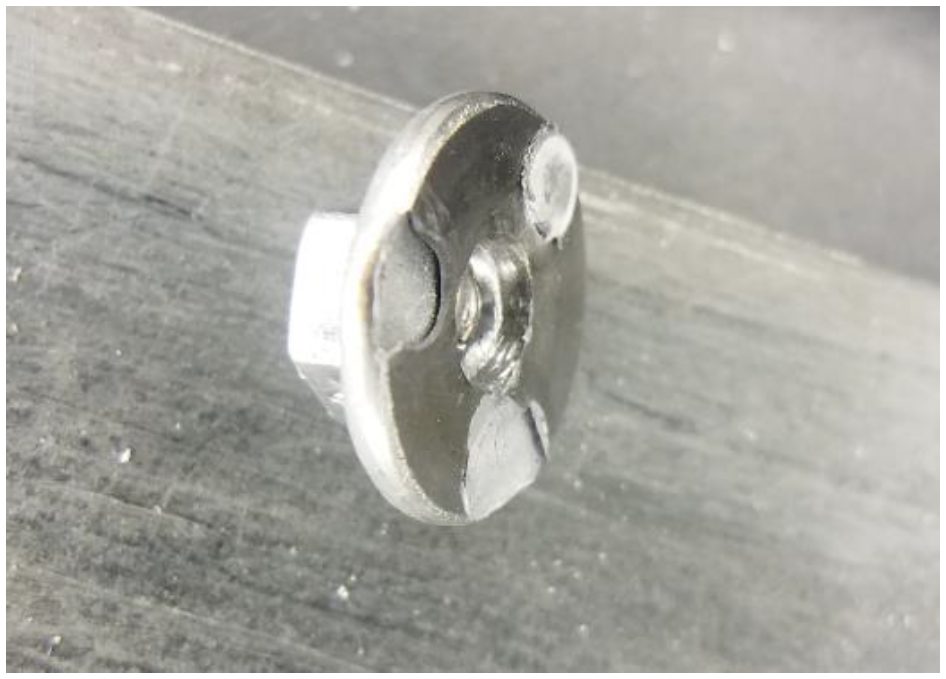
Figure 6: Method B (35.0 kA, 14 ms, 2500 lb.) Common Failure Mode.C-11
Figure 7 shows the microhardness traverse results for both Methods A and B. Method A yields a much larger HAZ. Method B shows a much smaller HAZ, less impact on the base material, and appears to be a solid state bond.
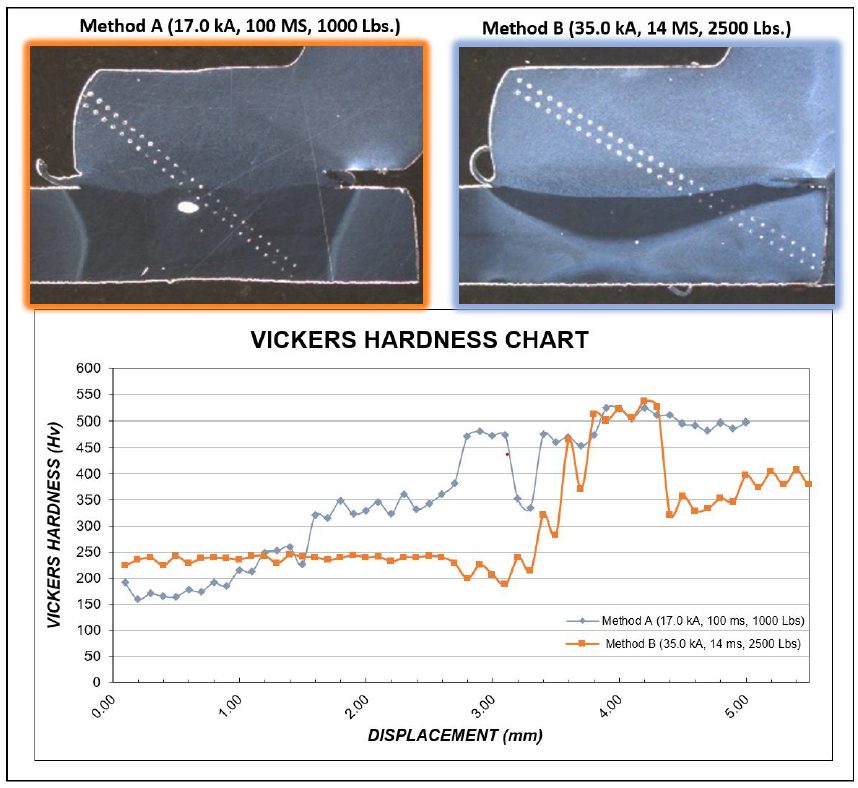
Figure 7: Microhardness Traverse.C-11