Analyze Hydrogen Induced Cracking Susceptibility in Resistance Spot Welds
This articles summarizes a paper entitled, “New Test to Analyze Hydrogen Induced Cracking Susceptibility in Resistance Spot Welds,” by M. Duffey.D-10
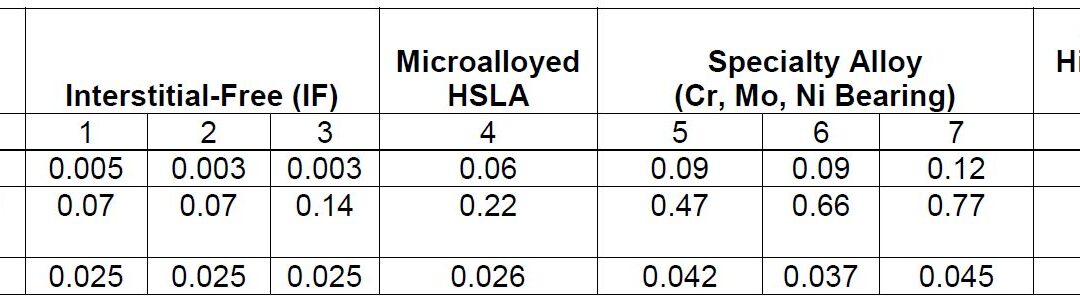
This study aims to develop a new weldability test to analyze the susceptibility of HIC in RSW of different steels. A total of eight different steel samples were analyzed with their carbon content, associated American Welding Society (AWS) carbon equivalencies, and gauges shown in Table 1. All materials were tested in the full-hard condition (all have been cold-rolled).
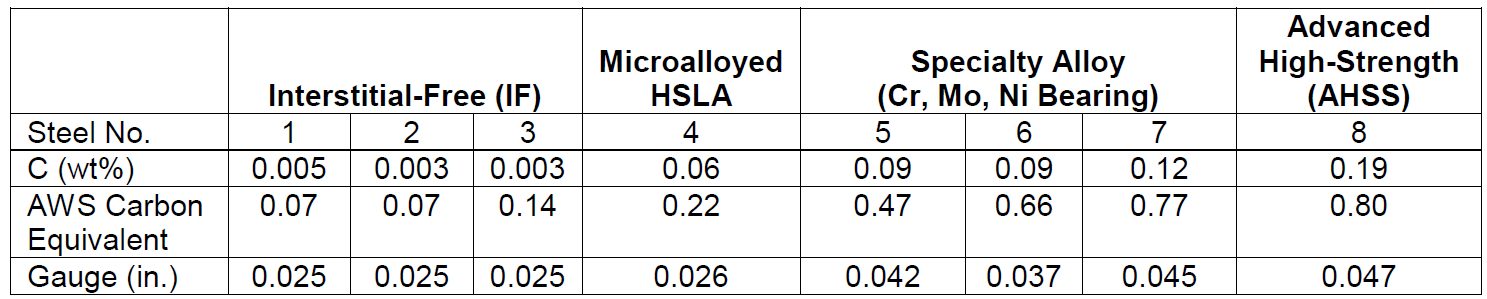
Table 1: Tested Steels, Carbon Equivalencies, and Steel Gauge.D-10
The associated parameter ranges for welds made with each steel are in Table 2. The resistance spot weld was made in the middle of the sheets, as shown in the test setup in Figure 1. There was a total of 18 test samples (nine not painted and wiped, nine painted) for each material tested.
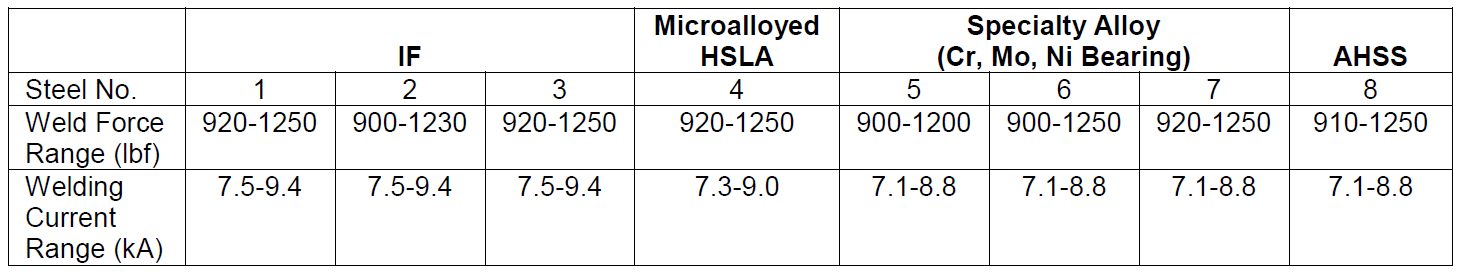
Table 2: Welding Parameters.D-10
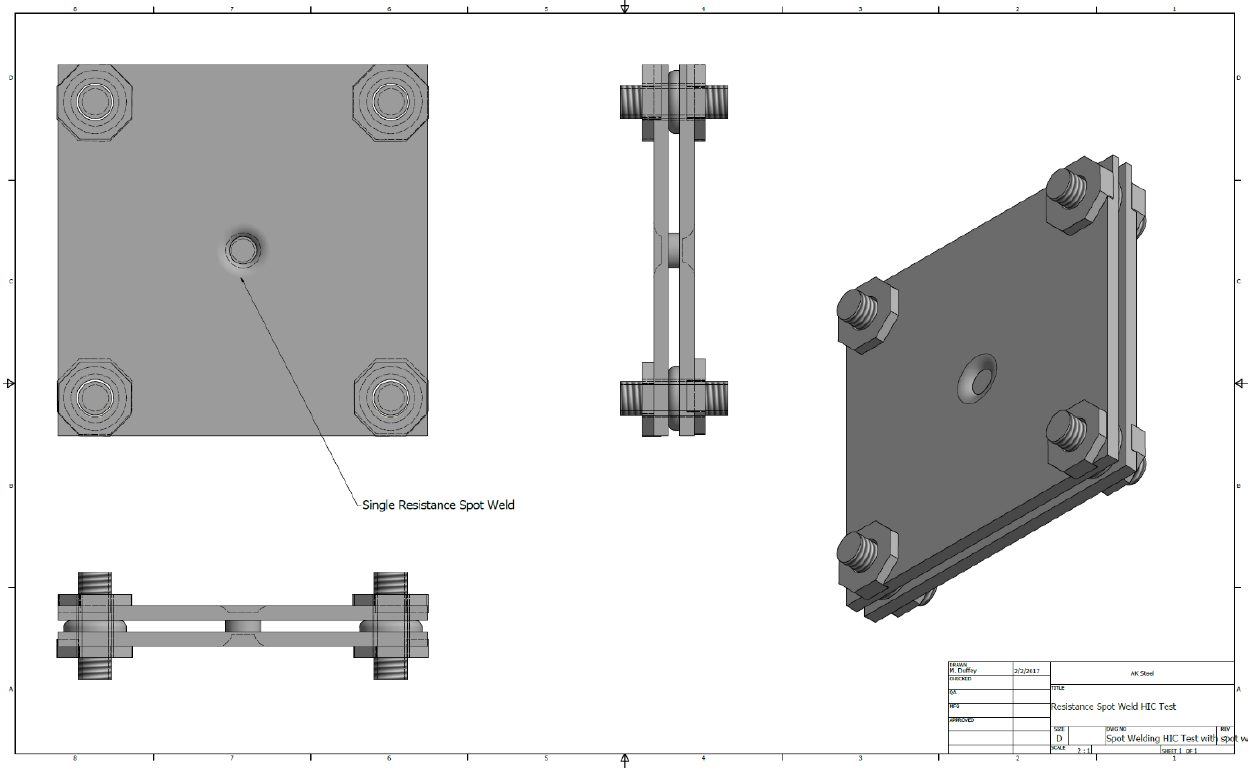
Figure 1: HIC Test for Resistance Spot Welds Schematic.D-10
Figure 2A shows the results of the 3- × 3-in. tests. Figure 2B shows the results of the 4- × 4-in. tests. Figure 2C shows the results of the 5- × 5-in. tests.
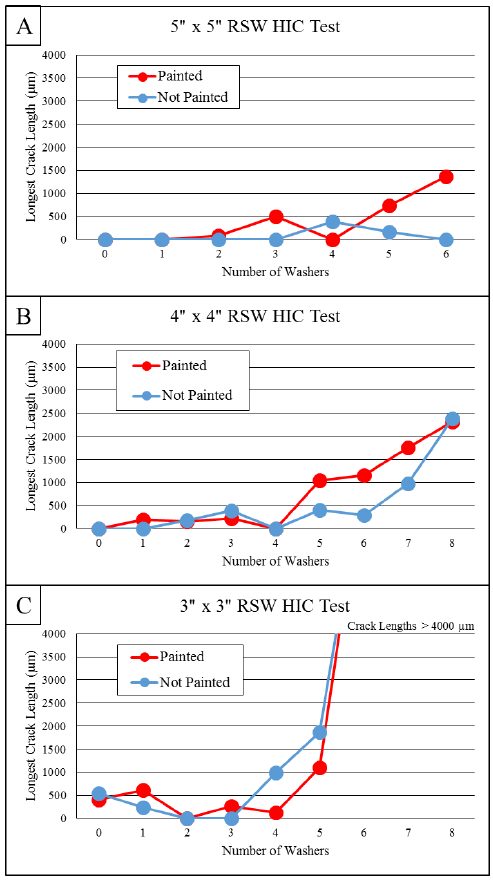
Figure 2: Results of the Three Different Test Sizes on AHSS.D-10
Cracks consistently initiated at the periphery of the weld nugget where the two steel sheets came together. Cracks then propagated either in the weld metal or HAZ, as shown in Figures 3 and 4.
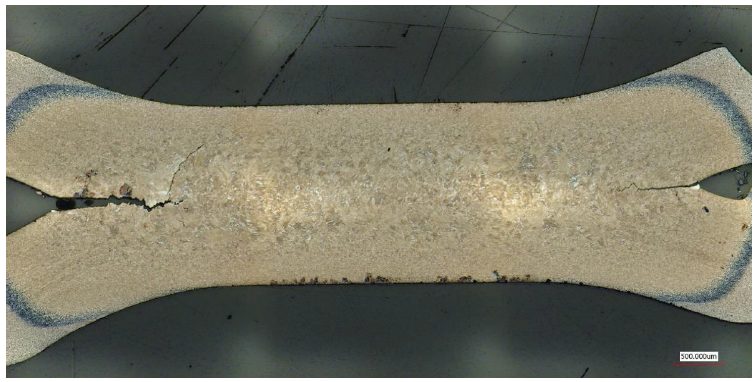
Figure 3: Cracking in the Weld Metal of Steel 8.D-10
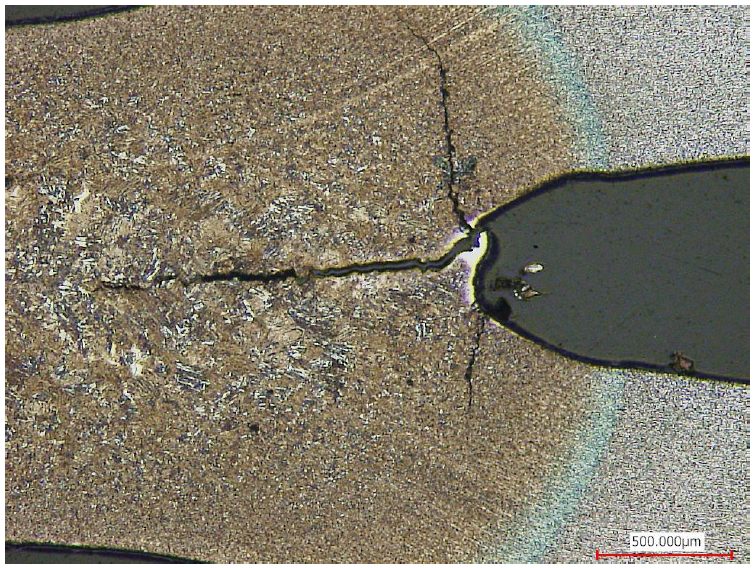
Figure 4: Cracking in Both the Weld Nugget and HAZ in Steel 8.D-10
Figure 5 displays the results from Steels 1, 4, and 5. Steel 1 is the most resistant (of the three) to HIC. For the three steels shown in Figure 5, the crack length (at each gap spacing) was longer for the painted sample than the non-painted sample.
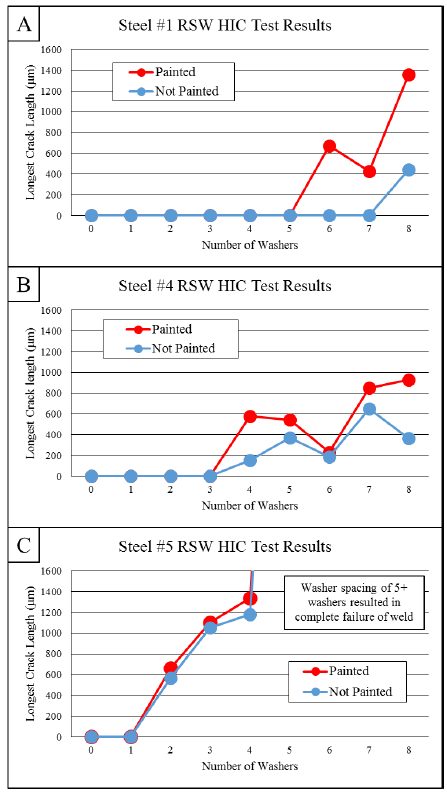
Figure 5. Test Results for Steels 1, 4, and 5.D-10
The microstructure of IF Steels 1-3 (Figure 6A) was ferrite. The microstructure of the high-strength low-alloy (HSLA) Steel 4 (Figure 6B) was a mixture of grain boundary ferrite, martensite, and possibly some bainite. The microstructure of the specialty alloy Steels 5-7 and AHSS Steel 8 (Figure 6C) was entirely martensite.
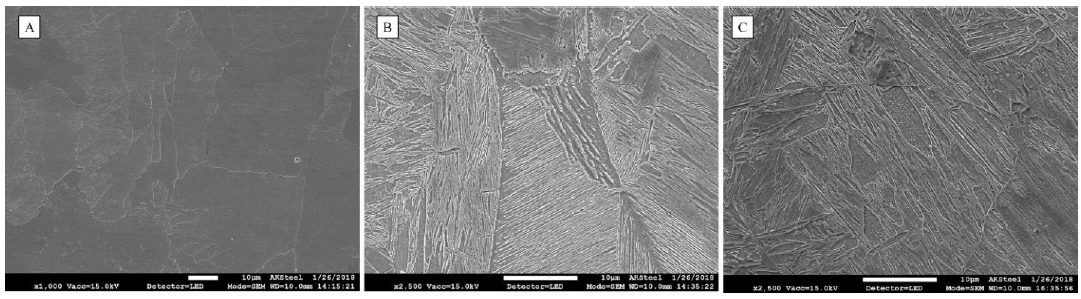
Figure 6: Microstructures of the Different Weld Nuggets.D-10
Figure 7 shows the fracture surface of a crack completely through Steel 7.
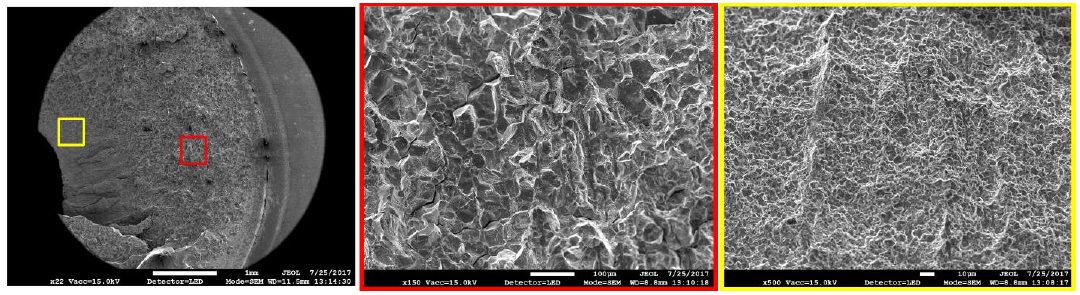
Figure 7: Fracture Surface of Cracked Weld in Steel 7.D-10
The average and maximum hardness results of spot welds in each material are summarized in Figure 8.
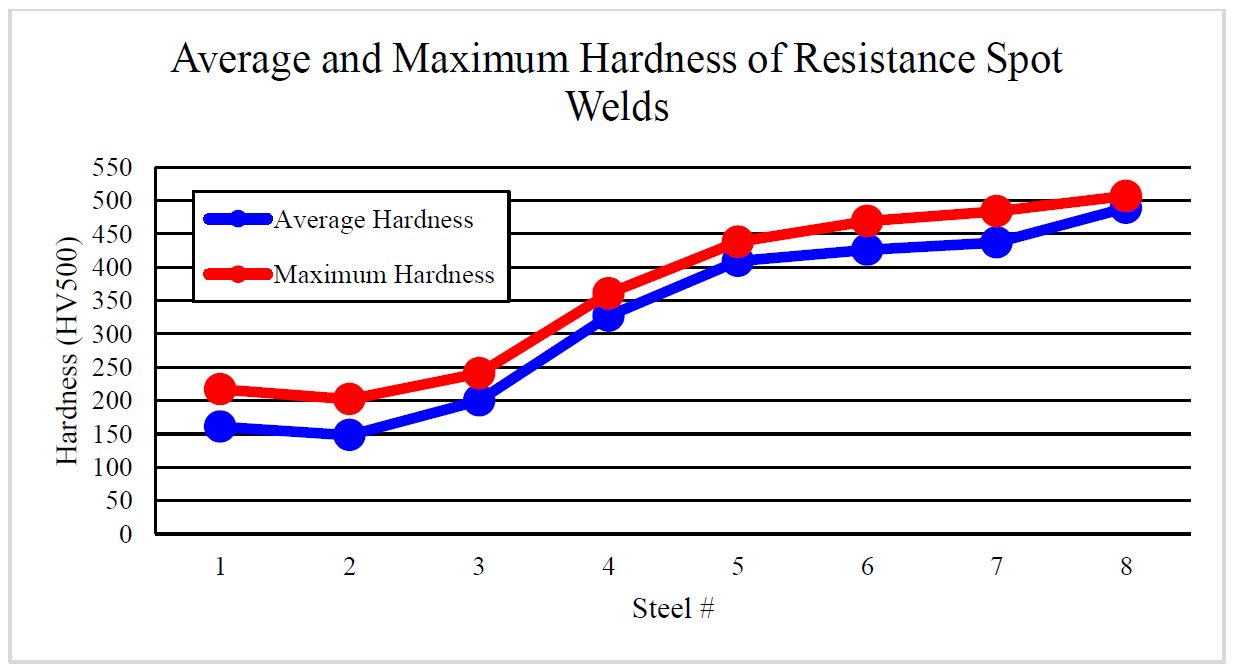
Figure 8. The Average and Maximum Hardness of HAZ and Weld Nugget in Resistance Spot Welds of Each Steel.D-10
Figure 9 is a graph that displays the carbon equivalence, number of washers where cracking first began, and average hardness of the weld nugget and HAZ in each steel.
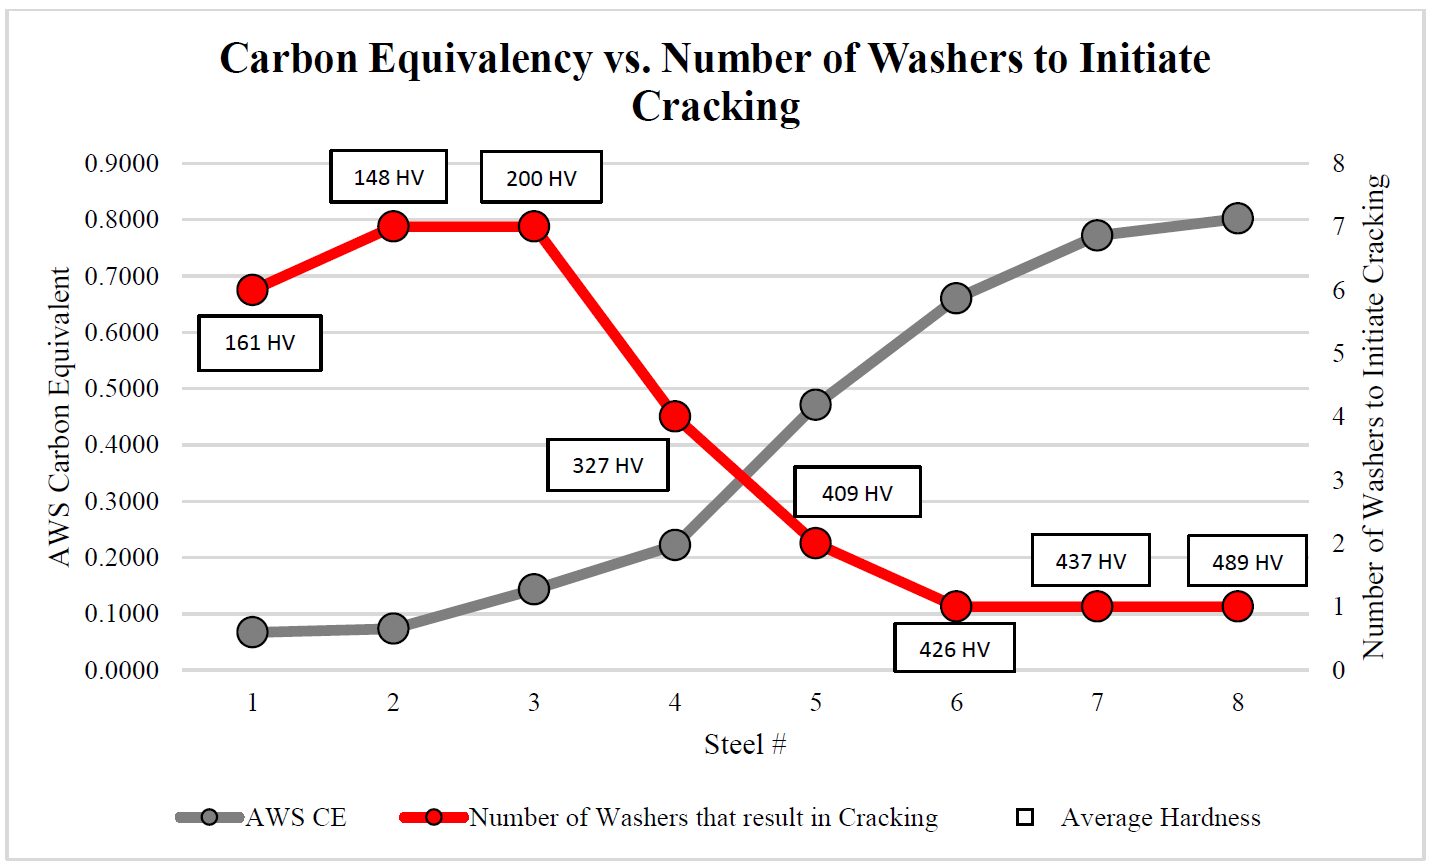
Figure 9: Carbon Equivalency vs. Number of Washers to Initiate Cracking.D-10