Spot Weld Strength Improvement by PWHT
This article summarizes a paper entitled, “High Strength Steel Spot Weld Strength Improvement through in situ Post Weld Heat Treatment (PWHT)”, by I. Diallo, et al.D-9
The study proposes optimal process parameters and process robustness for any new spot welding configuration. These parameters include minimum quenching time, post weld time, and post-welding current.
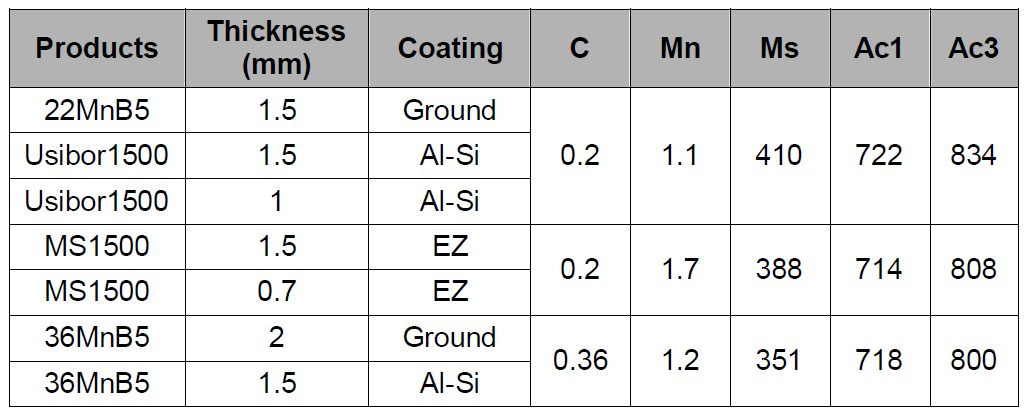
Three different chemical compositions are considered in this study and are listed in Table 1.
Table 1: Chemical composition and metallurgical data of products tested. Formulas used to calculate Ms, Ac1 and Ac3 are from “Andrews Empirical Formulae for the Calculation of Some Transformation Temperatures.”D-9
Welding configurations and process parameters are described in Table 2.
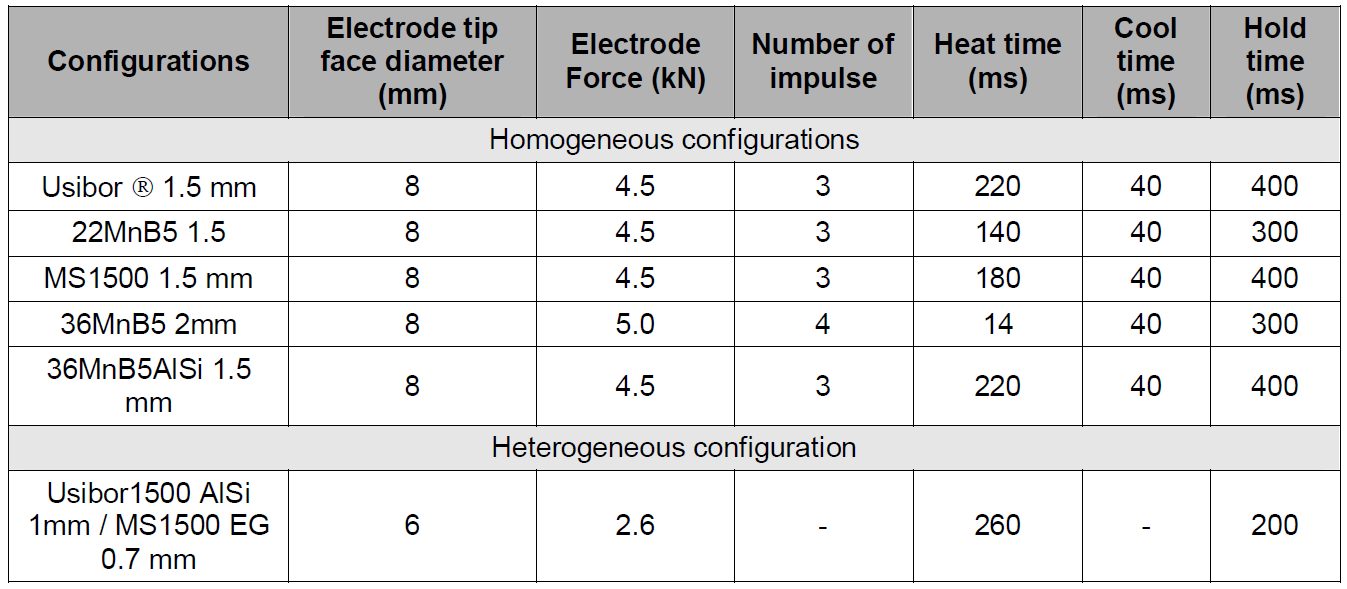
Table 2: Welded configurations and welding parameters used in reference cases.D-9
Cross Tensile Strength for MS1500EG 1.5 mm homogenous configuration is seen in Figure 1. Table 3 lists the reference data for the other configurations in this study.
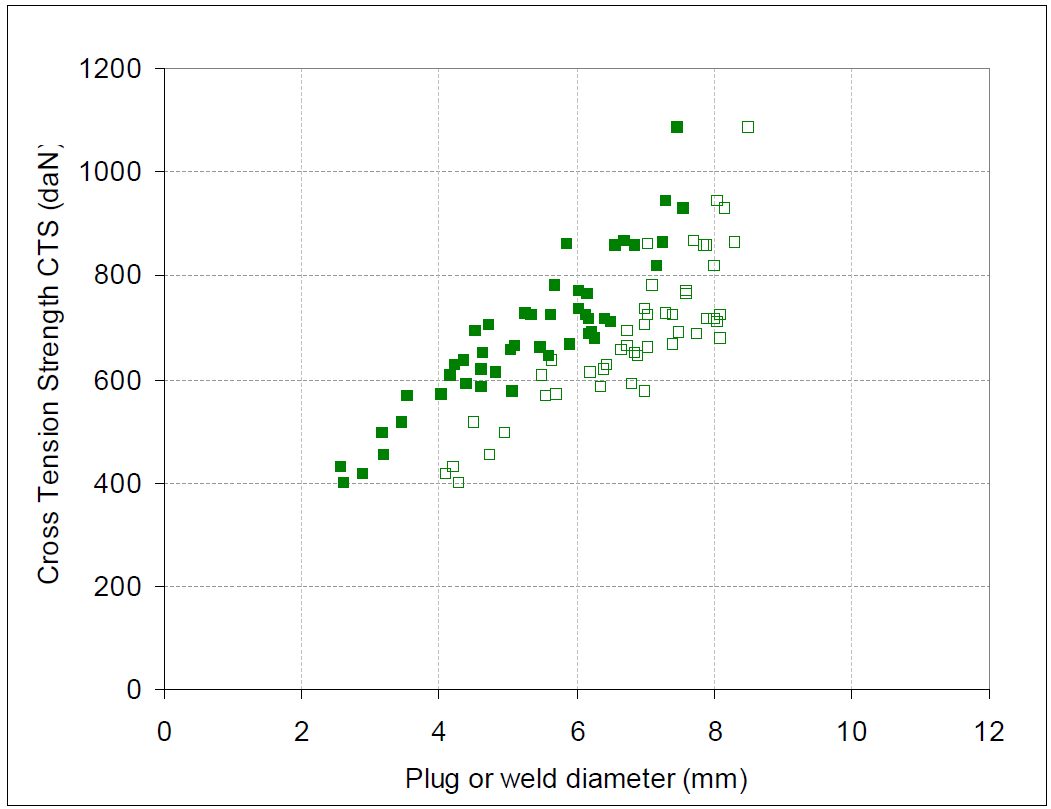
Figure 1: Cross Tensile Strength for MS1500EG 1.5 mm homogenous configuration as a function of plug (closed symbols) or weld (open symbols) diameter.D-9
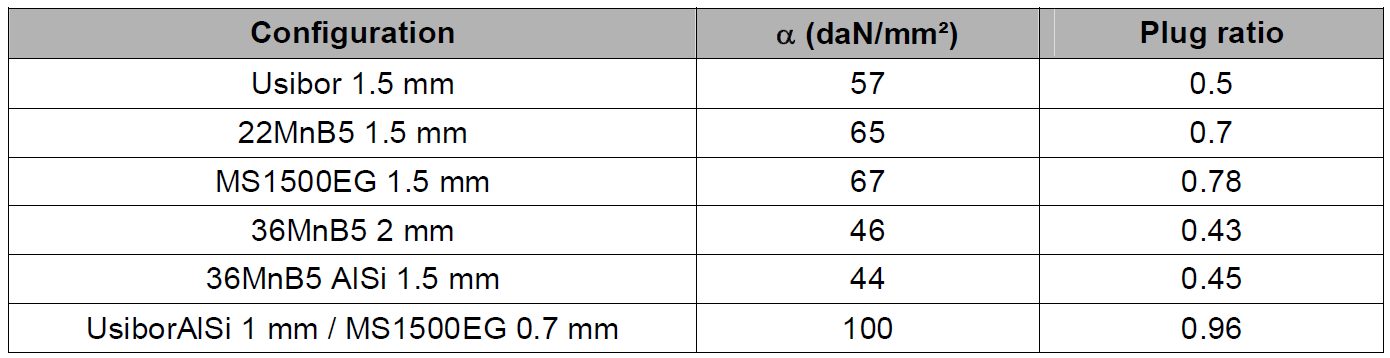
Table 3: Average α and plug ratio along the welding range for reference configurations.D-9
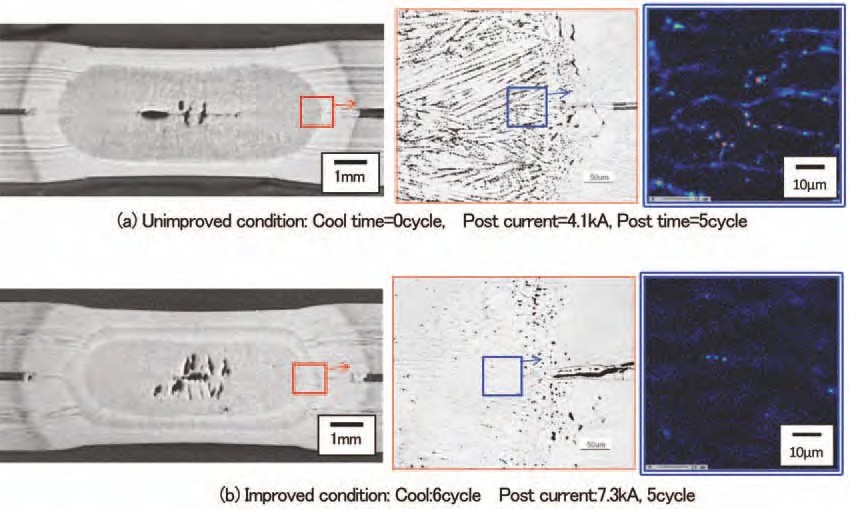
Figure 2 and 3 depict micrographs of welds after PWHT applied on 36MnB5 2 mm homogeneous configuration. These micrographs illustrate the evolution of the microstructure during PWHT and are labeled accordingly. Figure 4 shows the microhardness profiles in the welds described in Figure 3. It is clear that the Mf temperature was reached in the entire weld before application of PWHT.
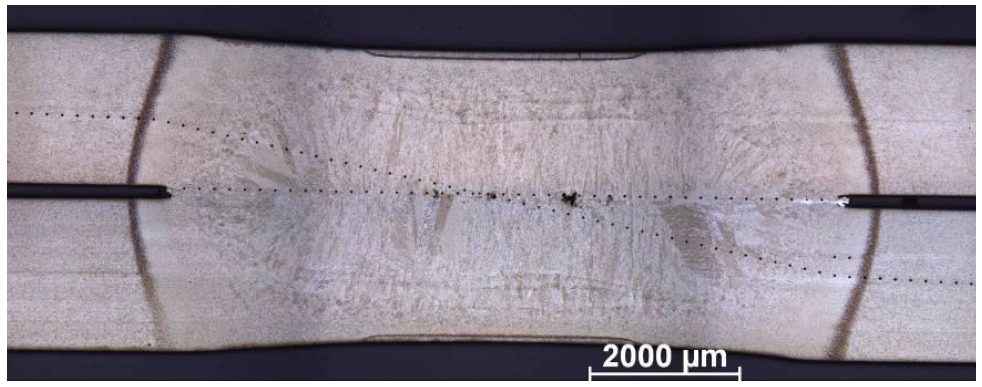
Figure 2: Micrograph of reference weld for 36MnB5 2mm homogeneous configuration.D-9
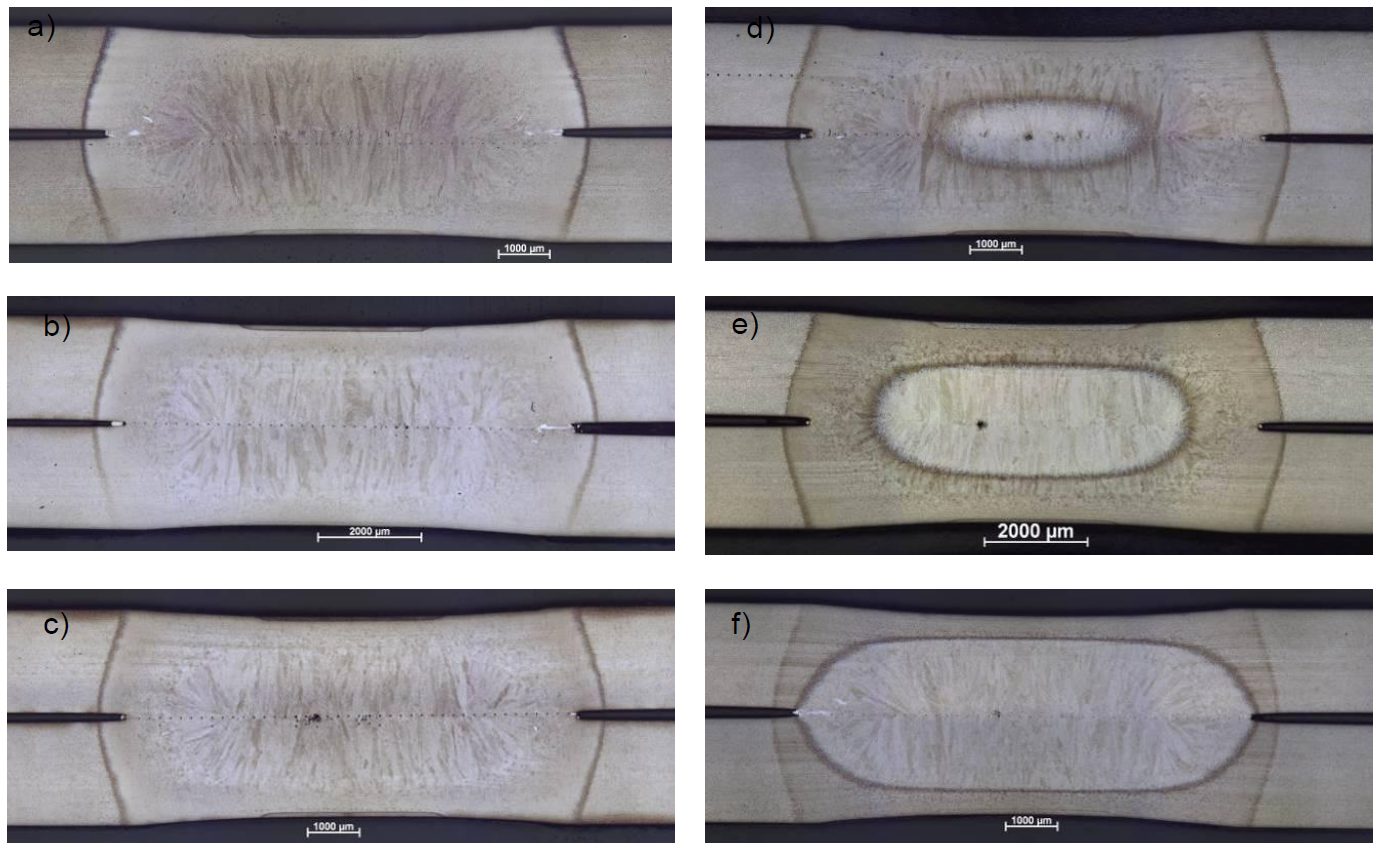
Figure 3: Micrographs of welds after post weld heat treatment applied on 36MnB5 2 mm homogeneous configuration with 70 periods of quenching and post welding current of a) 54%Iw, b) 62%Iw, c) 65% d) 67%Iw, e) 71%Iw and f ) 78%Iw.D-9
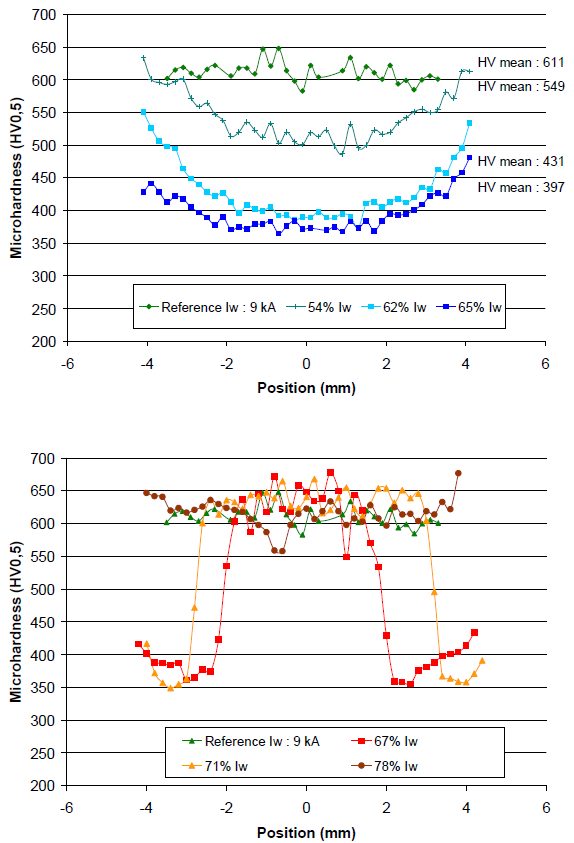
Figure 4: Microhardness profiles in welds after post weld treatment applied on 36MnB5 2mm homogeneous configuration with 70 periods of quenching ; these measurements correspond to micrographs shown in Figure 2 and Figure 3.D-9
Similar methodology was performed on partial quenching examples with AISI coating and electrogalvanized coating. Table 4 lists the minimum quenching times that were determined experimentally for each configuration.
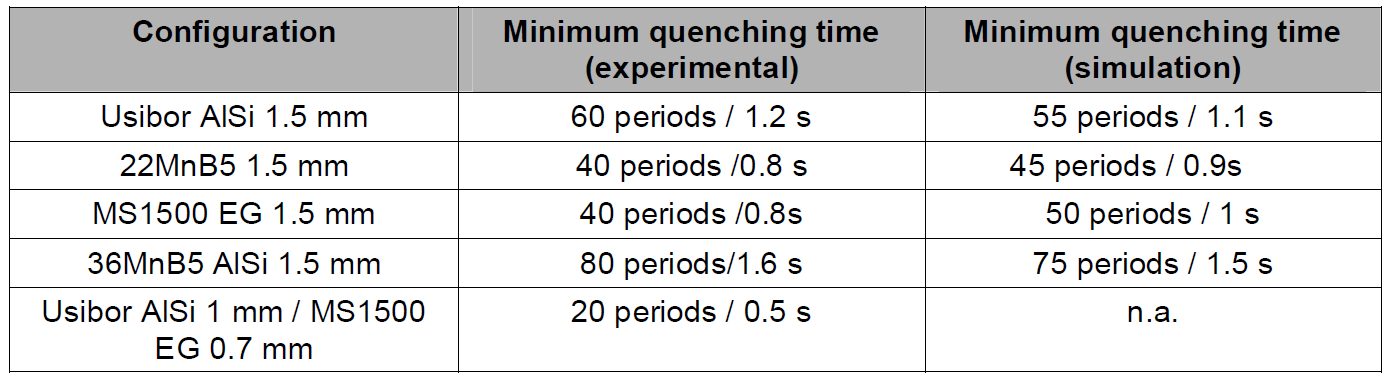
Table 4: Minimum quenching times determined experimentally and through Sorpas simulation.D-9
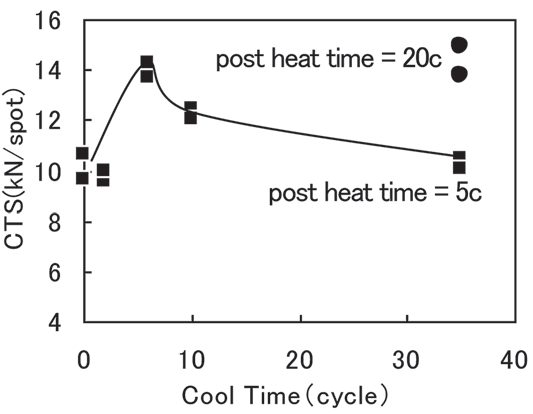
For selection of post weld time, a slightly different methodology was performed. Optimal quenching time was determined and used to construct the evolution of post weld current range as a function of post weld time as described in Figure 5. This figure shows that post welding current range is stable between 60 and 30 periods of post weld time.
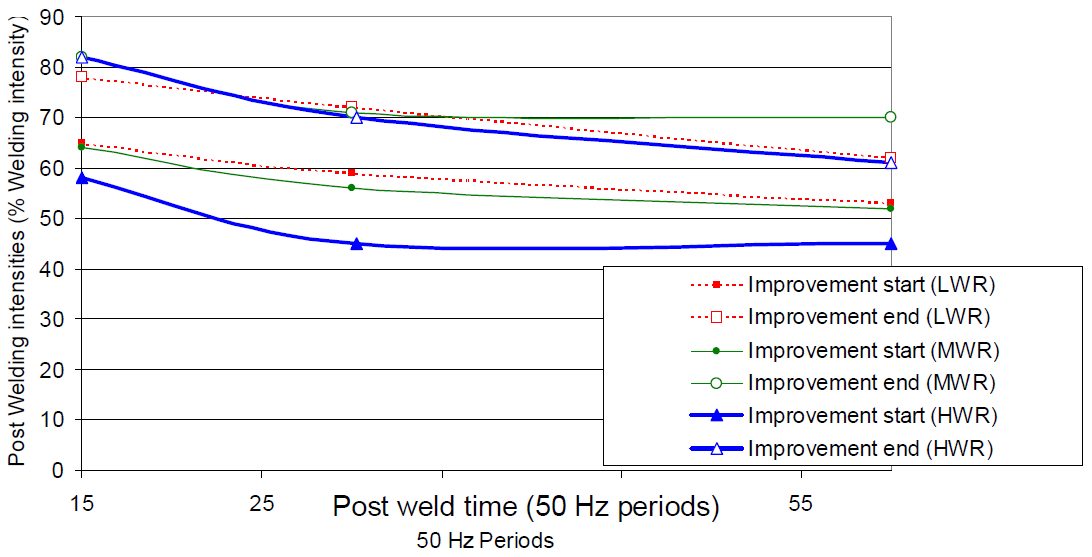
Figure 5: Evolution of post welding current range as a function of post weld time for three welding current levels.D-9
Notch tip hardness measured after different post welding currents has been reported in Figure 6. From this result, a notch tip tempering range is found to be between 400 °C and Ac1.
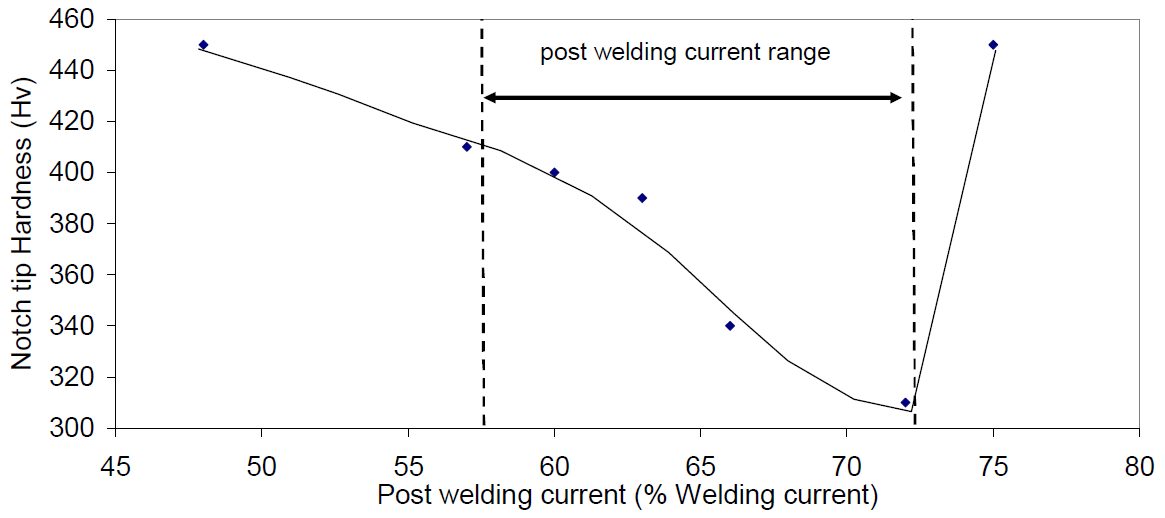
Figure 6: Relationship between measured notch tip hardness and post-welding current (Usibor1500 AlSi 1.5mm, LWR).D-9
Using the notch tip tempering range, a post welding current range can be calculated from Sorpas calculations in Figure 7.
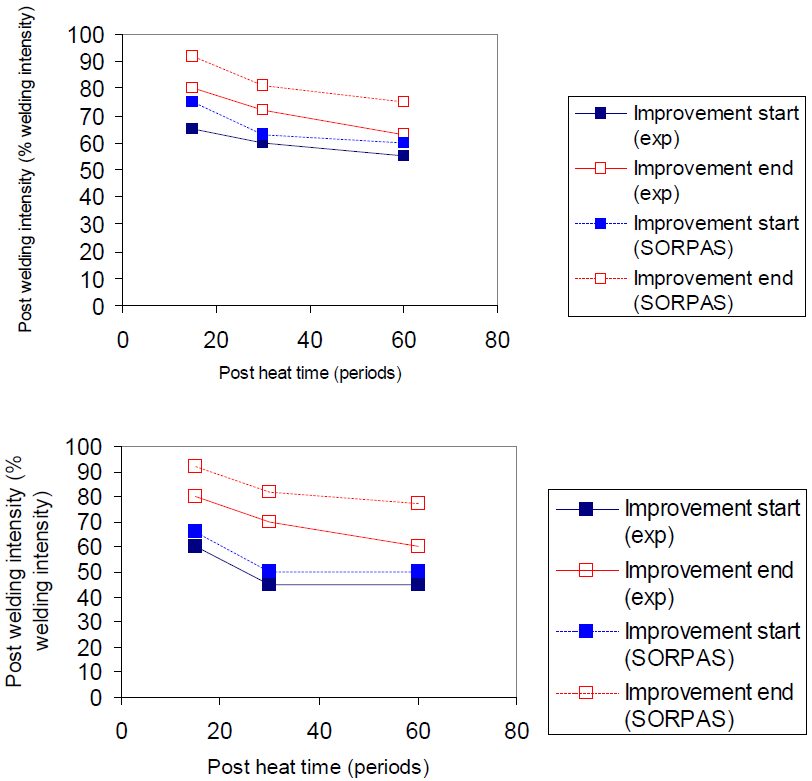
Figure 7: Experimental and numerical post welding current ranges for Usibor1500 AlSi 1.5 mm configuration (above: LWR, below: HWR).D-9
Results are displayed in Figure 8 for post weld time for MS1500 EZ with low welding current LWR.
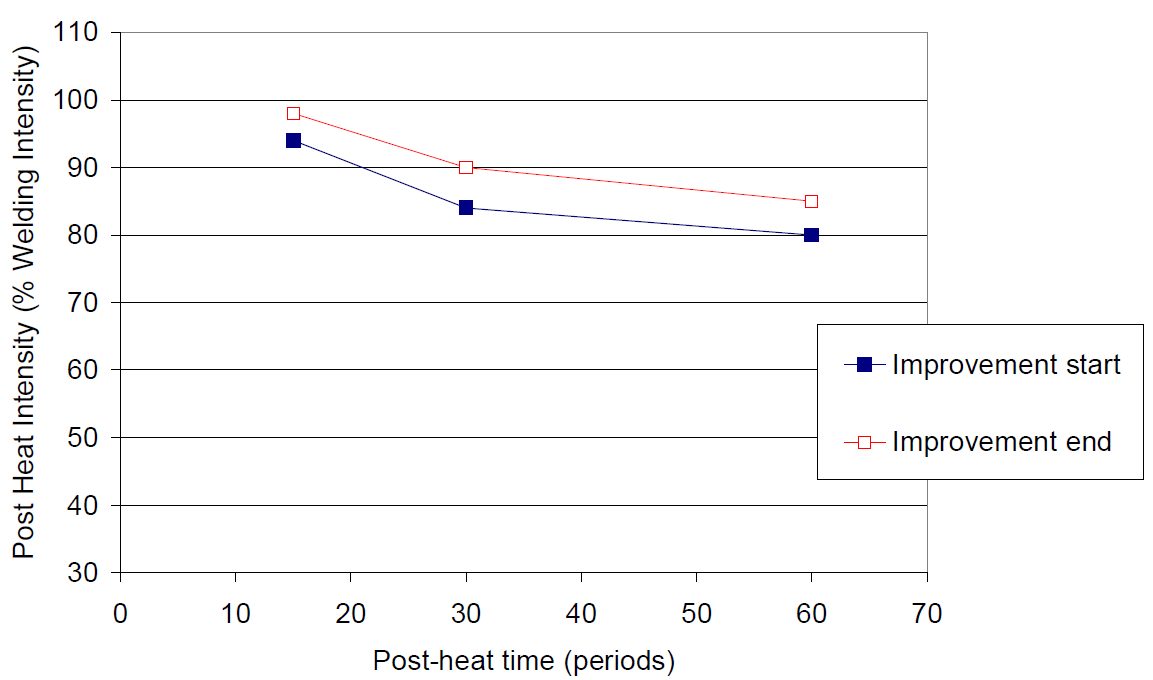
Figure 8: Evolution of post welding current ranges for different post welding times in LWR.D-9
Figure 9 displays results for MS1500 EG 1.5mm configuration.
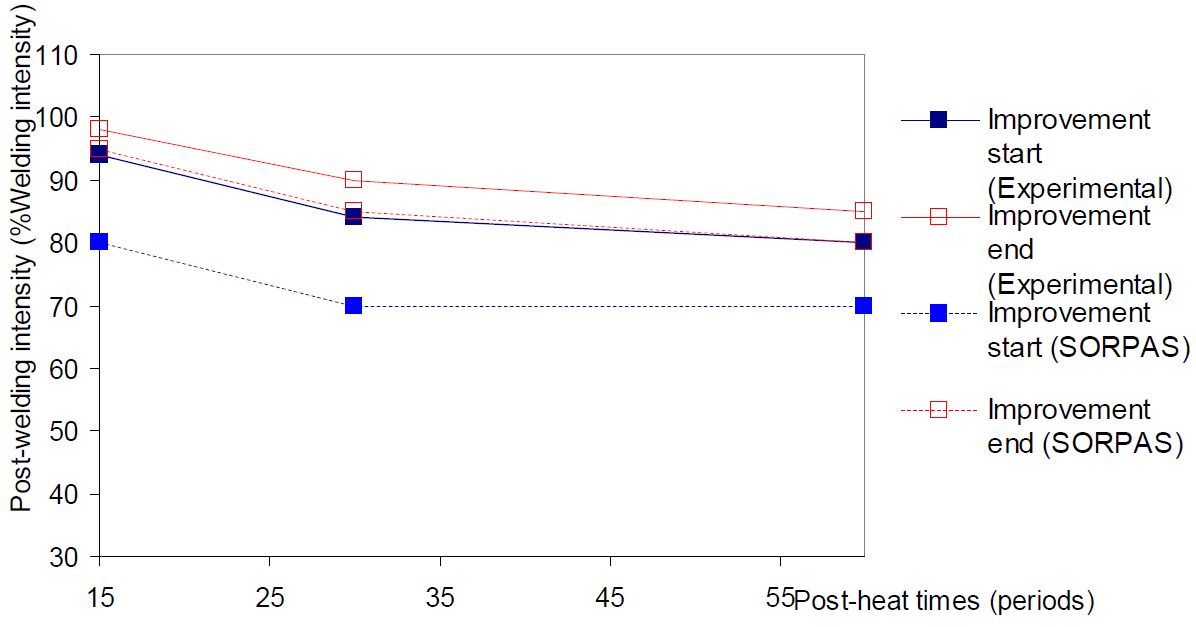
Figure 9: MS1500 EG 1.5 mm configuration experimental and simulated post welding current ranges (LWR).D-9
The same methodology was applied to other configurations and the results are displayed in Table 5.
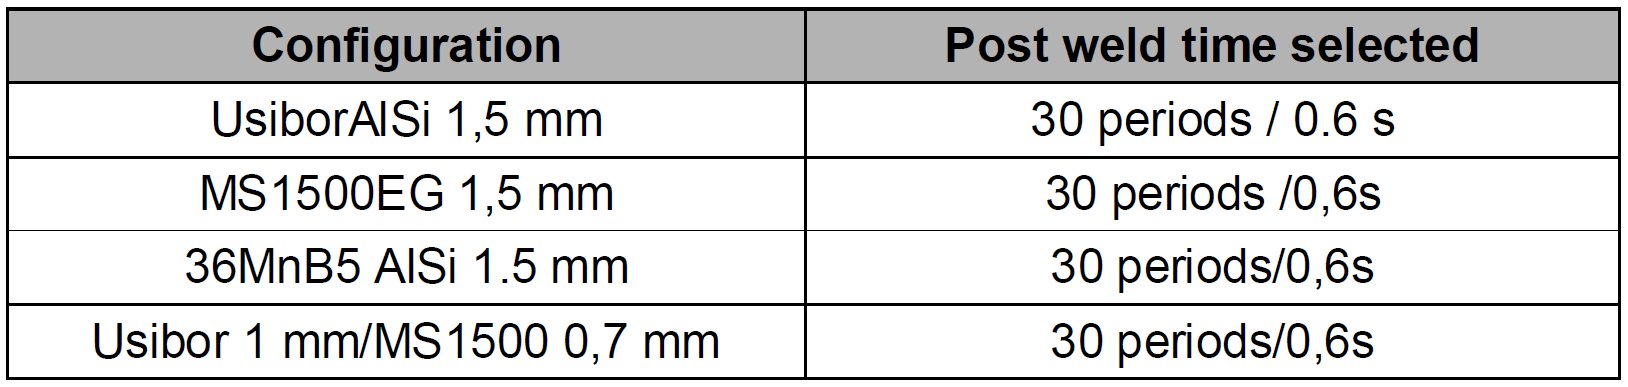
Table 5: Post weld times selected.D-9
Interpolation between experiments was carried out to create a robustness and performance tempering map that is displayed in Figure 10. The map shows tremendous improvement of cross tension strength can be achieved through PWHT. Additionally, the optimal post welding current is around 65% of welding current, and the CTS level reached for LWR and HWR without PWHT is very similar.
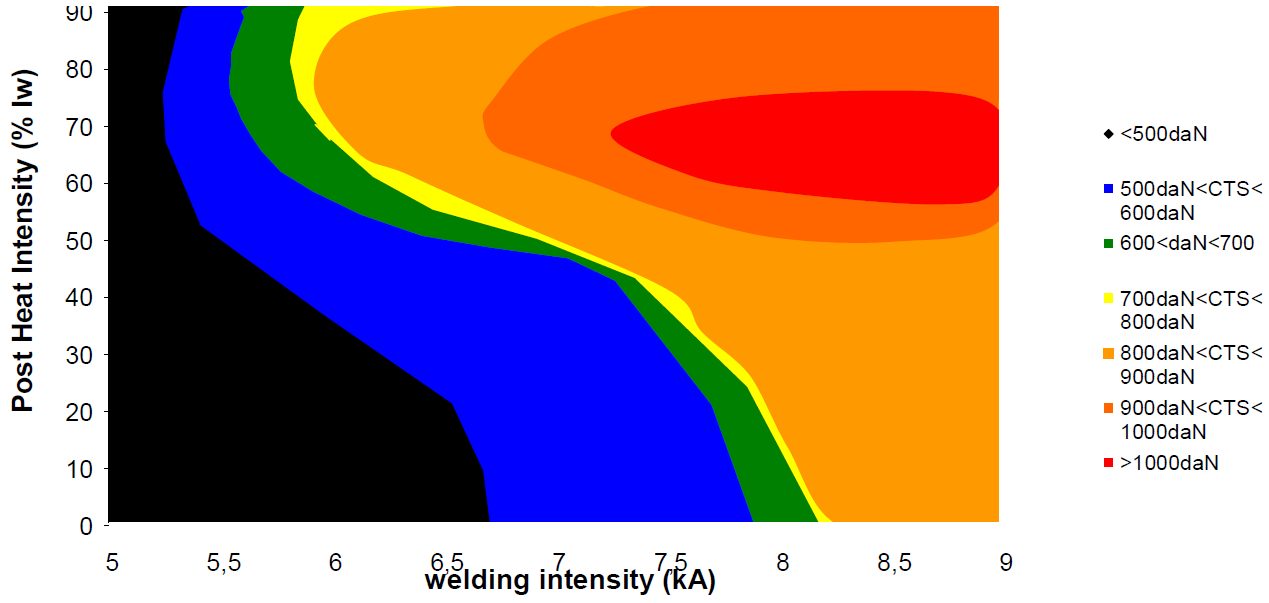
Figure 10: Tempering map for Usibor ® AlSi 1.5 mm homogeneous configuration, drawn after experimental results shown on Figure 9.D-9
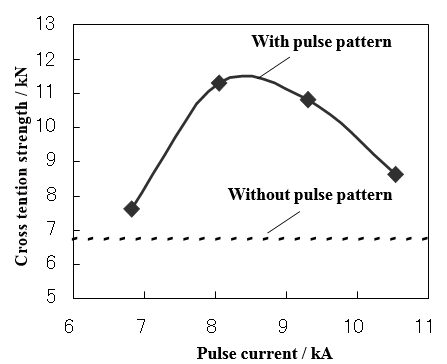
Figure 11 displays cross-tension results for Usibor1500 AlSi using the optimized cycle [Metallurgical Post Weld Heat Treatment (MPWHT)].
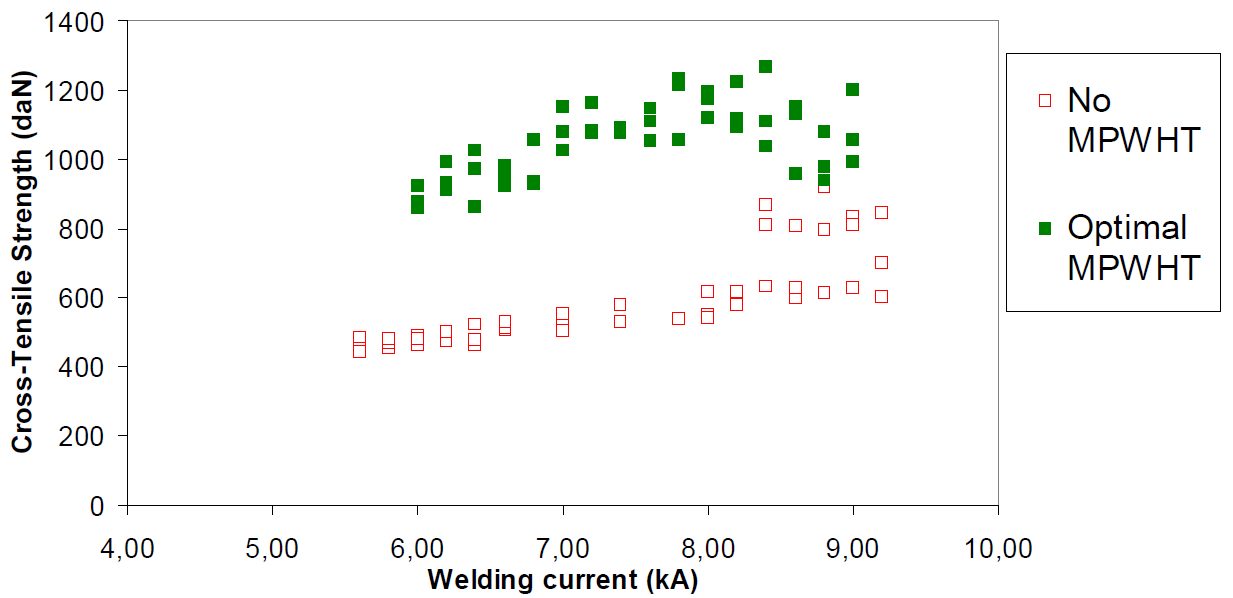
Figure 11: Comparison of CTS along the welding current range, with and without MPWHT.D-9
Table 6 and Figure 12 display all the reference and MPWHT spot weld performance after Cross-Tension testing.
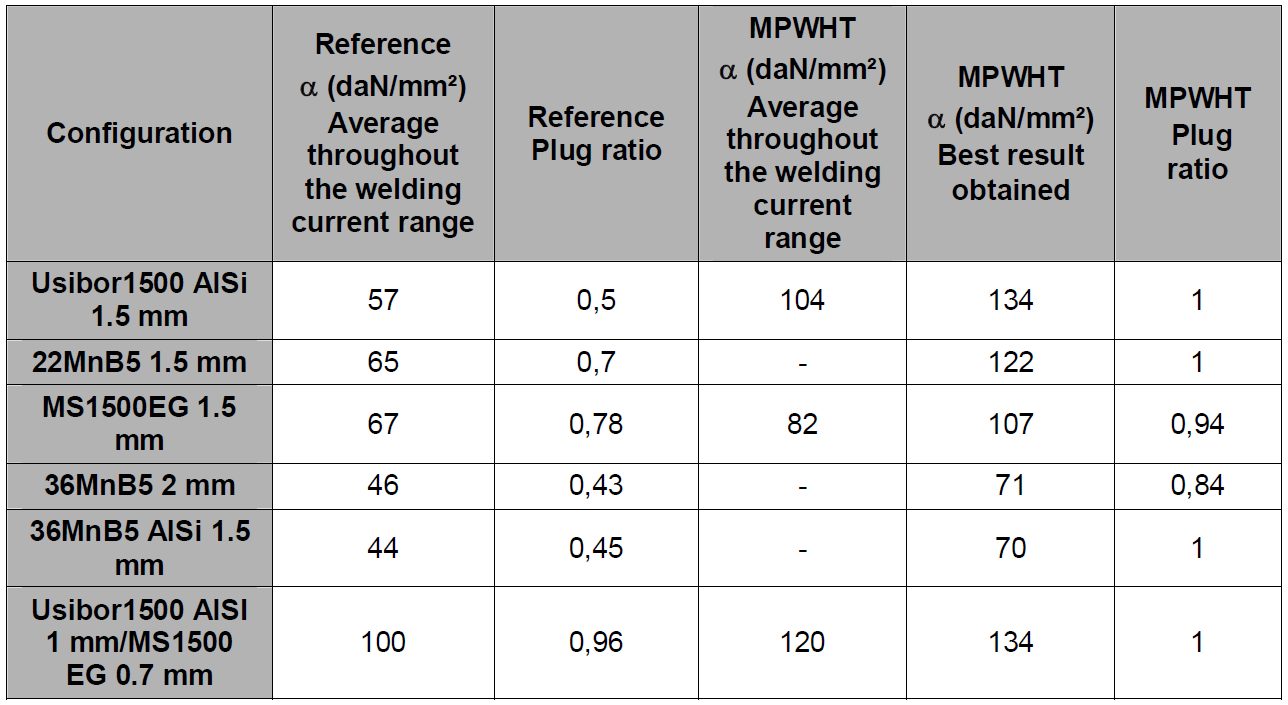
Table 6: ɑ coefficients and plug ratios for reference and with post treatment for all the configurations.D-9
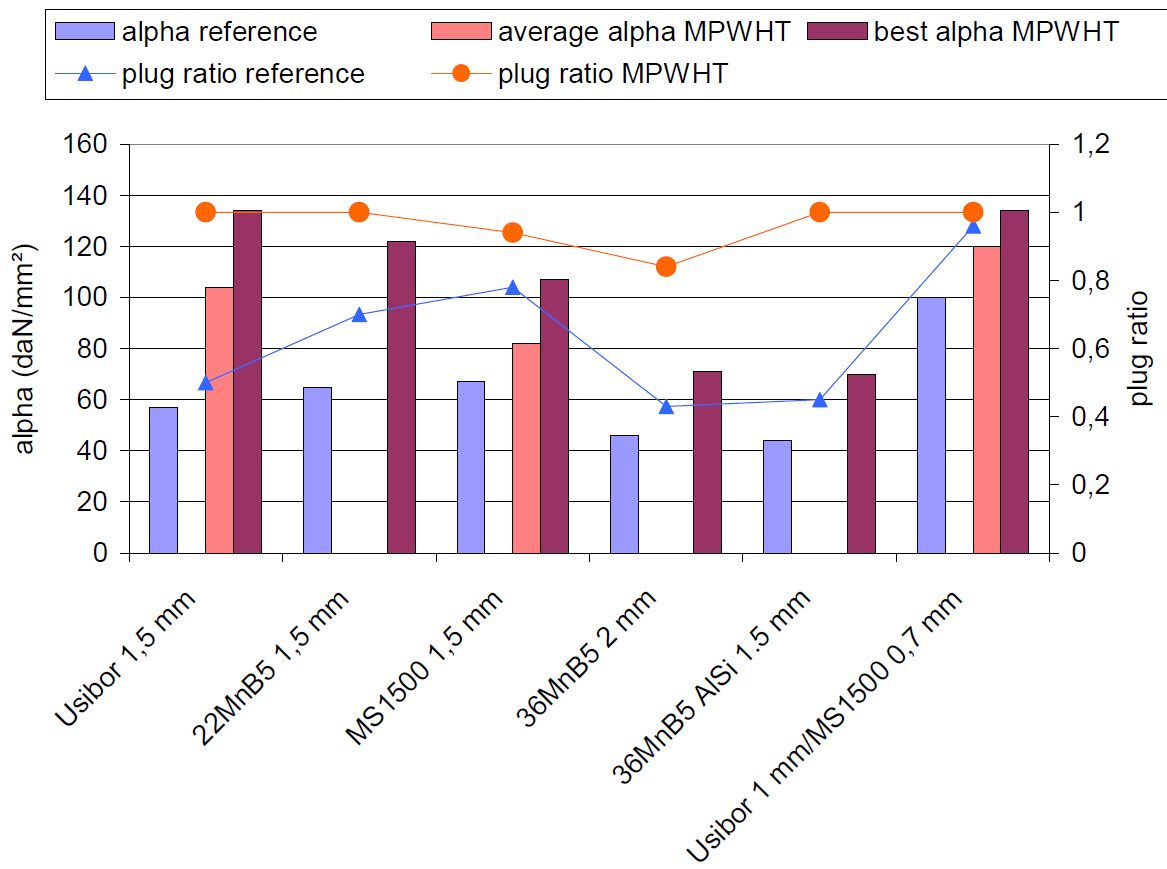
Figure 12: ɑ coefficients and plug ratios for reference and with post treatment for all the configurations.D-9
MPWHT, aiming at tempering the martensite formed during spot welding of Advanced High-Strength Steels, has been studied for several configurations both experimentally and numerically. The methodology proposed in this study is available to determine the optimal process parameters and the process robustness for any new configuration. Among the major results brought by this study:
- A minimum quenching time is necessary to fully transform the weld into martensite before post weld heat treatment; this time can be determined based on metallographic observations, and depends strongly on sheets thickness, chemistry and coating.
- The post weld time is not very sensitive to the configuration welded; 0.6 s seems a reasonable time, although it may be reduced further.
- The post welding current can be simply expressed as a percentage of the welding current, the efficient level being then constant along the welding current range.
- A range of post welding currents can be determined, allowing an efficiency of the post weld heat treatment process. Tempering maps allow common visualization of the welding current and post welding current ranges in two dimensions, to characterize the whole process robustness.
- MPWHT is very efficient in improving the mechanical weld performance in opening mode; cross-tension strength can be doubled in some cases; the process efficiency depends on the chemistry of the grades.
- In case of heterogeneous configuration, the so-called “positive deviation” can give a good performance to the weld even without MPWHT, limiting the improvement brought after post treatment.