Simulation
Evaluating sheet metal formability using computer software has been in common industrial use for more than two decades. The current sheet metal forming programs are part of the transition to virtual manufacturing that includes analysis of casting solidification and rolling at the metal production facility, welding, moulding of sheet/fiber composites, automation, and other manufacturing processes. Computer simulation of sheet metal forming is known by several terms, including computerized forming process development and computerized die tryout.
Many highly developed software programs closely replicate the physical press shop forming of sheet metal stampings. These programs have proven to be accurate in predictions of blank movement, strains, thinning within the blank, wrinkles, buckles, and global formability concerns of necking strains and forming severity as defined by conventional forming limit curves. Accurate prediction of local formability related failures such as cut edge expansion is more challenging due to modeling of the production process influence as opposed to the ideal laboratory edge. Prediction of springback generally provides helpful results in understanding the trends and effects. The quality of springback predictions vary with the specific stamping geometry, the selected metal grade, the input information, and user experience, as discussed in Simulation Inputs.
Virtual forming-process development is ideally suited to the needs of current and potential users of AHSS grades. A full range of analysis capabilities is available to evaluate AHSS behavior in a new stamping. These programs allow rapid “what-if” scenarios to explore the impacts of different grades of AHSS, alternative processing, or even design optimization. A Design of Experiments on actual tooling in a physical press shop is limited to only a few variables and may be subject to noise variables clouding the results. In the virtual press shop, changing variables is done with a stroke of the keyboard, and is far easier to undo than permanent changes to the tooling.
Virtual die tryout has numerous advantages, allowing for assessing the viability of part, process, and die design all before cutting the first hard die. Addressing problems before costly and time-consuming die construction starts leads to improved quality and a better use of resources.
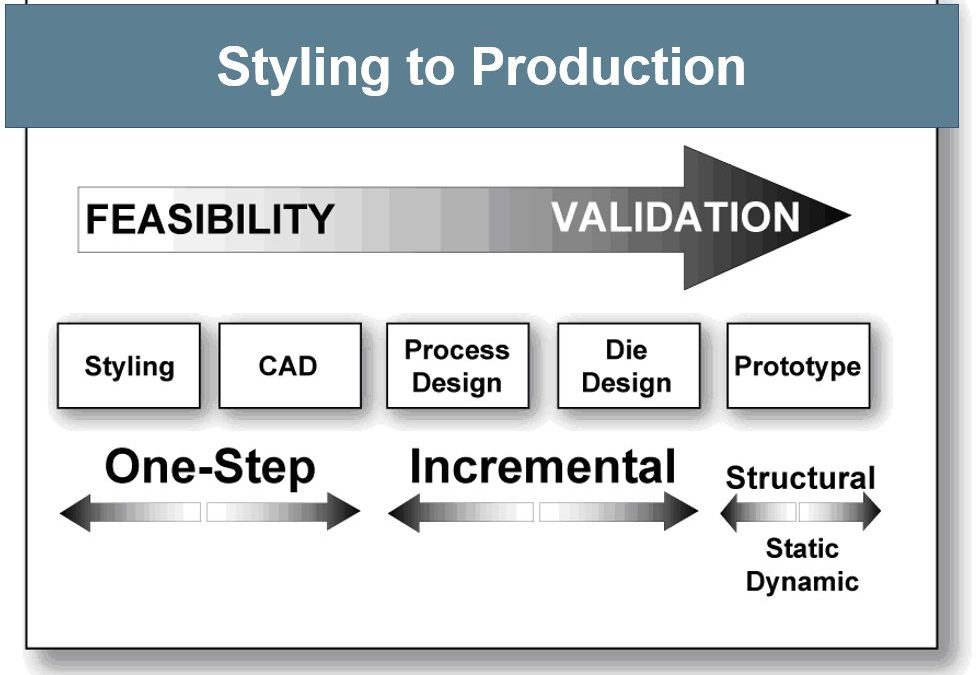
The type of software used depends on the goals and available information at each stage of the process, shown in Figure 1. At the beginning of the styling to production cycle, feasibility – whether the stamping can even be manufactured – is the key question. With only the 3D CAD file of the final part and material properties, One-Step or inverse codes can rapidly ascertain strain along section lines, thinning, forming severity, trim line-to-blank, hot spots, blank contour, and other key information. This approach takes the finished part geometry and unfolds that shape to generate a starting blank, calculating the strain between the two shapes (formed vs. flat). Since it starts with the finished geometry rather than the blank, the process is the inverse of reality. All deformation takes place in a single step, or one step, leading to the description of a one step inverse code. Although this takes reduced computing time, only some simulation packages allow incorporation of the forming process, tooling geometry, and the changes in metal properties associated with deformation.
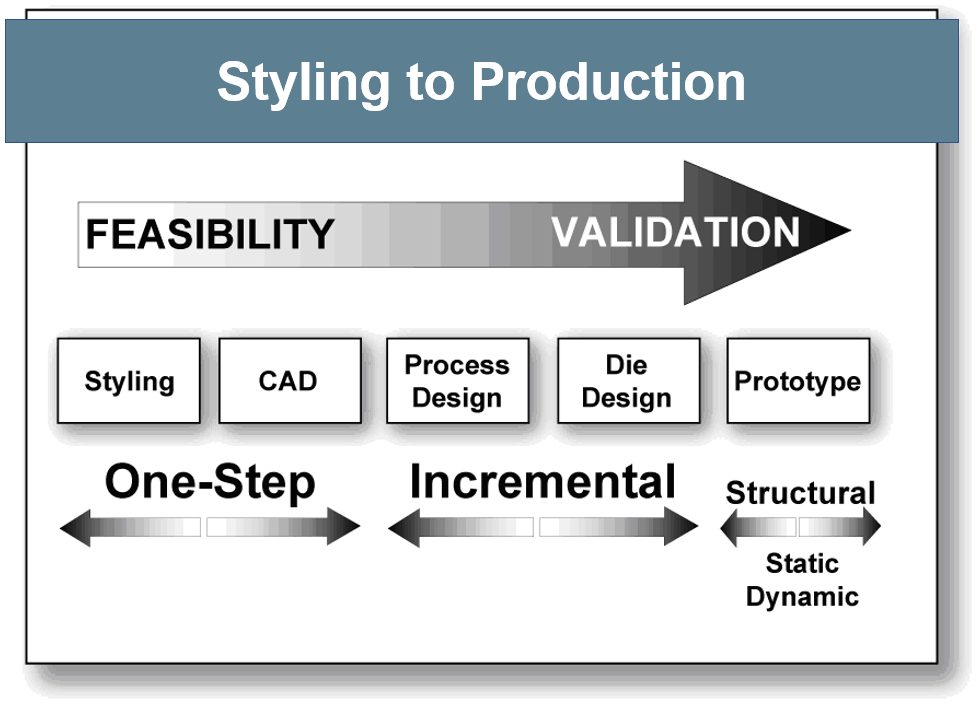
Figure 1: Software types change during processing stage.
Achieving more accurate results involves incremental simulation, where the virtual forming process attempts to replicate reality. This approach models the tools (punch, die, and blankholder) and process parameters (like the blankholder forces, blank shape, and bead geometry, location and restraining forces). Each increment, or time-step, reflects the sheet metal deformation at a different position of the press stroke. Subsequent increments rely on the output from the prior increments. As the quality of the inputs increase, so does the precision of the results.
During selection of process and die design parameters, software evaluates how each new input affects the strains and blank movement (including wrinkles and splits), and generates a press-loading curve. The analysis creates a visual record of the blank deformation into the final part through a transparent die. Each frame of the video is equivalent to an incremental hit or breakdown stamping. Problem areas or defects in the final increment of forming can be traced backwards through the forming stages to the initiation of the problem, allowing problems to be addressed when before they even occur. Some software packages allow analysis of multi-stage forming, such as progressive dies, transfer presses, or tandem presses. This virtual environment also shows the effects of trimming and other offal removal on dimensional precision and springback.
AHSS grades are suited for load bearing or crash-sensitive applications, and forming simulation helps to optimize performance. Previously, the static and dynamic capabilities of part and assembly designs were analyzed using CAD-generated stamping designs with inputs of initial sheet thickness and as-received yield strength. Often the tests results from real parts did not agree with these early analyses because the effects from forming were not incorporated. State-of-the-art applications now model the forming operation first, allowing for local thinning and work hardening to occur. That point-to-point sheet thickness and strength levels are mapped to the crash simulation inputs, resulting in crash models nearly identical to physical test outputs. Correcting deficiencies of the virtual parts by tool, process, or even part design occurs before tool construction has even begun.
Many simulation packages can evaluate the performance of AHSS grades in many forming environments. A simple constitutive equation with a single n-value sufficiently approximated the stress-strain response of older grades. The n-value of AHSS grades changes with strain, so when simulating AHSS grades, input the full stress-strain curve instead of choosing just one n-value. However, this capability may not be present in some proprietary industrial and university software. Use caution when using these programs to analyze AHSS stampings.
Today’s AHSS grades are not the commodities of yesteryear, but instead are highly engineered products unique to the production equipment and processing route chosen by the steelmaker. Although many companies may be capable of meeting the minimum and maximum mechanical properties associated with a specific grade, different suppliers may take up a different portion of the acceptable window. Working with your production steel supplier helps ensure you are using company-specific forming data.
Also remember that there are multiple products associated with a targeted tensile strength. For example, not only are there different families of 980 MPa minimum tensile strength steels (like dual phase, TRIP, and Q&P), but within each family there are multiple options. A grade designated as “DP980” may have enhanced global formability as measured with total elongation, enhanced local formability as measured in a hole expansion test, or have a balance between those properties. The associated material card for simulation will be different, and use of the incorrect card in development could lead to an under-engineered process when attempting to run with production steel.
Optimization Measures Applicable To Higher Strength Grades
- Simulation-driven compensation: Predict springback trends using metal forming simulation tools and apply geometric compensation to tooling surfaces based on sectional springback analysis.
- Process parameter optimization: Adjust blank holder force, drawbead resistance, and forming angles to balance material flow and reduce stress concentration.
- Post-forming correction: Add restriking or calibration processes to mitigate residual springback.
- Tooling design enhancements: Incorporate friction-reducing coatings and optimize mold geometry (e.g., increased draft angles) to control metal flow.
Key Points
- A virtual tryout evaluates the stamping and die design, and can detail areas of severe forming, buckles, excessive blank movement, and other undesirable deformation before starting tool construction.
- Evaluating alternative “what-if” scenarios in a virtual environment is faster and more efficient than grinding and welding on physical tooling, and mistakes have no permanent impact.
- Design of Experiments (DOE) studies are challenging to do in the physical press shop. The large number input changes required by the process makes it difficult to attribute changes to the intended variables tested or to some noise factor. Simulation allows for easier and faster evaluations when changing one or more parameters.
- AHSS grades change properties when deformed under different forming conditions. Forming simulation captures these changes to show how the final product will react.
- Observing the sheet metal transition from a flat blank to the engineered stamping in a transparent die is a valuable troubleshooting tool provided by virtual forming.
- Simulation codes accurately capture blank motion, thinning strains within the body of the stamping, and other global formability issues like severity compared with the conventional forming limit curve. However, prediction of local formability concerns like sheared edge stretchability is lacking due to the challenges of capturing all the effects related to creating that cut edge.
- The virtual forming codes do not accurately predict springback or the success of springback correction procedures because of the lack of pertinent data within a basic material card combined with the lack of accurate data everywhere in the stamping during the entire forming operation. However, users report reduction in recuts of the die from 12 or more to three or four based on information from the code.
A well-defined material card and accurate descriptions of metal flow throughout the stamping are critical for precise springback predictions, as discussed in the section on Simulation Inputs. Lacking that, many simulation packages can at least provide guidance on the trends which may help guide springback countermeasures.
![Shear Affected Zone]()
Cutting, Cutting-Blanking-Shearing-Trimming
A cut edge has four distinct zones with different characteristics:
- Rollover – The plastically deformed zone bent as the cutting tools contact the edge of the sheet surface.
- Burnish – The zone where the cutting tools penetrate into the sheet metal, prior to any fracturing. The sheet metal stresses are such that the surface compresses into the cutting tool, which gives it a flat, smooth, and shiny appearance. The shear zone is another name for this region.
- Fracture – The zone where the cutting steels fracture the sheet metal, leading to separation from the remainder of the sheet. The surface of this region is rougher than the burnish zone, and is at an angle from the cutting direction.
- Burr – The metal elongated and pushed out on the trailing edge of the cut.
The cutting process also deforms the metal near the shear face, creating what is known as the shear affected zone (SAZ). The degree and influence of this deformation is a function of the cutting process (shearing, water jet, laser, and so on) as well as the steel microstructure and strength. Many studies conclude plastic deformation within the SAZ is a key contributor to sheared edge stretching failures.
The Shear Affected Zone is the area of work-hardened steel and microstructural damage behind the sheared edge. The deformation pattern in the SAZ includes a large shear-induced rotation of the grains that increases with proximity to the sheared edge. An etched cross-section such as that shown in Figure 1 highlights the grain rotation and gives a visual indication of the size of the zone.
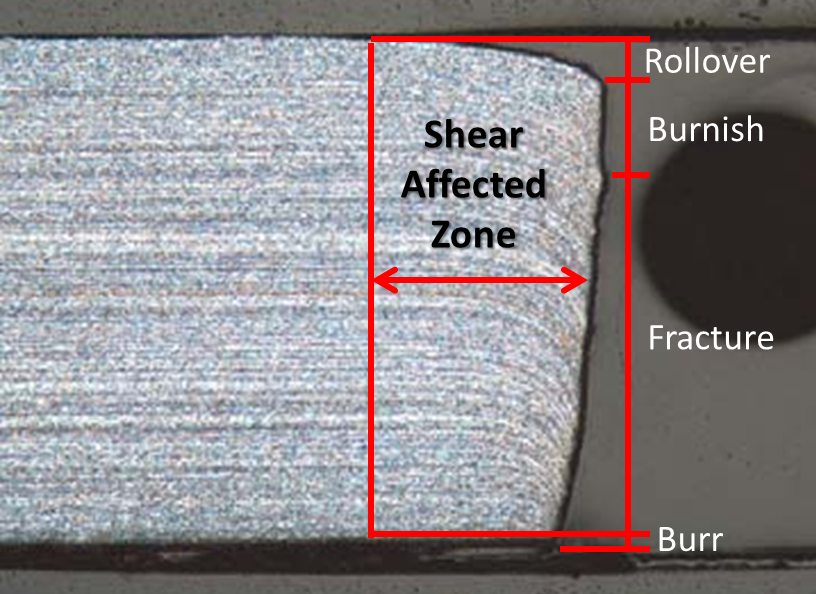
Figure 1: Shear Face Components and Shear Affected Zone.K-1
Work hardening in the SAZ leads to a way to quantify the depth of the SAZ: by creating a hardness profile with readings starting at the edge and progressing deeper into the metal. The end of the SAZ occurs when the hardness readings level off to the bulk hardness.
Figure 2 compares the edge and hardness readings for CP800 and DP780, showing the depth of the SAZ for DP780 is about 41% of the initial sheet thickness of 1.56 mm, and the depth of the CP800 SAZ is 20% of the initial 2.90 mm sheet thickness.P-12
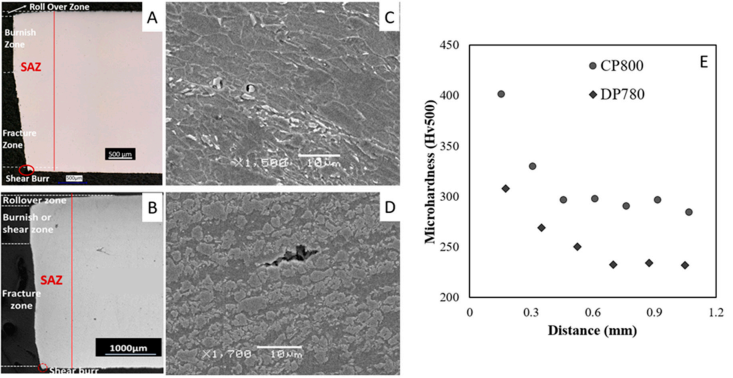
Figure 2: A) Sheared edge and SAZ of CP800; B) Sheared edge and SAZ of DP780; C) CP800 microstructure away from edge; D) DP780 microstructure away from sheared edge; E) hardness profile for the two sheared edges in the rolling direction.P-12
Plastic deformation from cutting and subsequent edge expansion forms micro-voids and creates other microstructural damage. The voids grow and combine with neighboring voids to create micro-cracks, which in turn combine with other micro-cracks resulting in the cracks that cause fractures in stampings.
Void nucleation in DP steels occurs through two mechanisms: decohesion of the ferrite-martensite interface or fracture of martensite islands.P-12, A-27, A-28 Figure 3 shows an example of both.
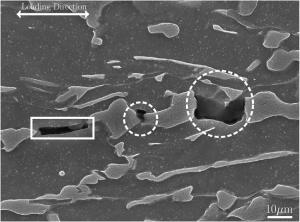
Figure 3: Aligned voids along loading direction. White solid square shows interface damage between martensite and ferrite. White dashed circles show voids formed by cracking of martensite.A-28
The study in Citation P-12 compared CP800 and DP780. The CP800 microstructure contains ferrite, bainite, and martensite. The DP780 microstructure has more martensite, with a larger strength differential between the phases, which combines to result in a lower nucleation strain and accelerated void nucleation compared with CP800. The DP grade has a larger SAZ, further promoting nucleation, growth, and coalescence of voids. This results in failure at a lower strain and leads to the lower edge stretchability of the DP780 compared to the CP800 alloy.P-12 The ductility of bainite restrains void initiation at high strains, which may play a role in improved sheared edge performance.S-24, S-25
Fracture initiation energy, a measure of fracture toughness correlates with hole expansion and stretch-flangeability as shown in Figure 4.Y-5
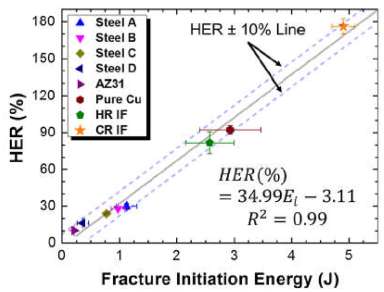
Figure 4: Correlation between fracture initiation energy and hole expansion ratio of various metals. Steels A – D are AHSS grades with Tensile strength ranging from 725 – 1000 MPa.Y-5
In addition to microstructural damage and fracture mechanics, simulation models improve in accuracy when the incorporating the effect of the temperature increase in the localized deformation zone. Simulation of the blanking of AISI 1050 shows a temperature at the cut edge of 440 °C. The edge temperature may be even higher in AHSS grades due to their higher strength.A-29
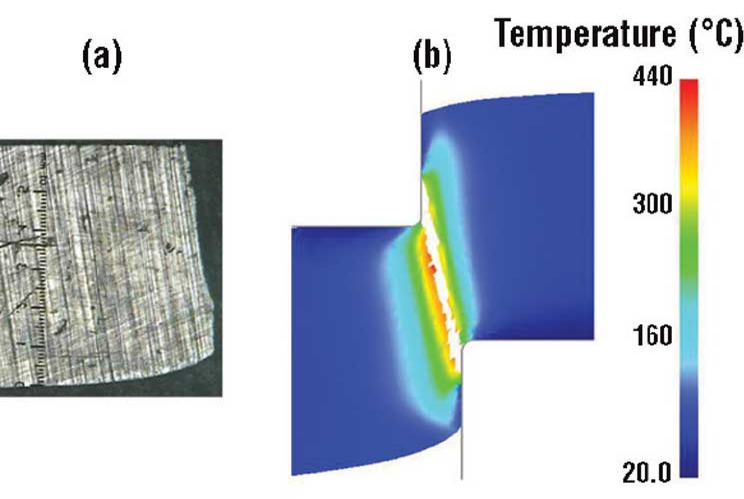
Figure 5: 1.27mm AISI 1050 steel blanked with 15% clearance. The simulation shows temperature, with the cut face getting as hot as 440 °C.A-29
When factoring in the considerations described here, simulation accuracy of hole expansion and sheared edge stretching improves significantly. Citations L-13 and L-14 provide additional background information about the Shear Affected Zone.
Citations
Citation:
R-22. P. Rodriguez-Calvillo, J. M. Cabrera, R. G. Thiessen, J. Molina, I. Sabirov, Y. Cui, I. Diego de Calderon, G. Xu, L. Kestens, R. Petrov, D. De Knijf, J. Van Poucke, C. Föjer, A. Di Schino, P. Mecozzi, J. Siestma, and M.J. Santofimia,“New advanced high strength steels by the quenching and partitioning (Q&P) process (NEWQP)”, Grant Agreement RFSR-CT-2011-00017 covering 1 July 2011 to 31 December 2014, Final report to the Directorate-General for Research and Innovation of the European Commission, ISSN 1831-9424, 2015, doi.org/10.2777/104771.
