RSW Joint Performance Testing
This articles summarizes a paper entitled, “New Test to Analyze Hydrogen Induced Cracking Susceptibility in Resistance Spot Welds,” by M. Duffey.D-10
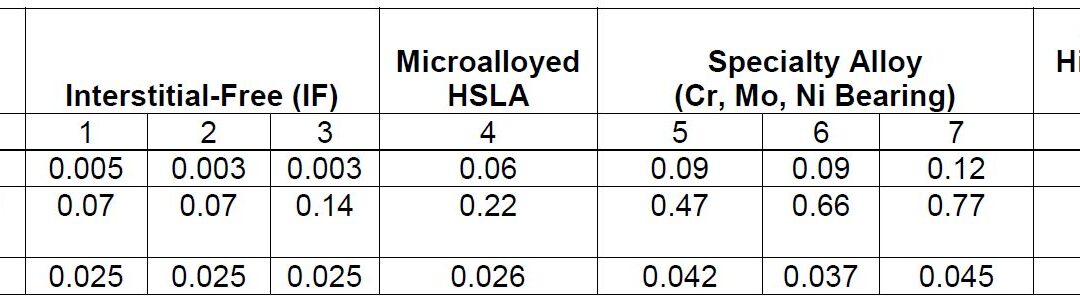
This study aims to develop a new weldability test to analyze the susceptibility of HIC in RSW of different steels. A total of eight different steel samples were analyzed with their carbon content, associated American Welding Society (AWS) carbon equivalencies, and gauges shown in Table 1. All materials were tested in the full-hard condition (all have been cold-rolled).
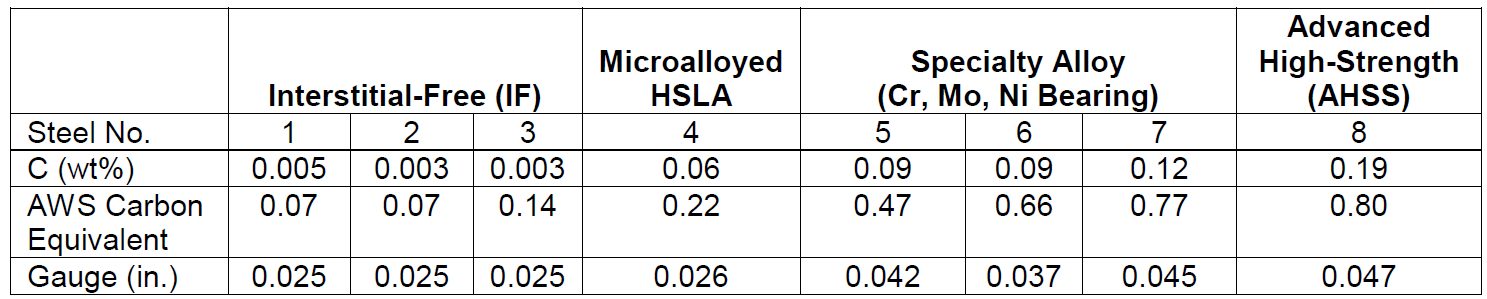
Table 1: Tested Steels, Carbon Equivalencies, and Steel Gauge.D-10
The associated parameter ranges for welds made with each steel are in Table 2. The resistance spot weld was made in the middle of the sheets, as shown in the test setup in Figure 1. There was a total of 18 test samples (nine not painted and wiped, nine painted) for each material tested.
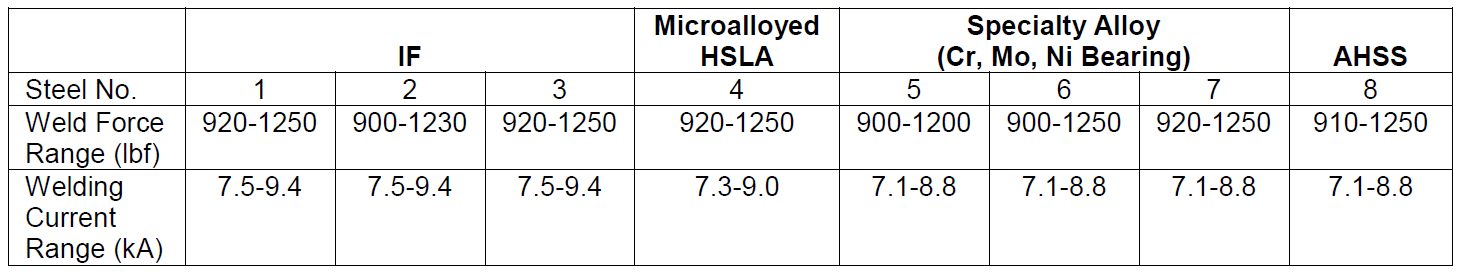
Table 2: Welding Parameters.D-10
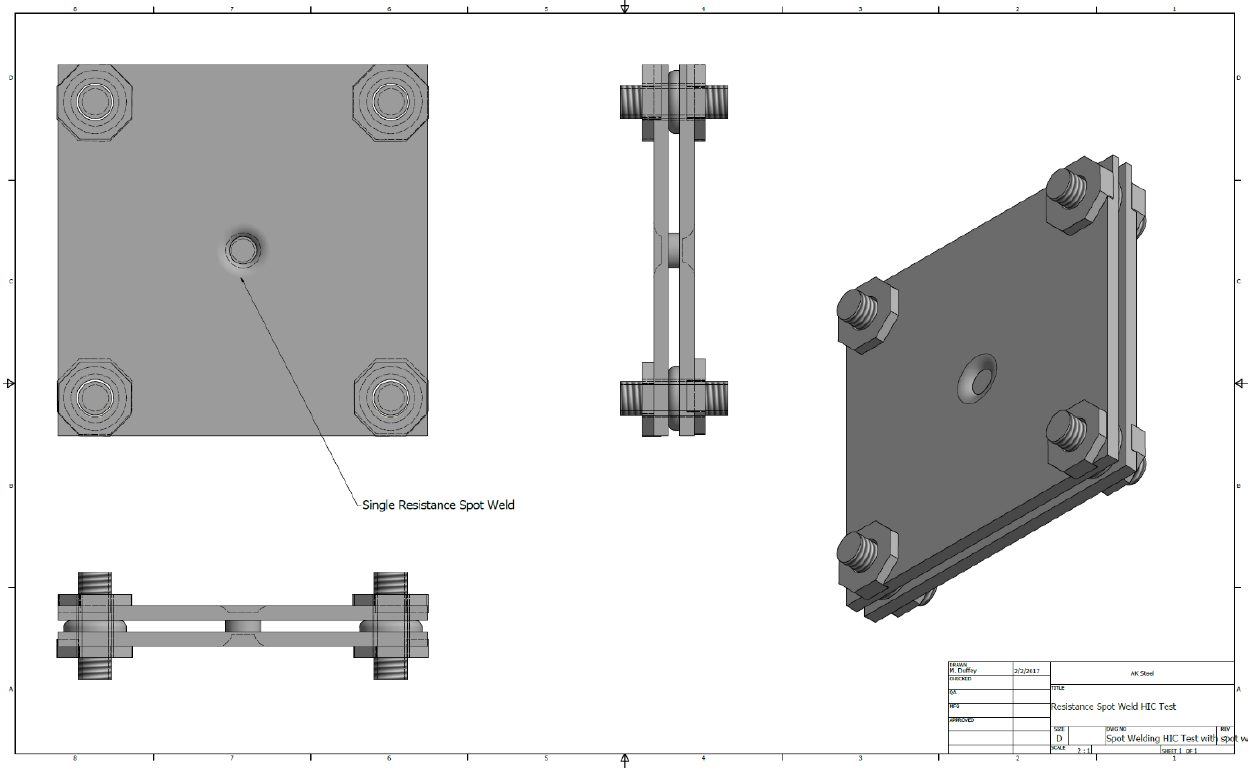
Figure 1: HIC Test for Resistance Spot Welds Schematic.D-10
Figure 2A shows the results of the 3- × 3-in. tests. Figure 2B shows the results of the 4- × 4-in. tests. Figure 2C shows the results of the 5- × 5-in. tests.
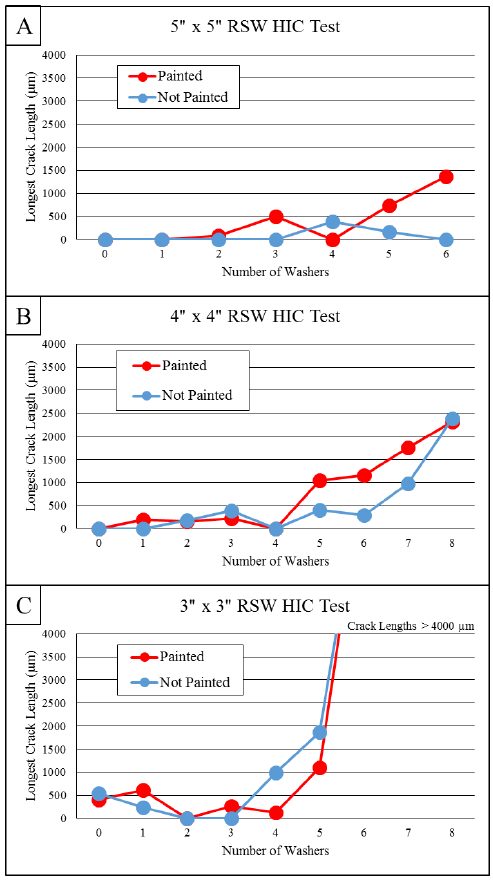
Figure 2: Results of the Three Different Test Sizes on AHSS.D-10
Cracks consistently initiated at the periphery of the weld nugget where the two steel sheets came together. Cracks then propagated either in the weld metal or HAZ, as shown in Figures 3 and 4.
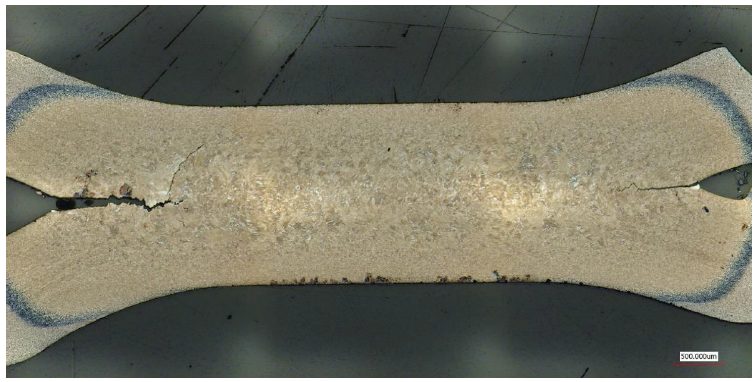
Figure 3: Cracking in the Weld Metal of Steel 8.D-10
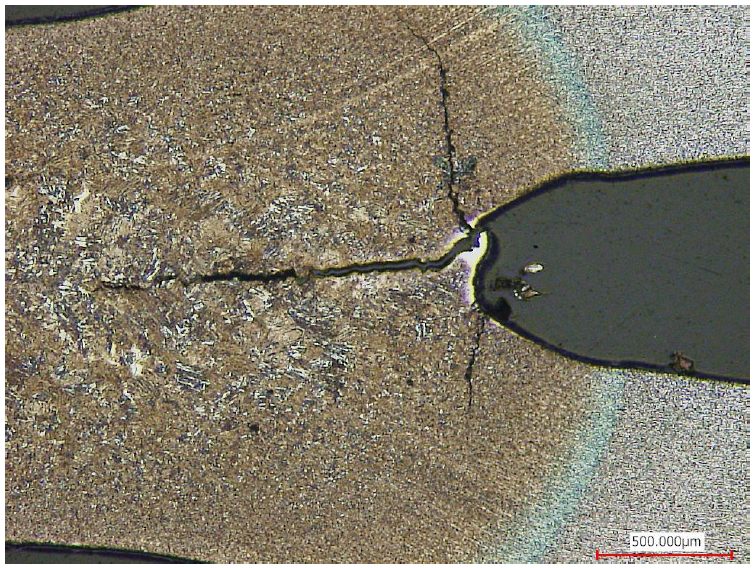
Figure 4: Cracking in Both the Weld Nugget and HAZ in Steel 8.D-10
Figure 5 displays the results from Steels 1, 4, and 5. Steel 1 is the most resistant (of the three) to HIC. For the three steels shown in Figure 5, the crack length (at each gap spacing) was longer for the painted sample than the non-painted sample.
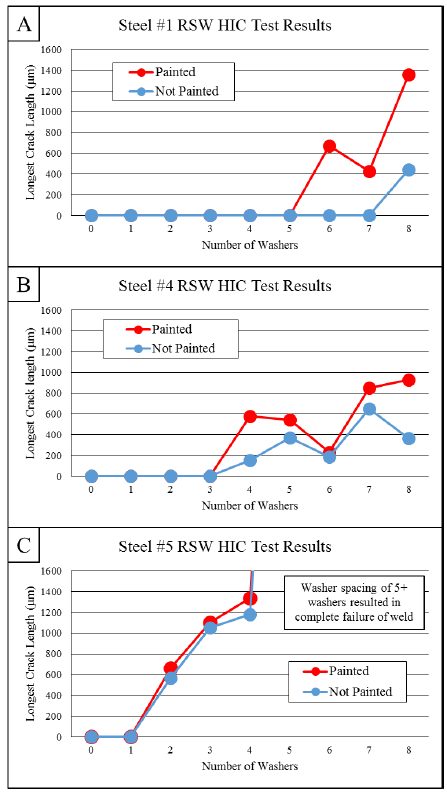
Figure 5. Test Results for Steels 1, 4, and 5.D-10
The microstructure of IF Steels 1-3 (Figure 6A) was ferrite. The microstructure of the high-strength low-alloy (HSLA) Steel 4 (Figure 6B) was a mixture of grain boundary ferrite, martensite, and possibly some bainite. The microstructure of the specialty alloy Steels 5-7 and AHSS Steel 8 (Figure 6C) was entirely martensite.
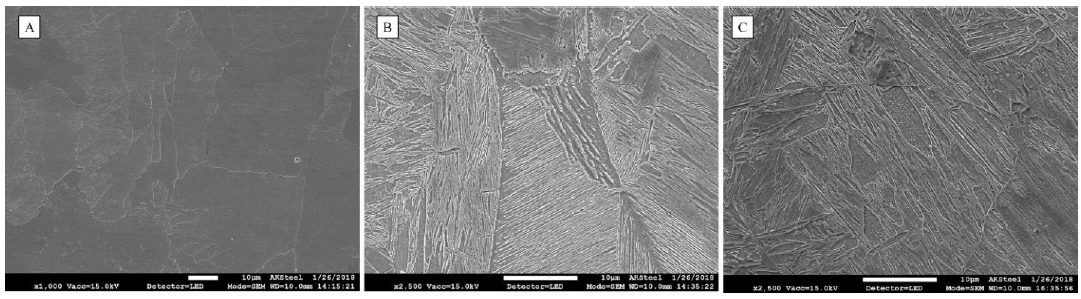
Figure 6: Microstructures of the Different Weld Nuggets.D-10
Figure 7 shows the fracture surface of a crack completely through Steel 7.
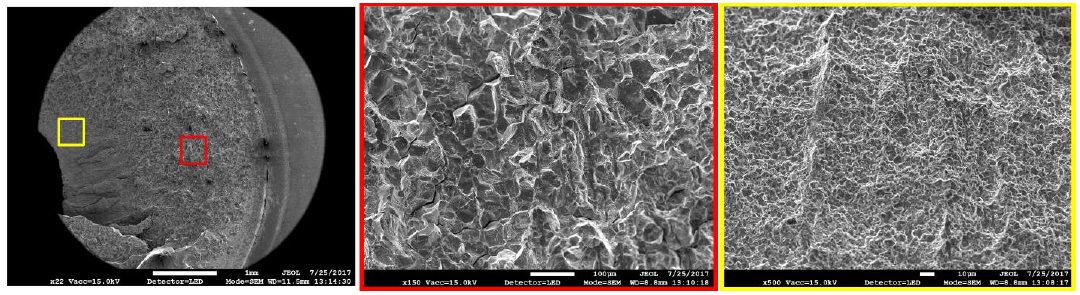
Figure 7: Fracture Surface of Cracked Weld in Steel 7.D-10
The average and maximum hardness results of spot welds in each material are summarized in Figure 8.
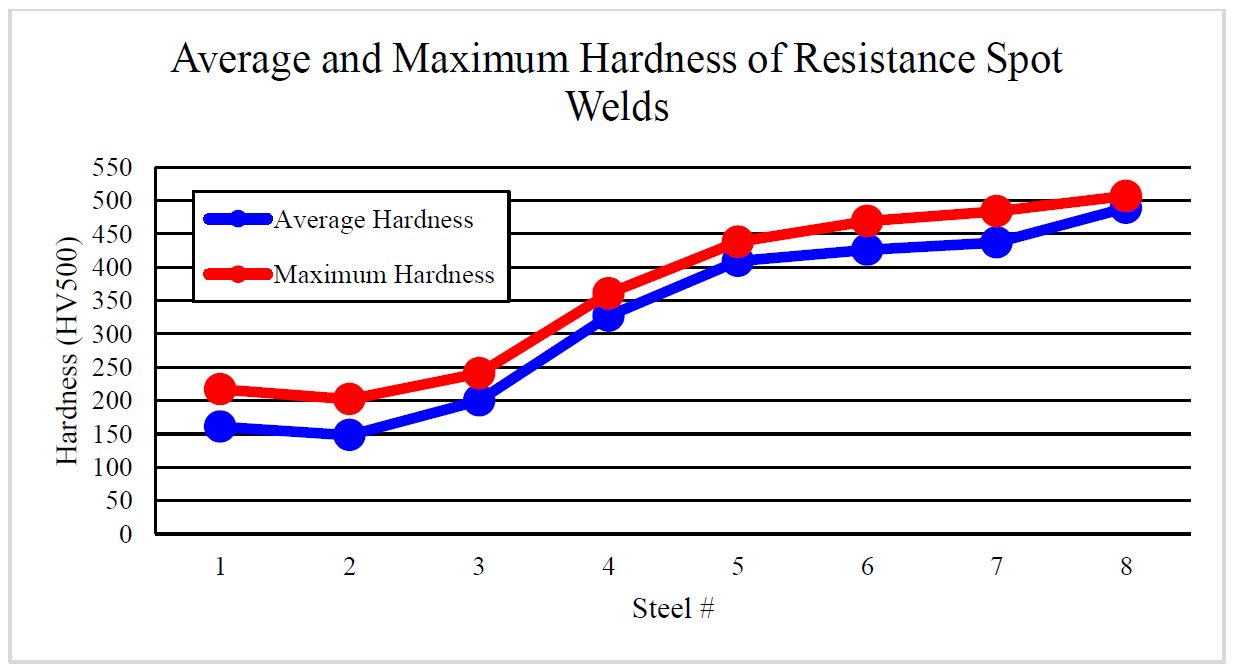
Figure 8. The Average and Maximum Hardness of HAZ and Weld Nugget in Resistance Spot Welds of Each Steel.D-10
Figure 9 is a graph that displays the carbon equivalence, number of washers where cracking first began, and average hardness of the weld nugget and HAZ in each steel.
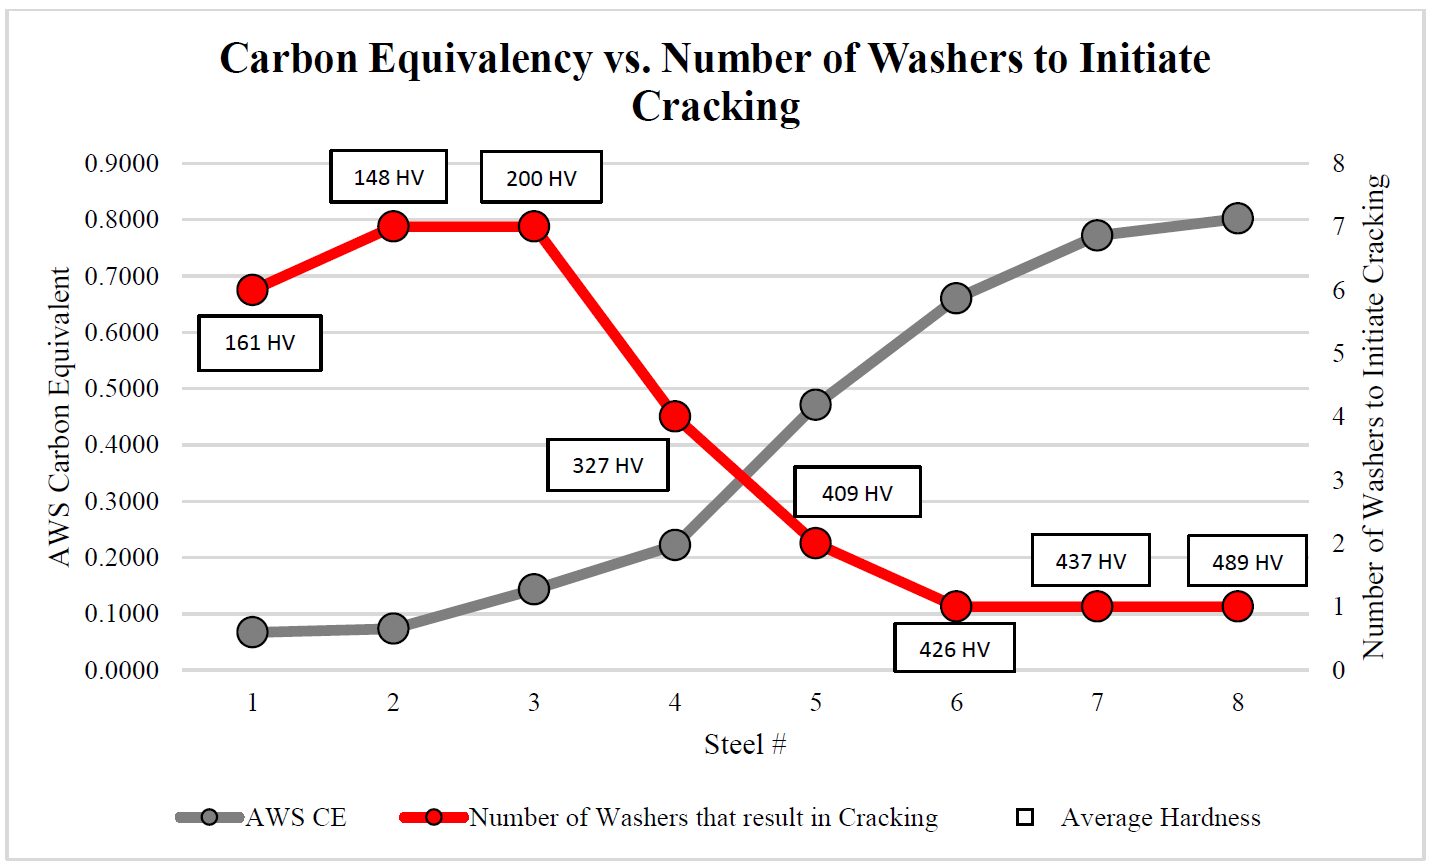
Figure 9: Carbon Equivalency vs. Number of Washers to Initiate Cracking.D-10
Projection Welding
This paper summarizes a paper, entitled “Resistance Welding Projection Methodologies as Applied to Hot-Stamped Boron”, by D. Crist, et al.C-11
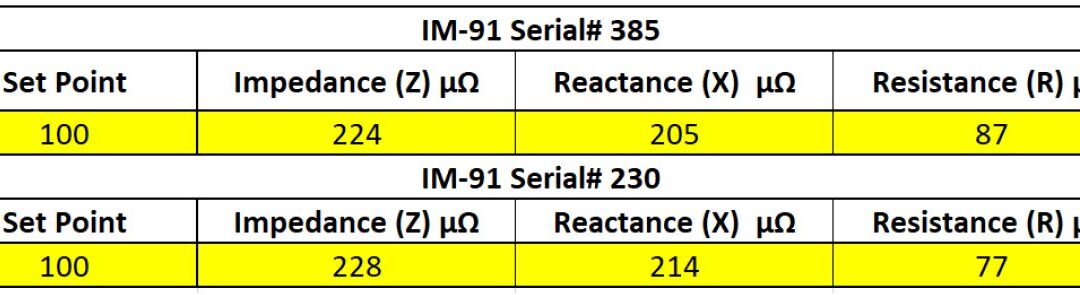
The study focuses on two different Resistance Projection Welding approaches and compares the welding parameters, mechanical properties and destructive results. Table 1 lists the secondary impedance measurements and Table 2 lists the material information for the PHS-CR1500T-MB-AS.
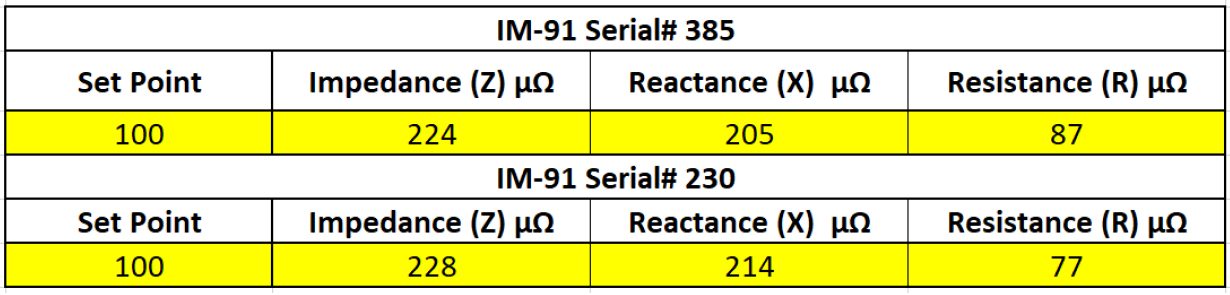
Table 1: Secondary Impedance Measurements.C-11
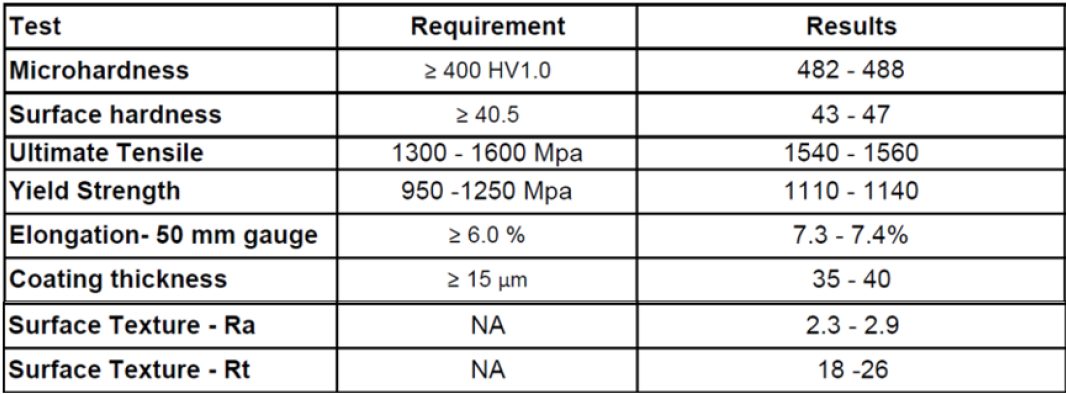
Table 2: Coupon Material Information.C-11
The thickness of the material chosen was 1.80 mm and the weld coupon dimensions are shown in Figure 1.
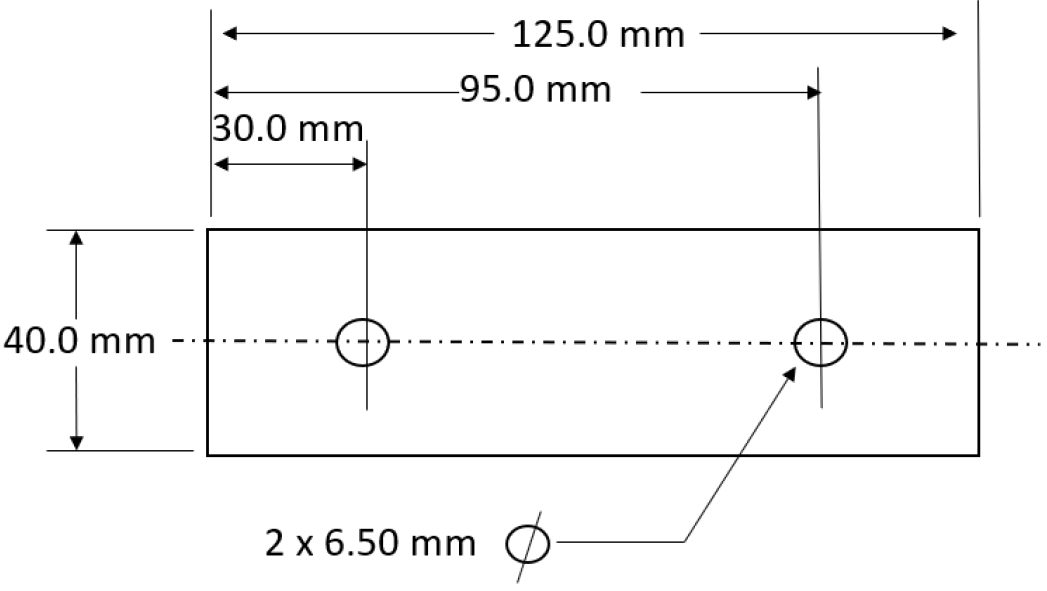
Figure 1: Weld Coupon Dimensions (not to scale).C-11
The projection weld nut used for testing is an M6 hex flange, three projections, non-piloted weld fastener. Detailed dimensions are shown in Figure 2.
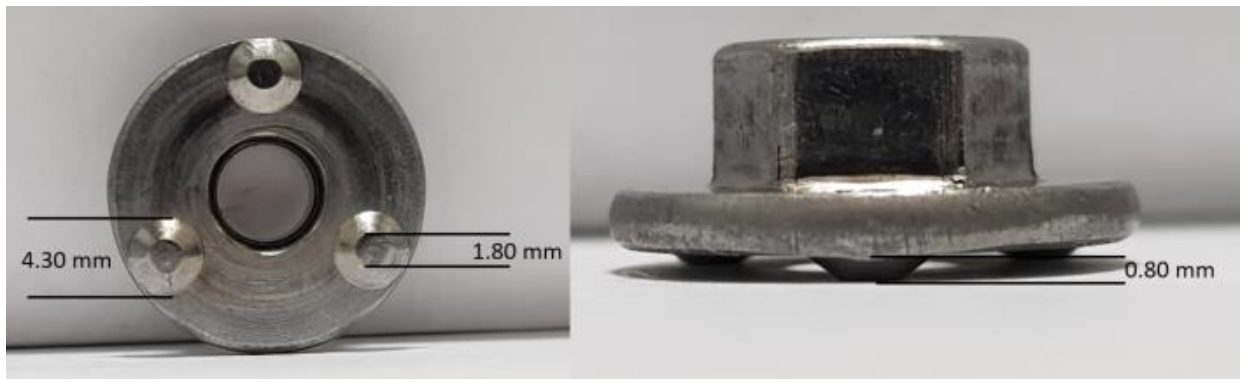
Figure 2: Projection Weld Nut.C-11
Table 3 lists the weld schedule methodologies tested in this study. Table 4 shows the optimized weld schedules based upon push-off strength and visual weld flash level.
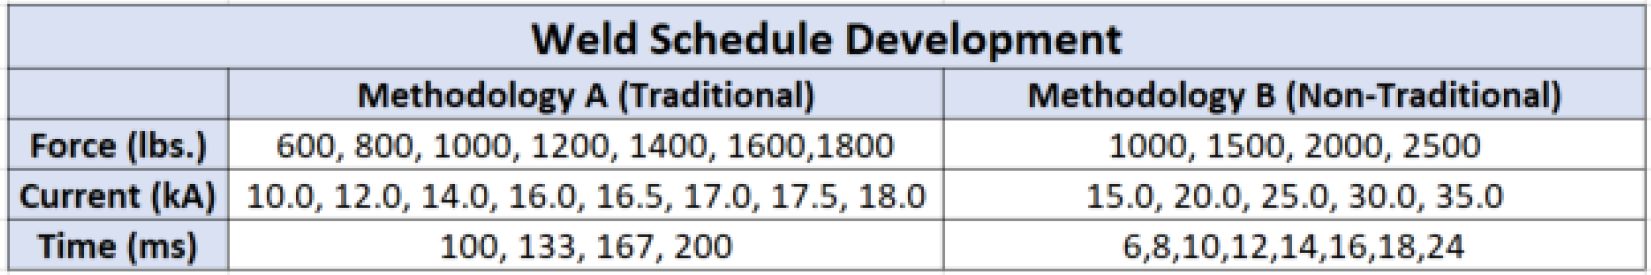
Table 3: Weld Schedule Development.C-11
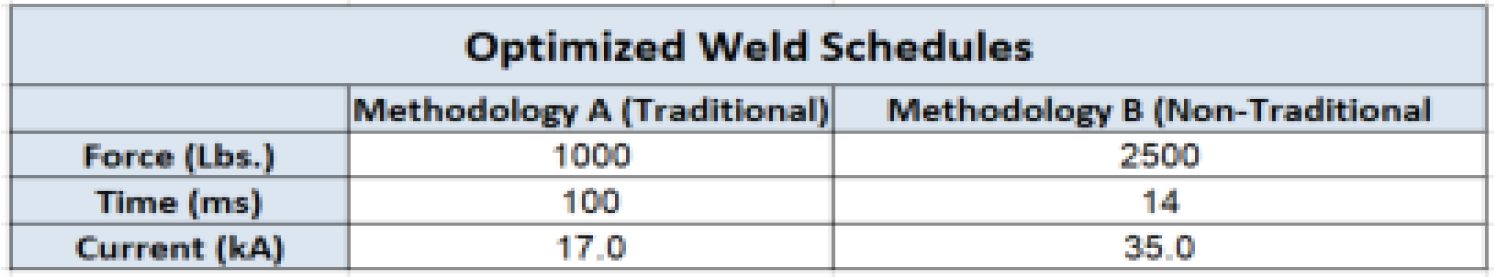
Table 4: Optimized Weld Schedules.C-11
Repeatability testing for both Methods A and B are shown in Figures 3 and 4. The data produced for Method B shows a higher average of repeatability.
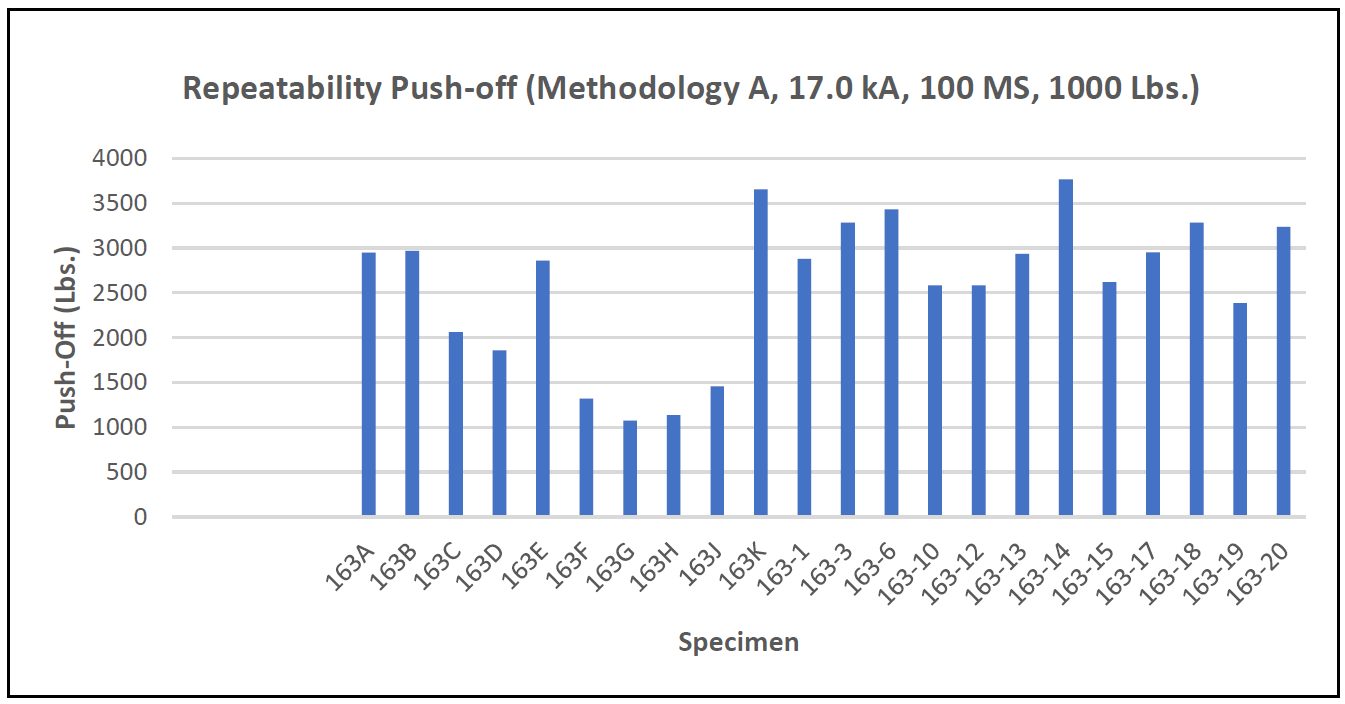
Figure 3: Repeatability Push-Off Method A.C-11
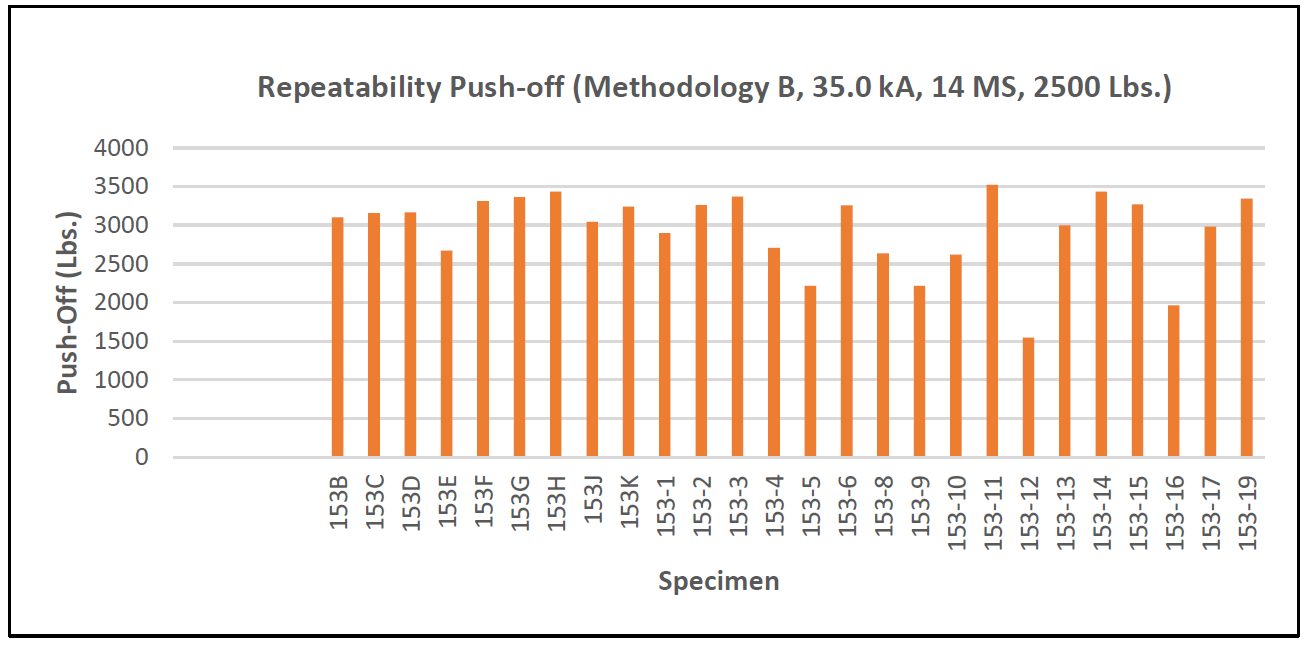
Figure 4: Repeatability Push-Off Method B.C-11
Two different failure methods were observed. Figure 5 shows full thickness buttons were pulled thought the flange for Method A and Figure 6 demonstrates partial thickness failure for Method B.
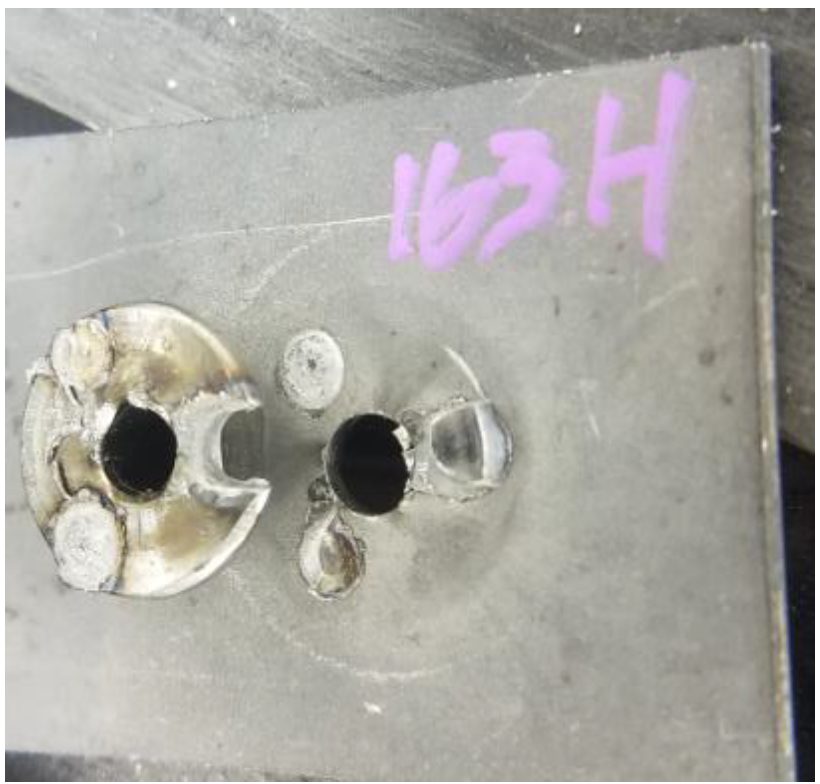
Figure 5: Method A (17.0 kA, 100 ms, 1000 lb.) Common Failure Mode.C-11
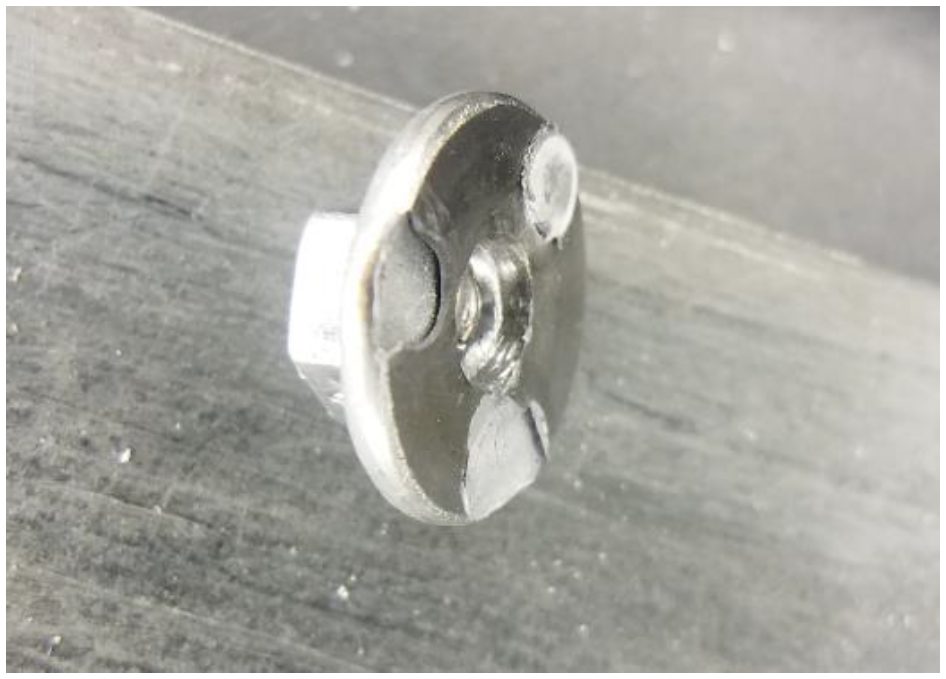
Figure 6: Method B (35.0 kA, 14 ms, 2500 lb.) Common Failure Mode.C-11
Figure 7 shows the microhardness traverse results for both Methods A and B. Method A yields a much larger HAZ. Method B shows a much smaller HAZ, less impact on the base material, and appears to be a solid state bond.
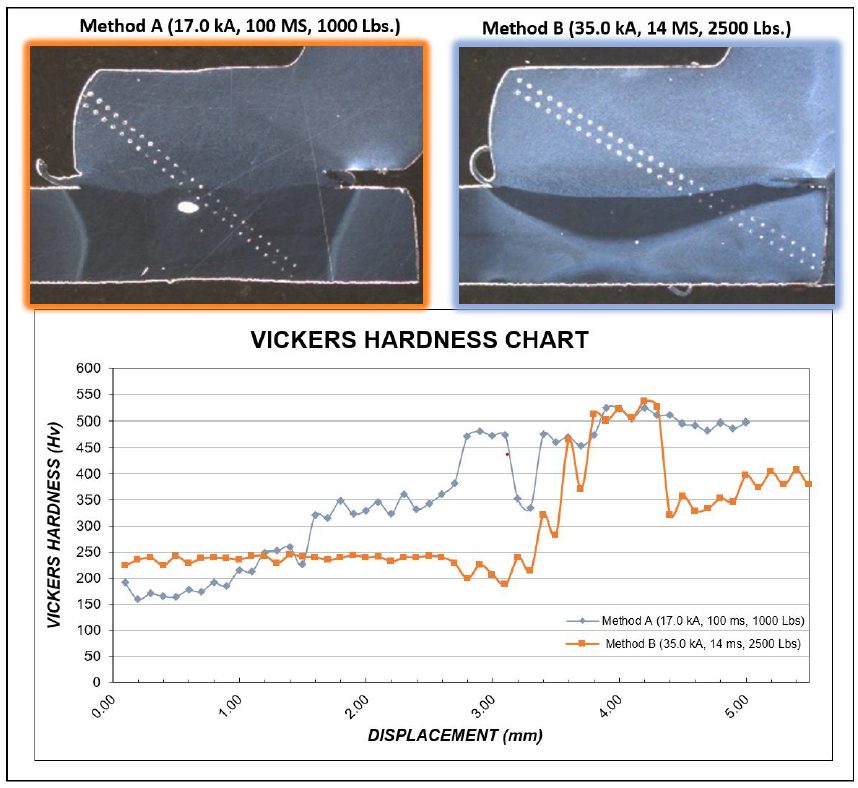
Figure 7: Microhardness Traverse.C-11
Resistance Spot Welding
This article summarizes a paper entitled, “High Strength Steel Spot Weld Strength Improvement through in situ Post Weld Heat Treatment (PWHT)”, by I. Diallo, et al.D-9
The study proposes optimal process parameters and process robustness for any new spot welding configuration. These parameters include minimum quenching time, post weld time, and post-welding current.
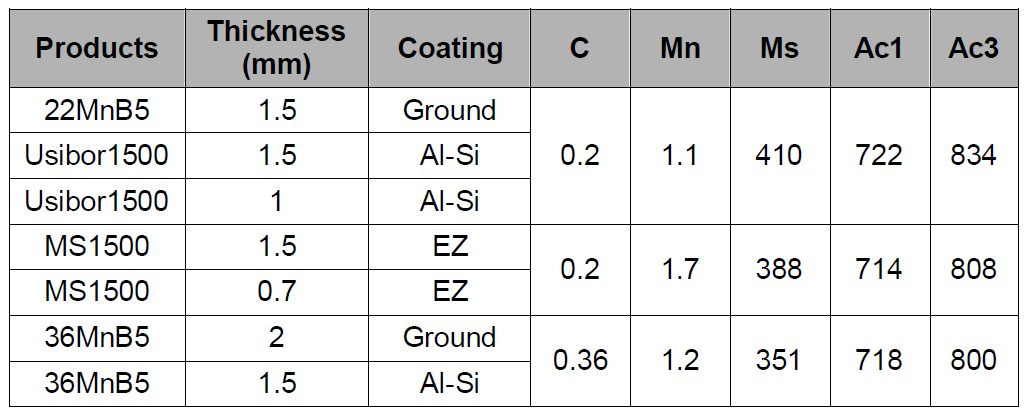
Three different chemical compositions are considered in this study and are listed in Table 1.
Table 1: Chemical composition and metallurgical data of products tested. Formulas used to calculate Ms, Ac1 and Ac3 are from “Andrews Empirical Formulae for the Calculation of Some Transformation Temperatures.”D-9
Welding configurations and process parameters are described in Table 2.
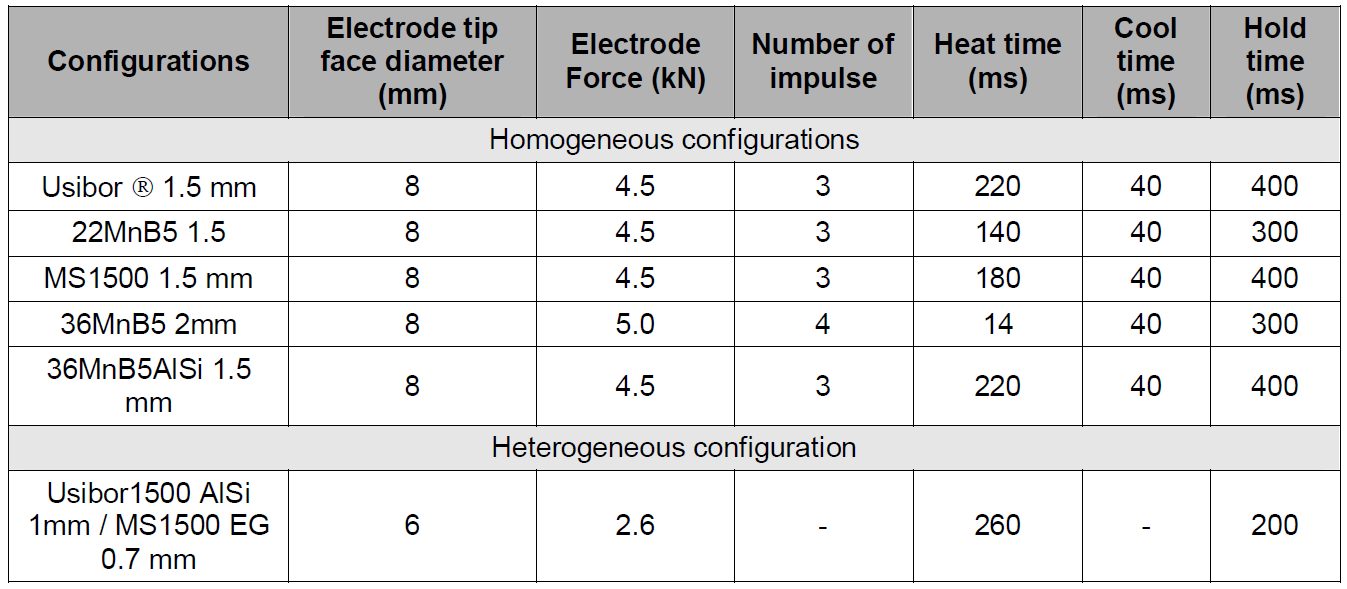
Table 2: Welded configurations and welding parameters used in reference cases.D-9
Cross Tensile Strength for MS1500EG 1.5 mm homogenous configuration is seen in Figure 1. Table 3 lists the reference data for the other configurations in this study.
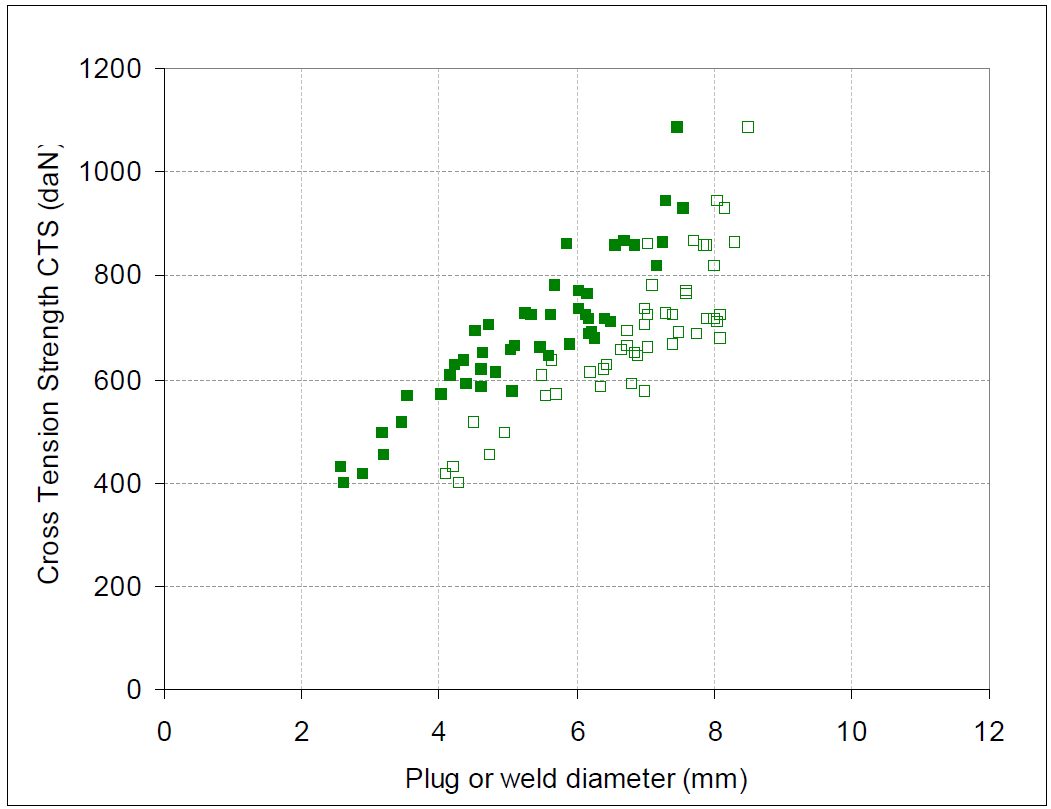
Figure 1: Cross Tensile Strength for MS1500EG 1.5 mm homogenous configuration as a function of plug (closed symbols) or weld (open symbols) diameter.D-9
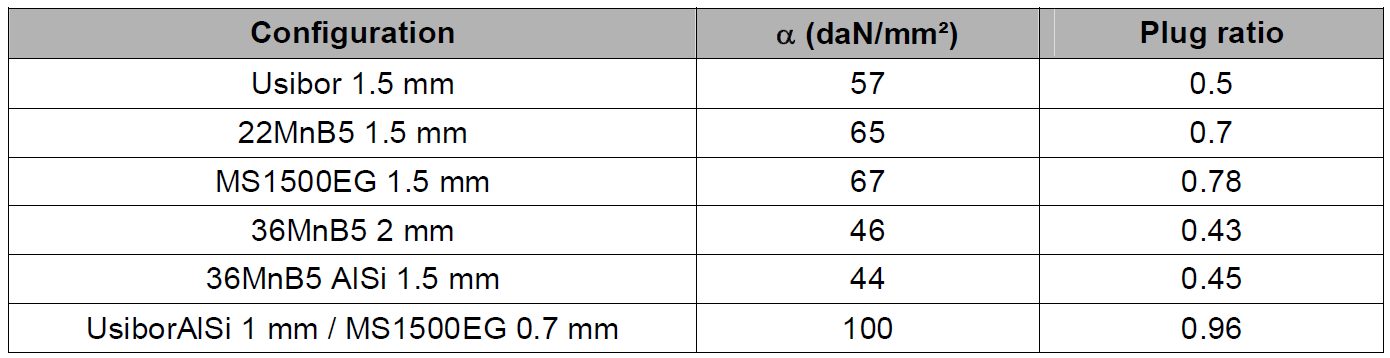
Table 3: Average α and plug ratio along the welding range for reference configurations.D-9
Figure 2 and 3 depict micrographs of welds after PWHT applied on 36MnB5 2 mm homogeneous configuration. These micrographs illustrate the evolution of the microstructure during PWHT and are labeled accordingly. Figure 4 shows the microhardness profiles in the welds described in Figure 3. It is clear that the Mf temperature was reached in the entire weld before application of PWHT.
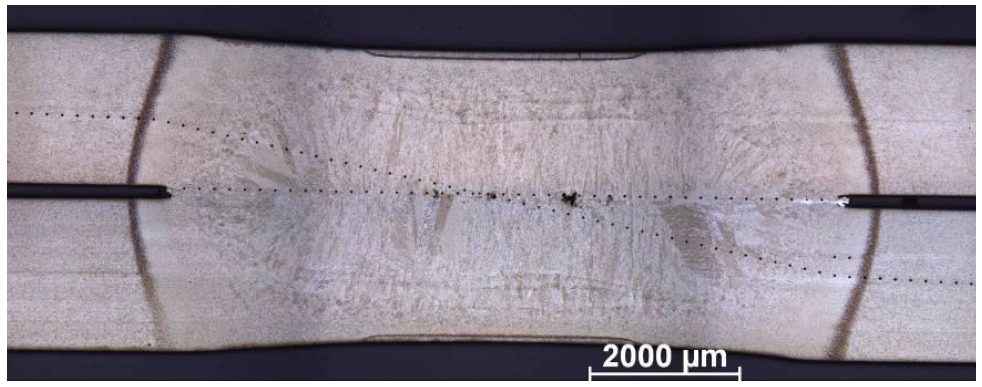
Figure 2: Micrograph of reference weld for 36MnB5 2mm homogeneous configuration.D-9
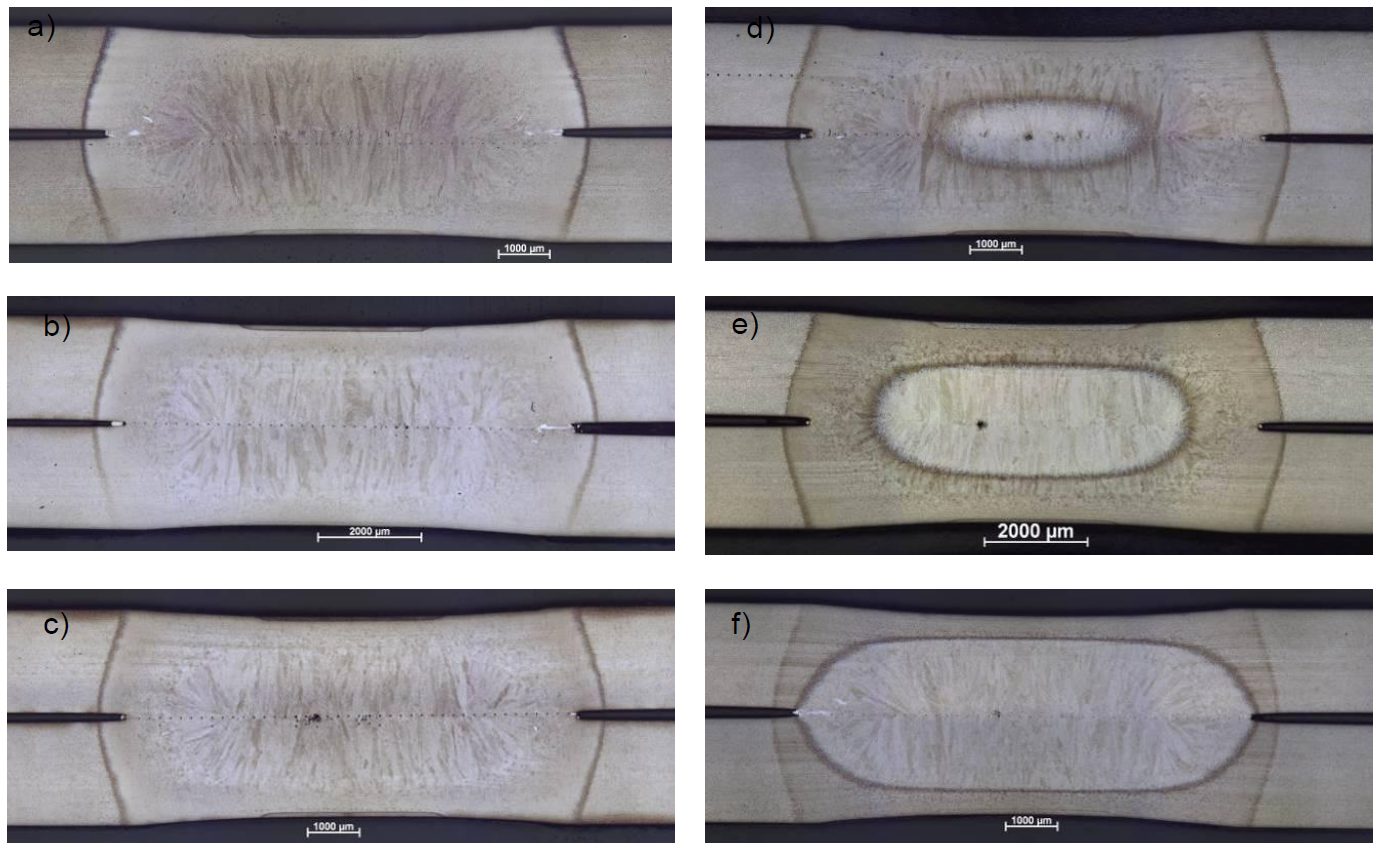
Figure 3: Micrographs of welds after post weld heat treatment applied on 36MnB5 2 mm homogeneous configuration with 70 periods of quenching and post welding current of a) 54%Iw, b) 62%Iw, c) 65% d) 67%Iw, e) 71%Iw and f ) 78%Iw.D-9
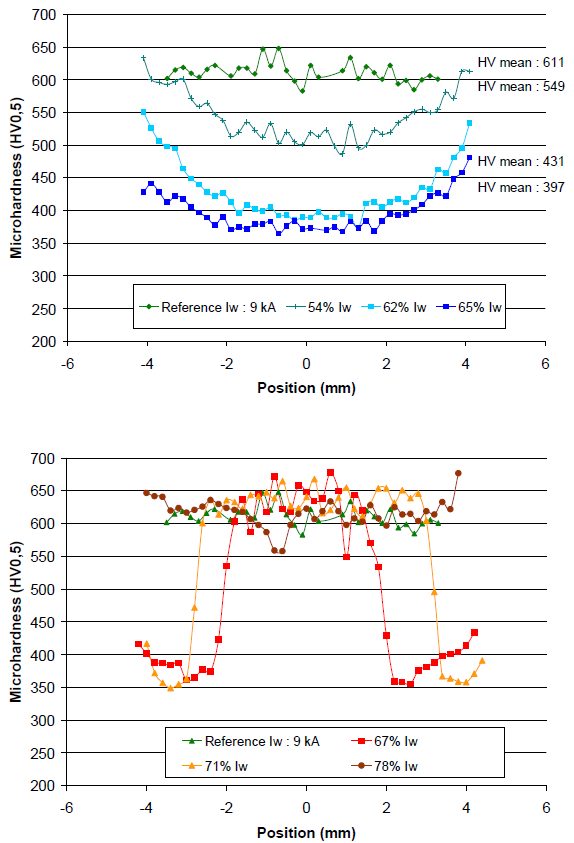
Figure 4: Microhardness profiles in welds after post weld treatment applied on 36MnB5 2mm homogeneous configuration with 70 periods of quenching ; these measurements correspond to micrographs shown in Figure 2 and Figure 3.D-9
Similar methodology was performed on partial quenching examples with AISI coating and electrogalvanized coating. Table 4 lists the minimum quenching times that were determined experimentally for each configuration.
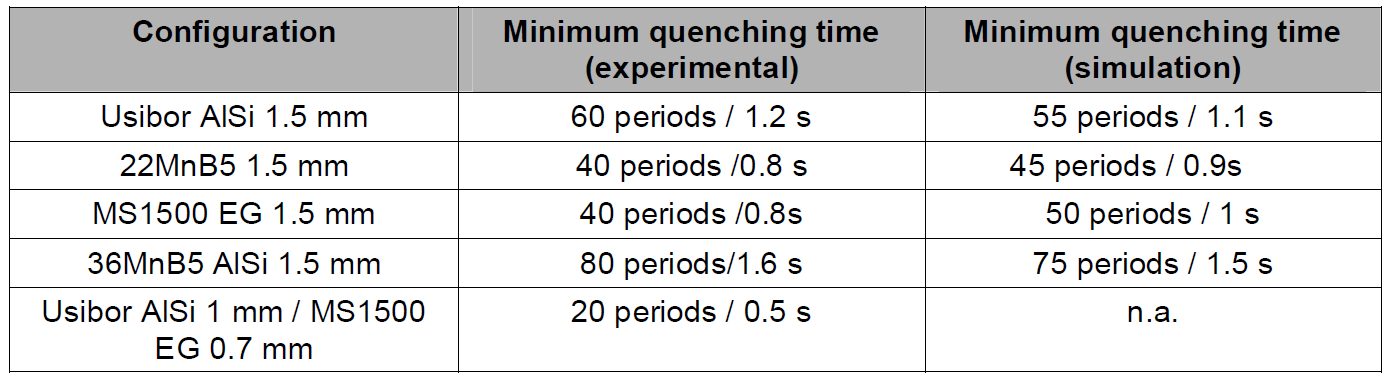
Table 4: Minimum quenching times determined experimentally and through Sorpas simulation.D-9
For selection of post weld time, a slightly different methodology was performed. Optimal quenching time was determined and used to construct the evolution of post weld current range as a function of post weld time as described in Figure 5. This figure shows that post welding current range is stable between 60 and 30 periods of post weld time.
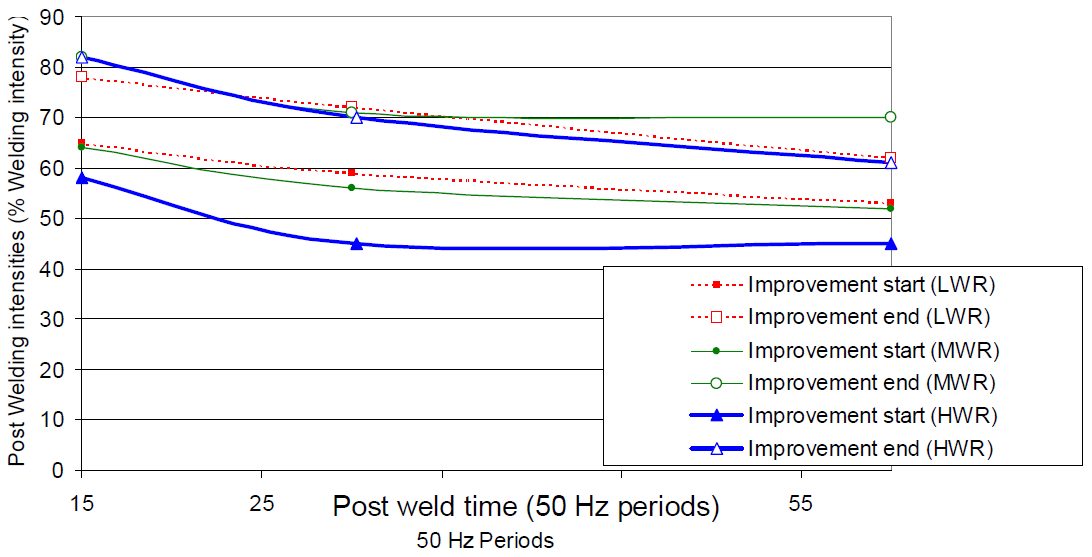
Figure 5: Evolution of post welding current range as a function of post weld time for three welding current levels.D-9
Notch tip hardness measured after different post welding currents has been reported in Figure 6. From this result, a notch tip tempering range is found to be between 400 °C and Ac1.
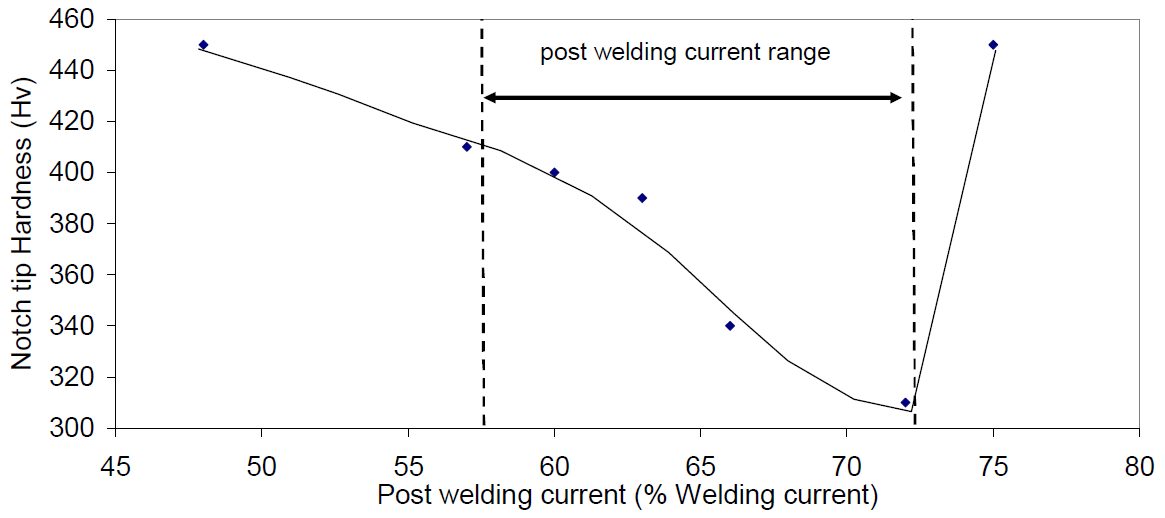
Figure 6: Relationship between measured notch tip hardness and post-welding current (Usibor1500 AlSi 1.5mm, LWR).D-9
Using the notch tip tempering range, a post welding current range can be calculated from Sorpas calculations in Figure 7.
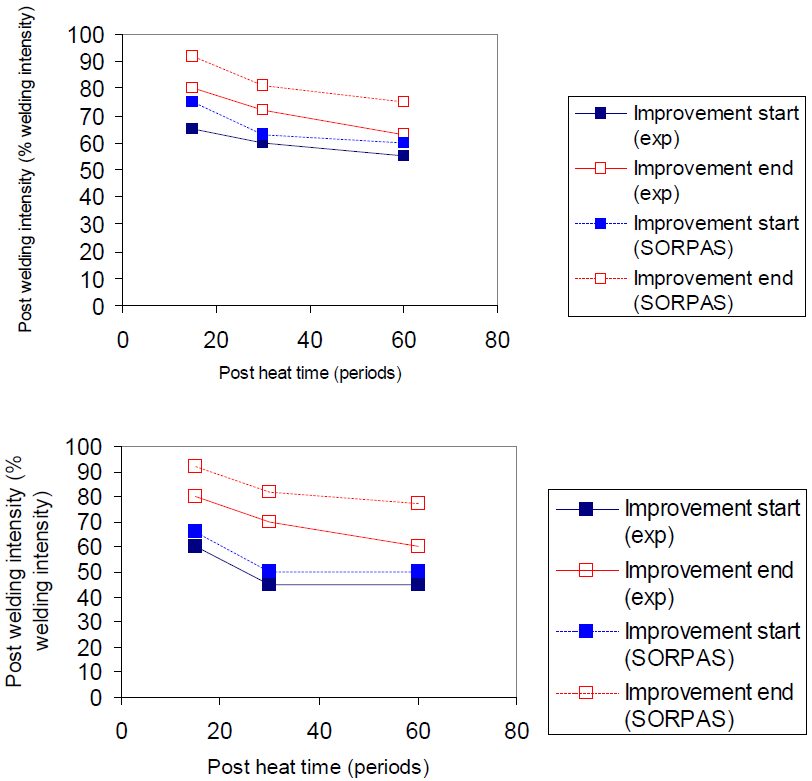
Figure 7: Experimental and numerical post welding current ranges for Usibor1500 AlSi 1.5 mm configuration (above: LWR, below: HWR).D-9
Results are displayed in Figure 8 for post weld time for MS1500 EZ with low welding current LWR.
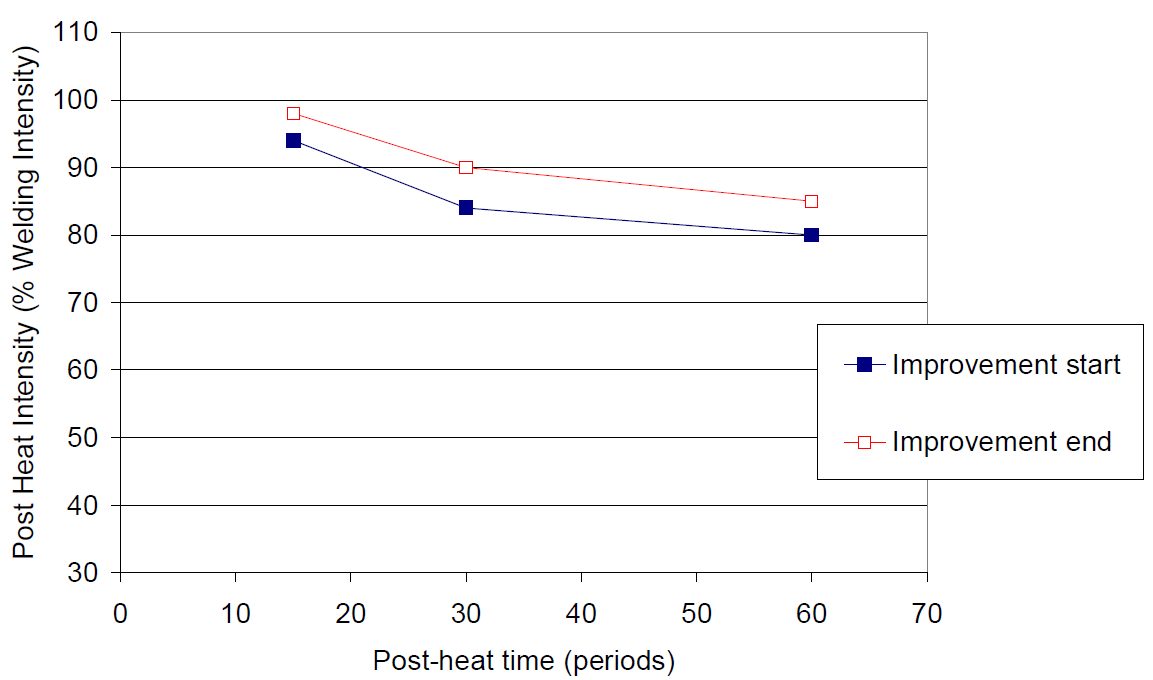
Figure 8: Evolution of post welding current ranges for different post welding times in LWR.D-9
Figure 9 displays results for MS1500 EG 1.5mm configuration.
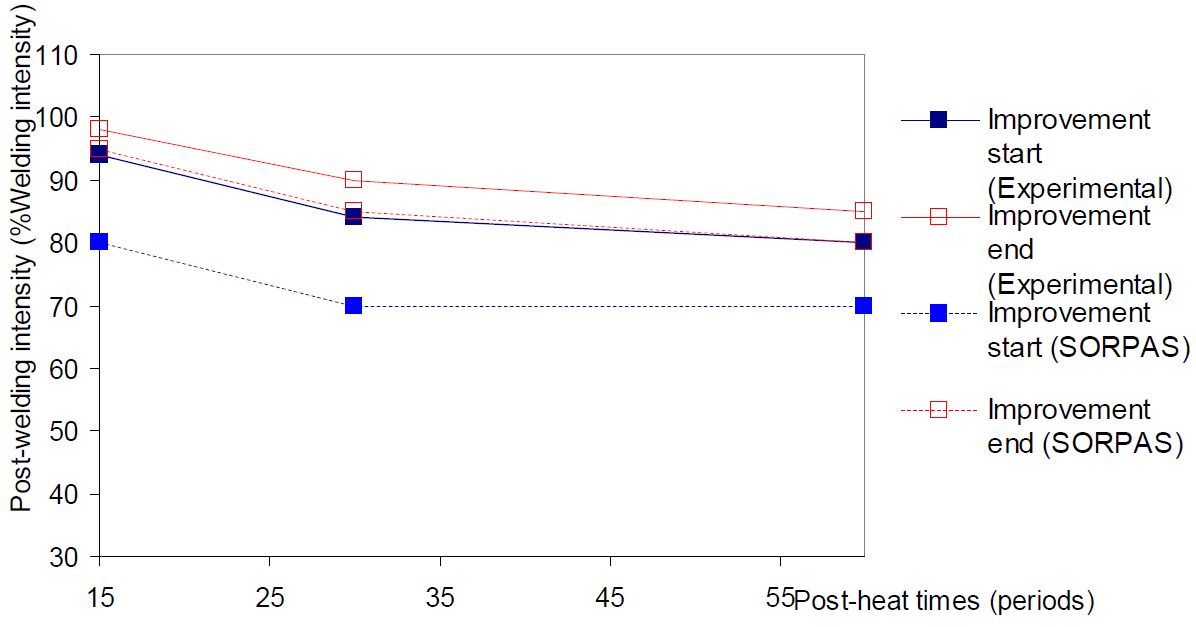
Figure 9: MS1500 EG 1.5 mm configuration experimental and simulated post welding current ranges (LWR).D-9
The same methodology was applied to other configurations and the results are displayed in Table 5.
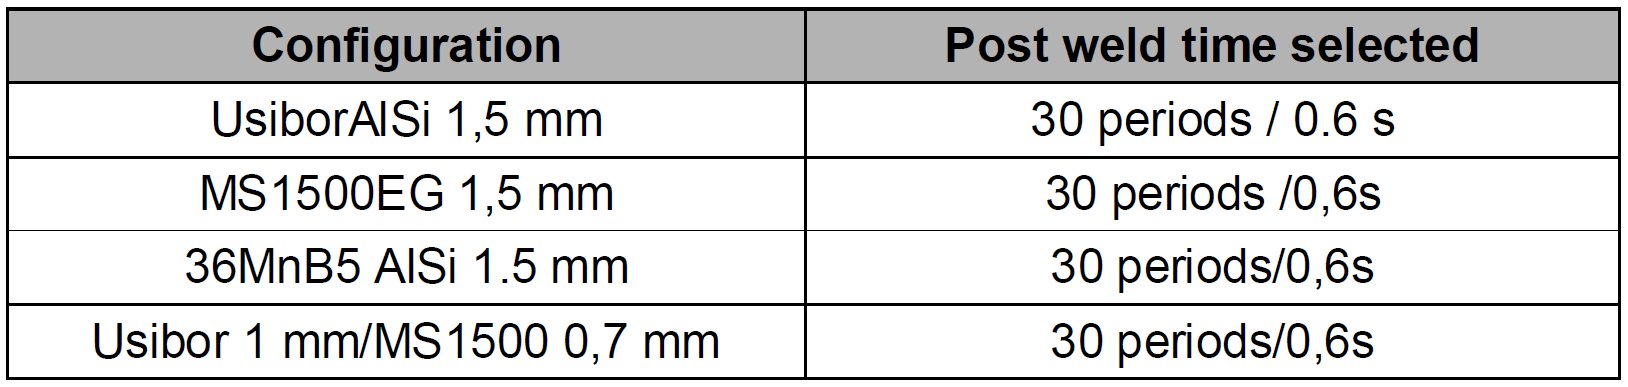
Table 5: Post weld times selected.D-9
Interpolation between experiments was carried out to create a robustness and performance tempering map that is displayed in Figure 10. The map shows tremendous improvement of cross tension strength can be achieved through PWHT. Additionally, the optimal post welding current is around 65% of welding current, and the CTS level reached for LWR and HWR without PWHT is very similar.
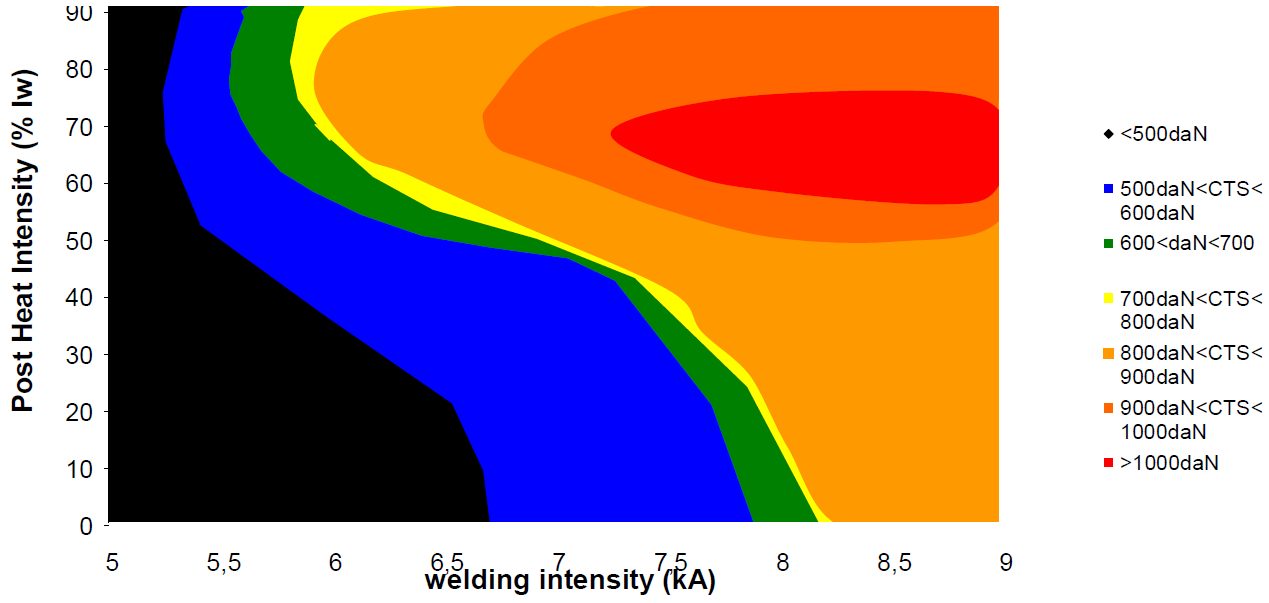
Figure 10: Tempering map for Usibor ® AlSi 1.5 mm homogeneous configuration, drawn after experimental results shown on Figure 9.D-9
Figure 11 displays cross-tension results for Usibor1500 AlSi using the optimized cycle [Metallurgical Post Weld Heat Treatment (MPWHT)].
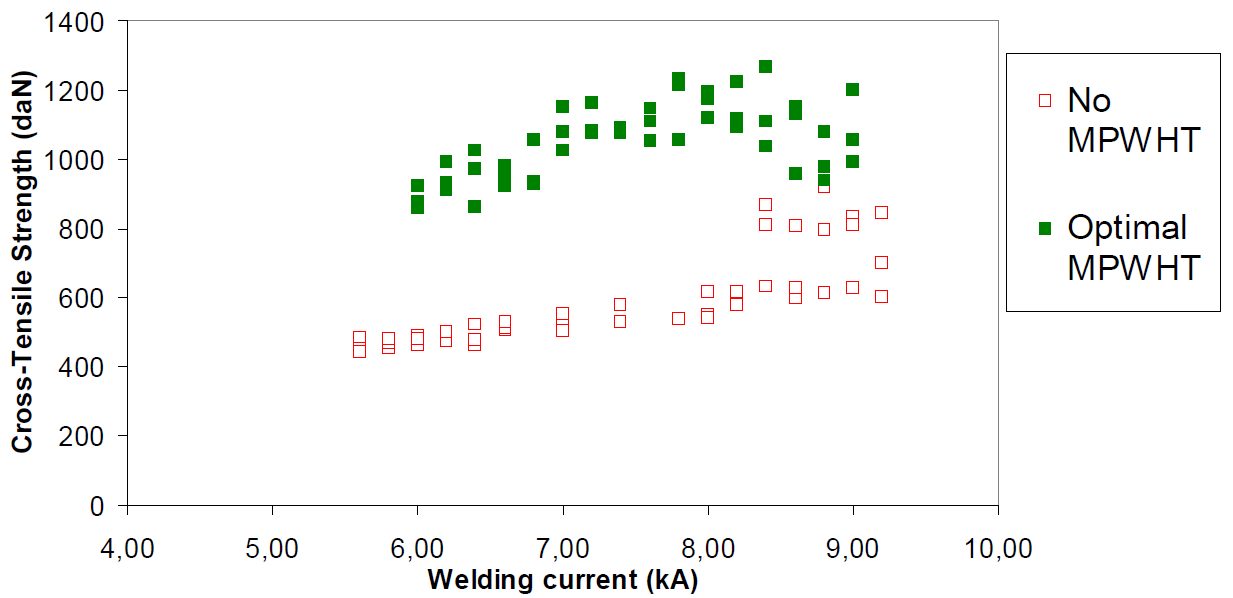
Figure 11: Comparison of CTS along the welding current range, with and without MPWHT.D-9
Table 6 and Figure 12 display all the reference and MPWHT spot weld performance after Cross-Tension testing.
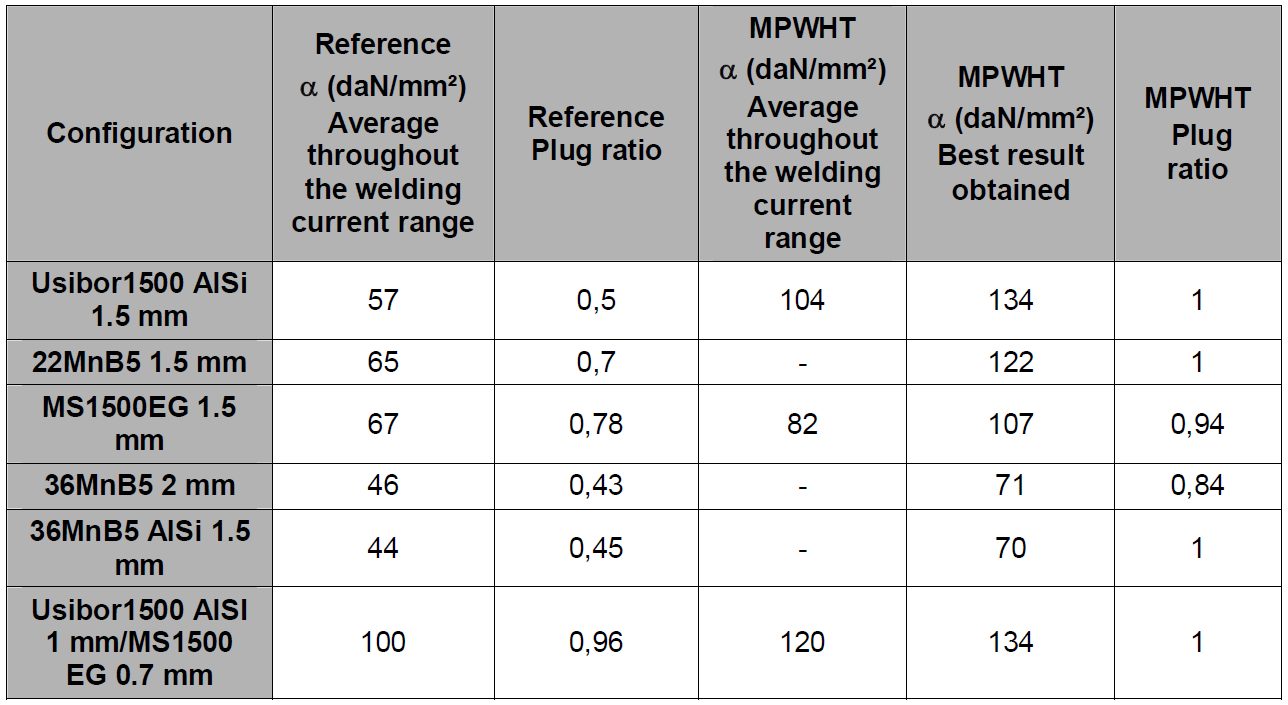
Table 6: ɑ coefficients and plug ratios for reference and with post treatment for all the configurations.D-9
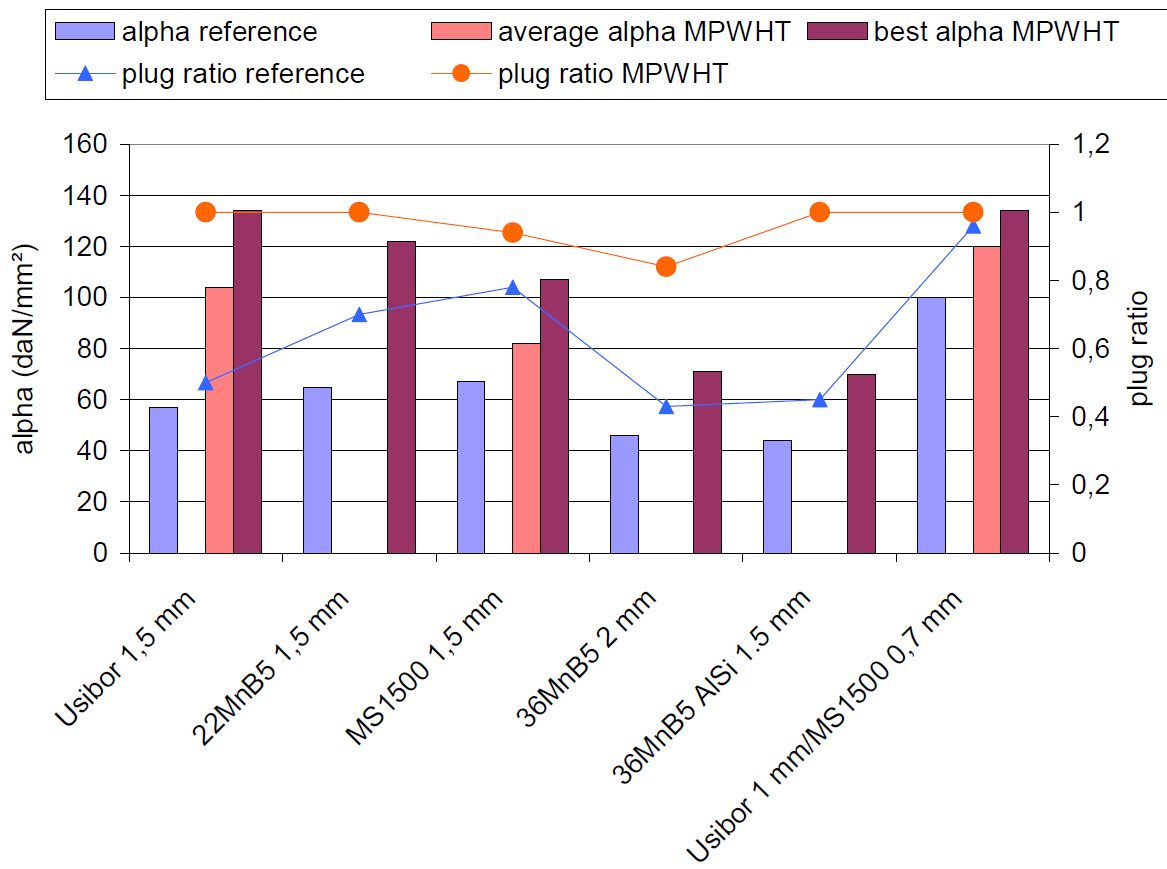
Figure 12: ɑ coefficients and plug ratios for reference and with post treatment for all the configurations.D-9
MPWHT, aiming at tempering the martensite formed during spot welding of Advanced High-Strength Steels, has been studied for several configurations both experimentally and numerically. The methodology proposed in this study is available to determine the optimal process parameters and the process robustness for any new configuration. Among the major results brought by this study:
- A minimum quenching time is necessary to fully transform the weld into martensite before post weld heat treatment; this time can be determined based on metallographic observations, and depends strongly on sheets thickness, chemistry and coating.
- The post weld time is not very sensitive to the configuration welded; 0.6 s seems a reasonable time, although it may be reduced further.
- The post welding current can be simply expressed as a percentage of the welding current, the efficient level being then constant along the welding current range.
- A range of post welding currents can be determined, allowing an efficiency of the post weld heat treatment process. Tempering maps allow common visualization of the welding current and post welding current ranges in two dimensions, to characterize the whole process robustness.
- MPWHT is very efficient in improving the mechanical weld performance in opening mode; cross-tension strength can be doubled in some cases; the process efficiency depends on the chemistry of the grades.
- In case of heterogeneous configuration, the so-called “positive deviation” can give a good performance to the weld even without MPWHT, limiting the improvement brought after post treatment.
RSW of Dissimilar Steel
This article is the summary of a paper entitled, “Weld Nugget Penetration of a Four-Sheet Resistance Spot Welding Advanced High-Strength Steels”, by K. Namola, et al.N-11
Experimental Weld Nugget Penetration
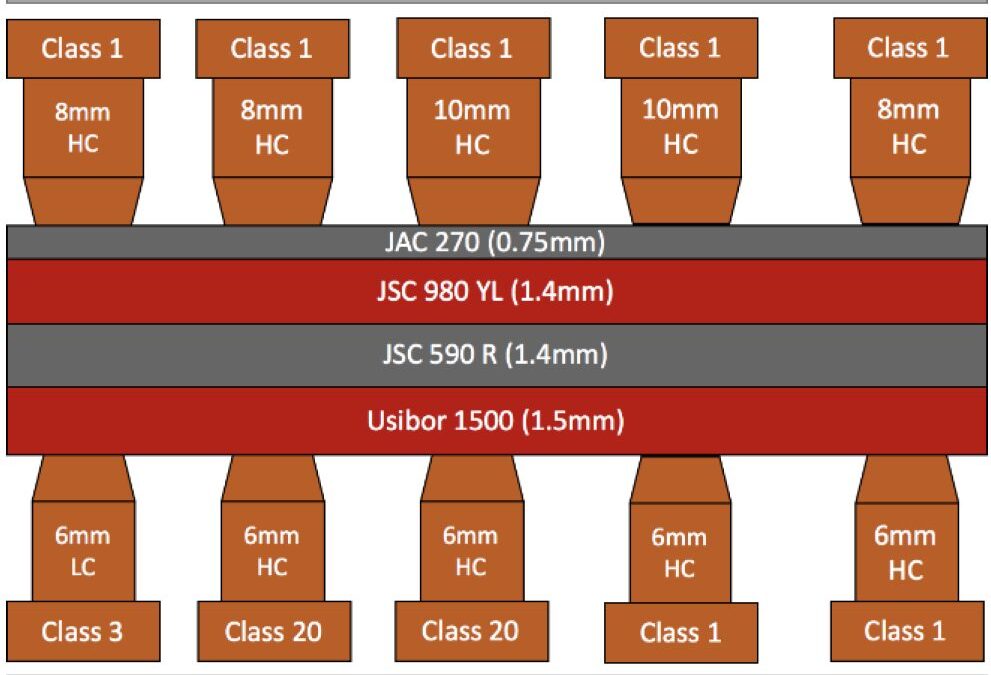
The study analyzes the effect of electrode size and composition on final weld nugget size and penetration. Nugget growth patterns were analyzed and weldability issues characterized. Figure 1 shows the arrangement of the four-layer stack-ups that were tested in this study. Truncated code electrodes used were a 6-mm Class 1, 6-mm Class 3, 6-mm Class 20, 8-mm Class 1, and 10-mm Class 1. Samples were welded in the as-received condition. JAC270 is a cold rolled Mild steel with a galvanneal coating having a minimum tensile strength of 270 MPa. JSC590 and JSC980 are bare cold rolled Dual Phase steels with a minimum tensile strength of 590 MPa and 980 MPa, respectively.
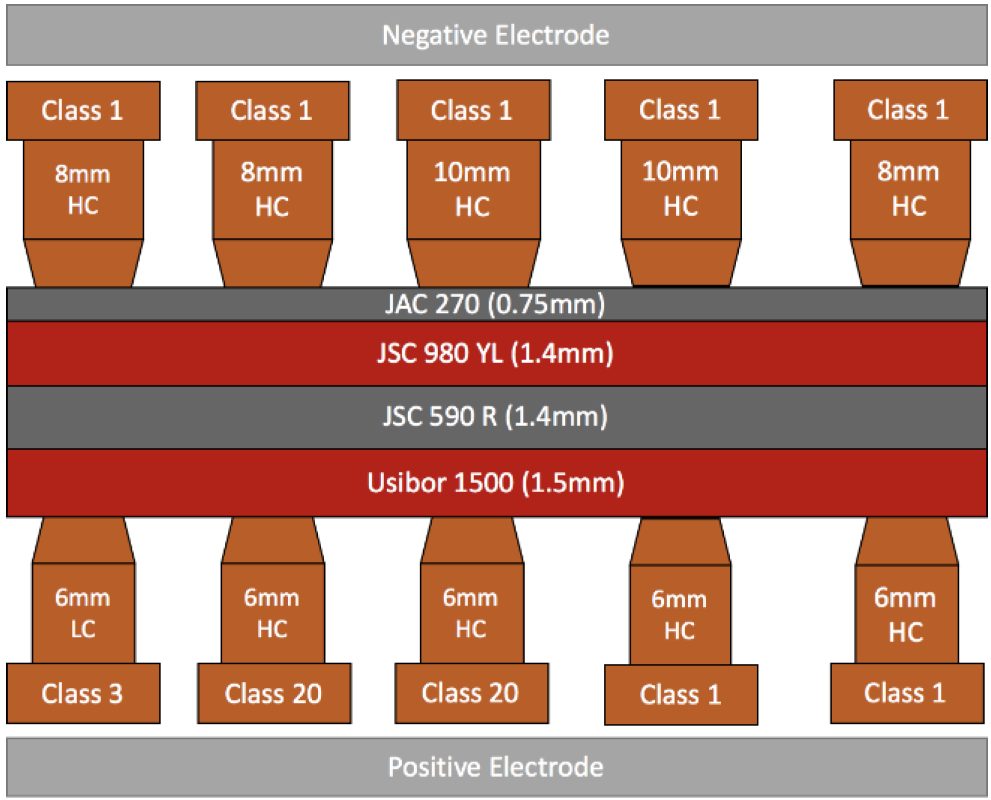
Figure 1: Resistance Welding Stack and Test Electrode Combinations.N-11
Best results from the iterative trials were obtained using an 8- and 6-mm Class 1 copper electrode with the weld schedule shown in Figure 2. This weld schedule was repeated using the electrode combinations listed in Table 1. Figure 3 shows cross sections of each weld listed in Table 1.
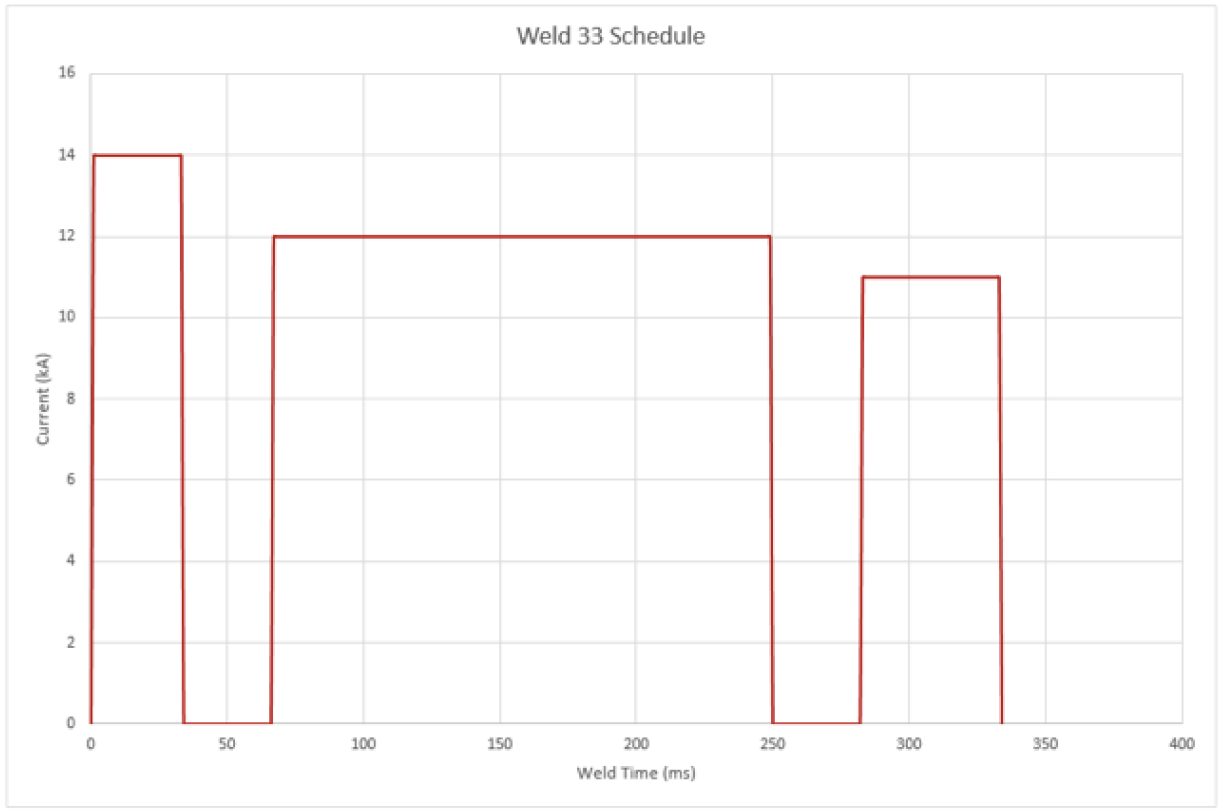
Figure 2: Down-Selected Weld Schedule from Trials.N-11
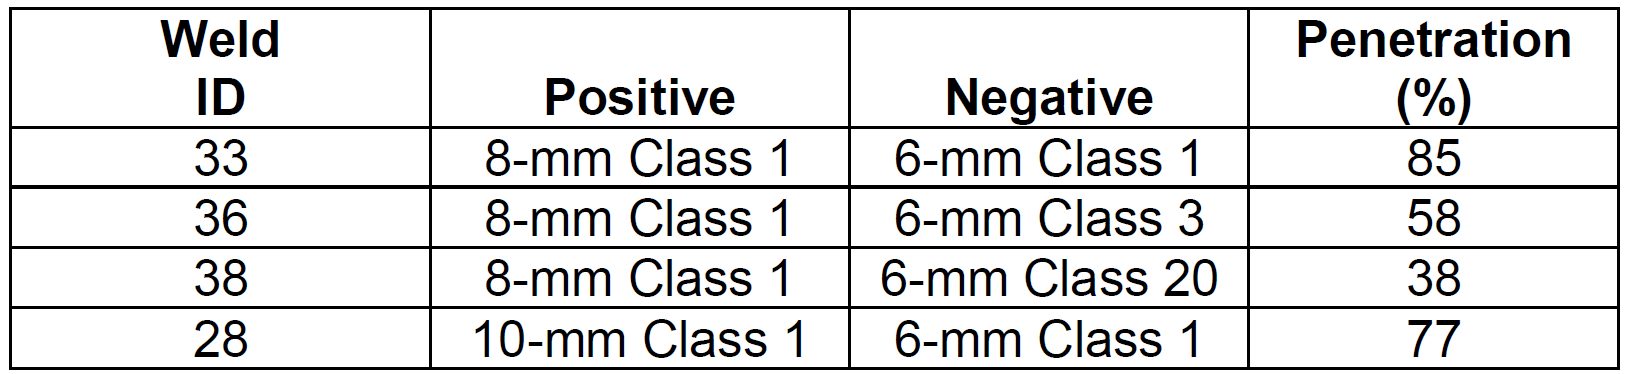
Table 1: Nugget Penetration Using the Down-Selected Weld Schedule from Trials and Different.N-11
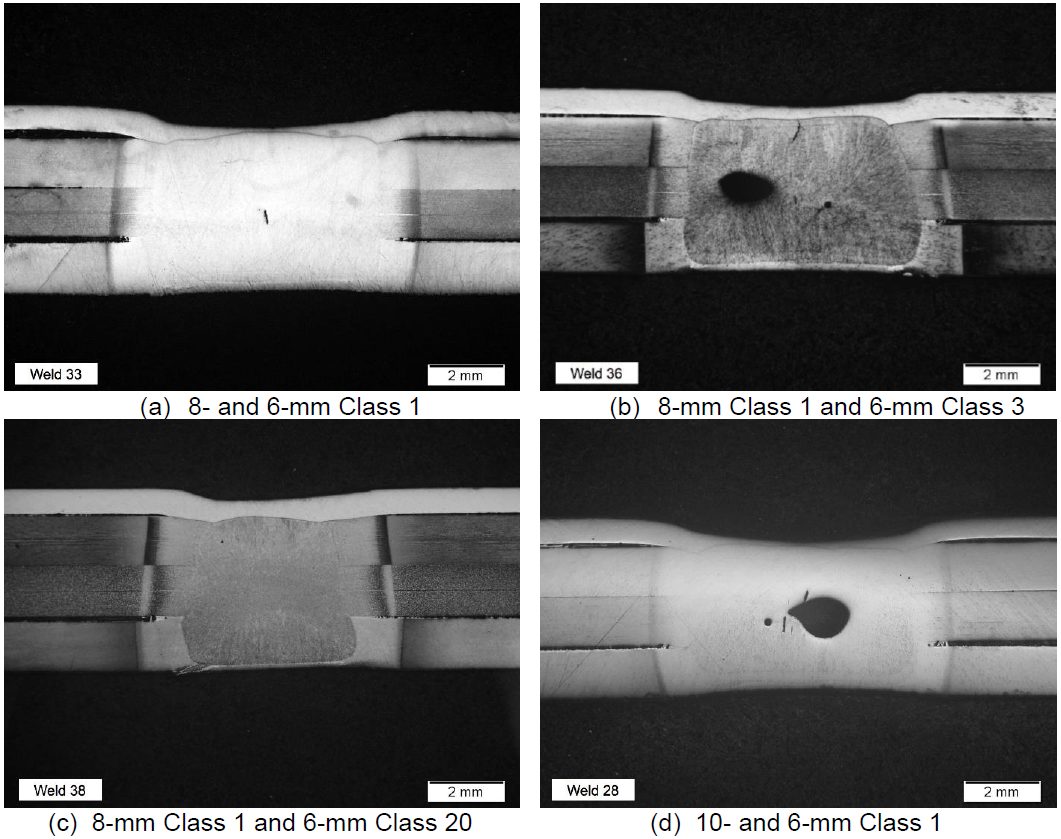
Figure 3: Welds Made Using the Down-Selected Schedule and Different Electrodes.N-11
Figure 4 shows cross sections of five welds made starting with new 8- and 6-mm Class 1 electrodes. As can be seen, expulsion gets progressively worse over time but penetration does not. Penetration values into the JAC 270 were determined by metallography and are shown in Table 2.
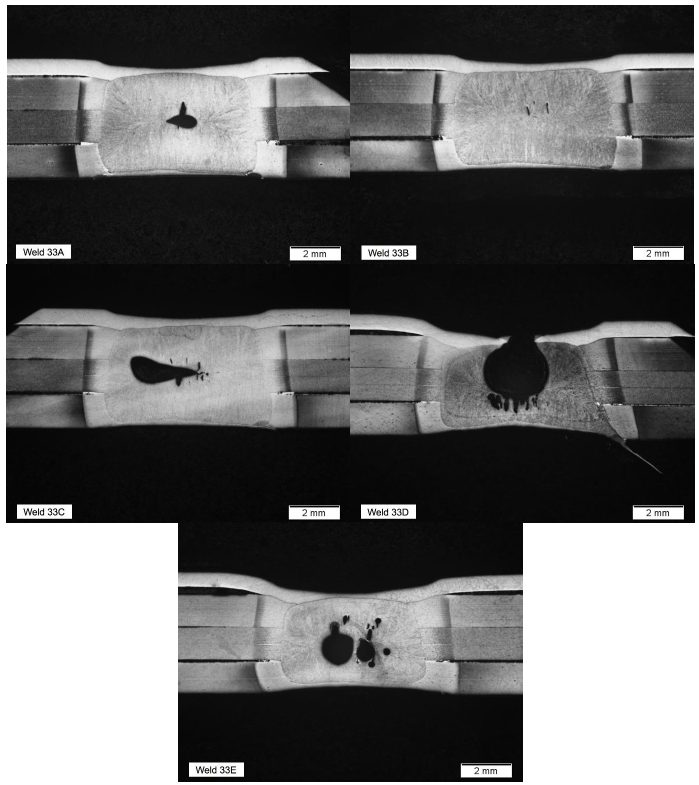
Figure 4: Welds from Repeatability Study Using the Down-Selected Weld Schedule and 8- and 6-mm Class 1 Electrodes.N-11
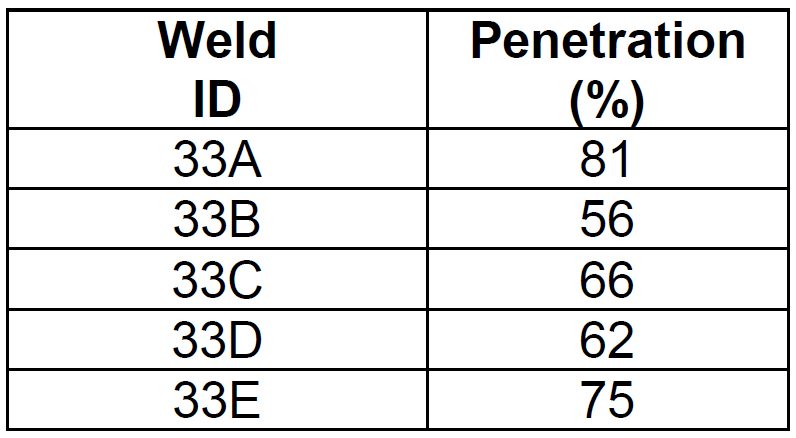
Table 2: Nugget Penetration into the JAC 270 During Repeatability Study.N-11
Table 3 lists the resistance measurements at the weld stack interfaces. Figure 5 shows the resistance graph of weld stack up.
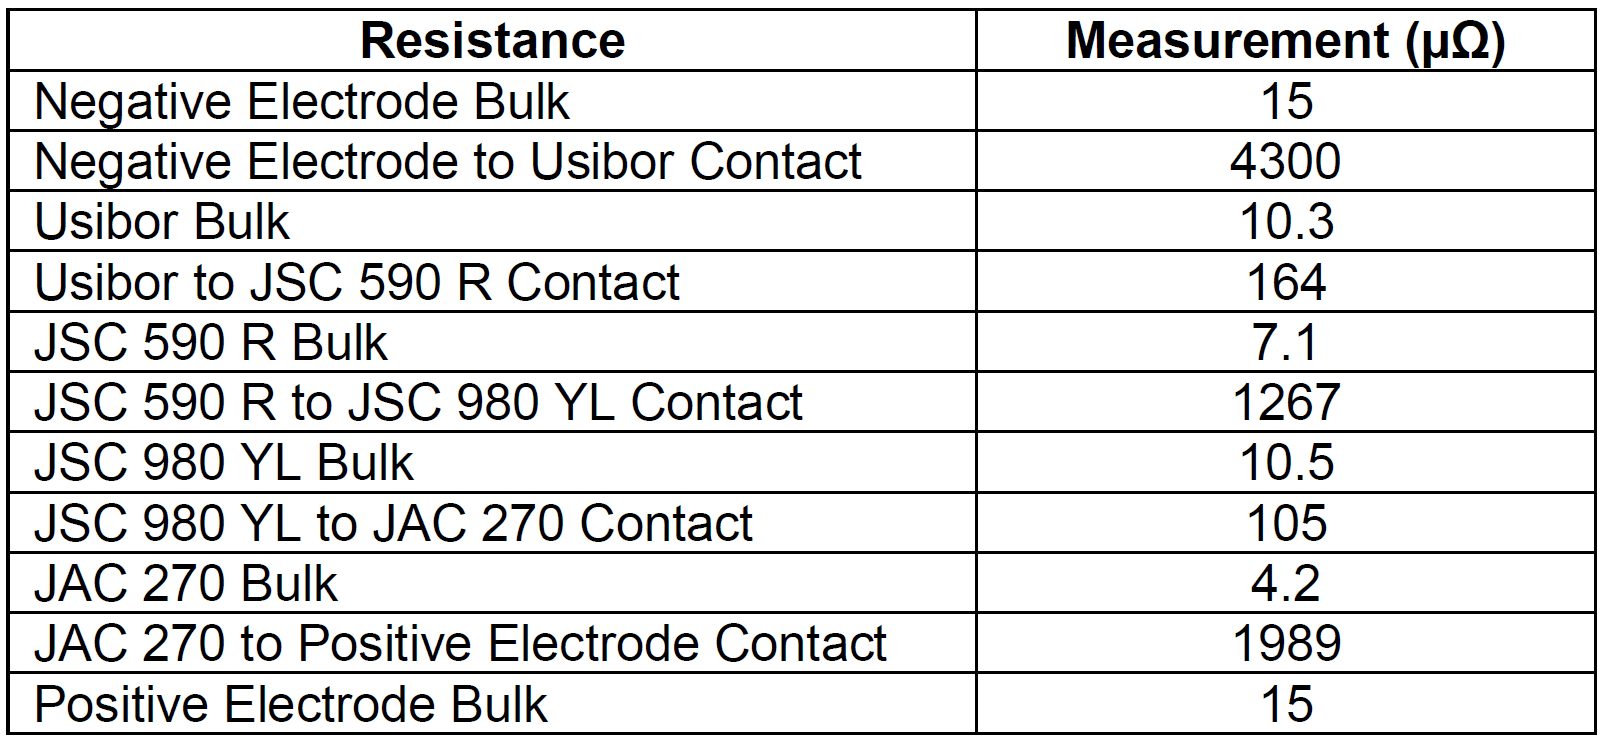
Table 3: Resistance Measurements of Weld Materials and Weld Stack Interfaces.N-11
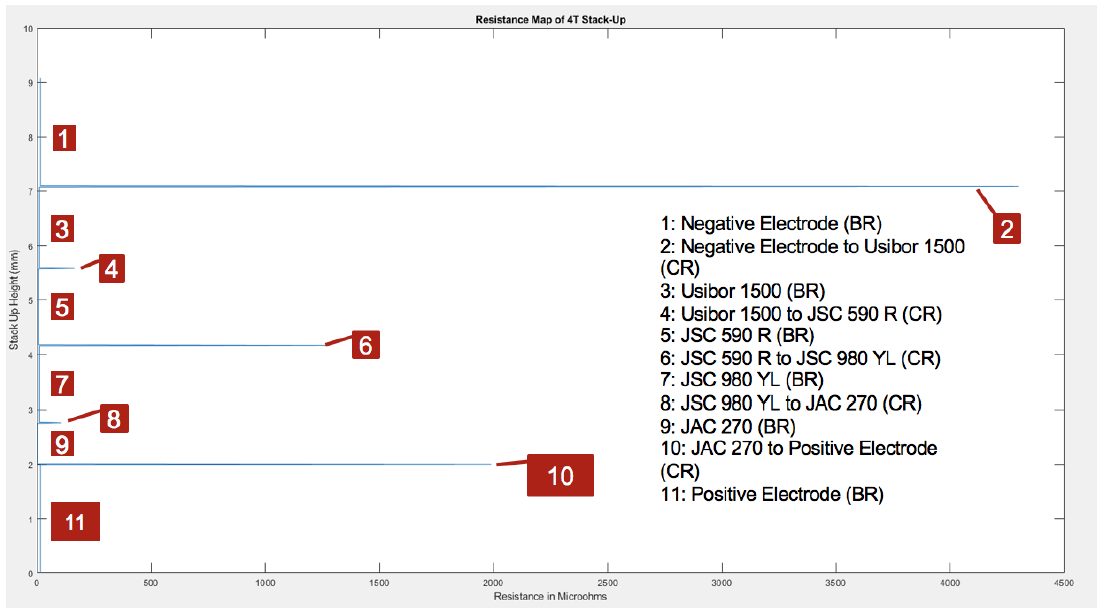
Figure 5: Resistance Graph of Weld Stack-Up.N-11
The weld force used was 2.3 kN and the current reduction values are listed in Table 4. Figure 6 and Figure 7 show the still images at each pulse. The heating pattern implies that the JAC270 is forged into the weld nugget.
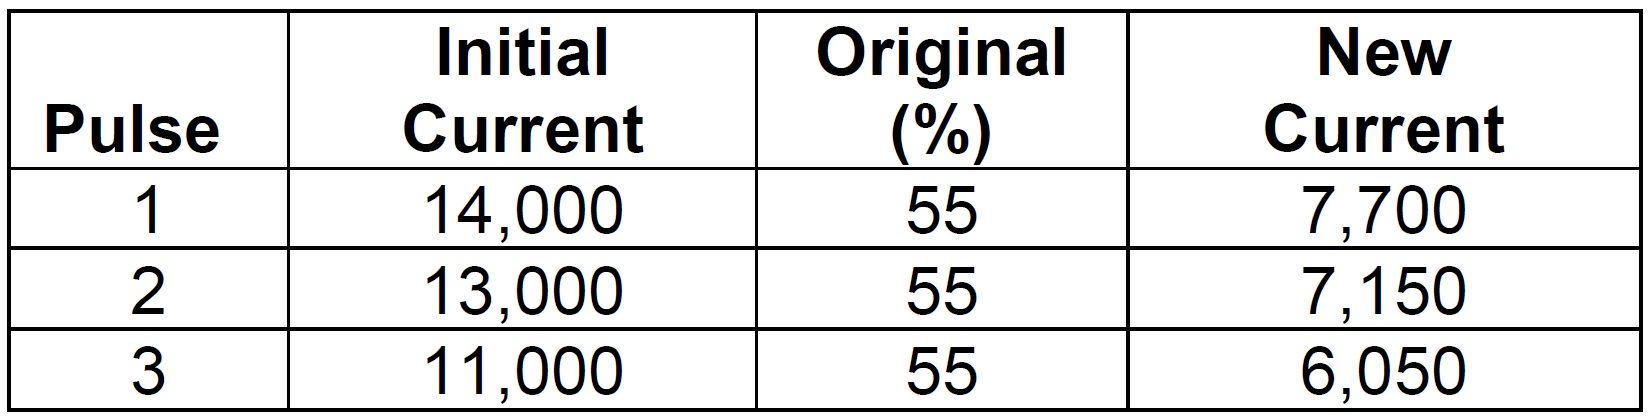
Table 4: Current Reduction for High-Speed Video Welds.N-11
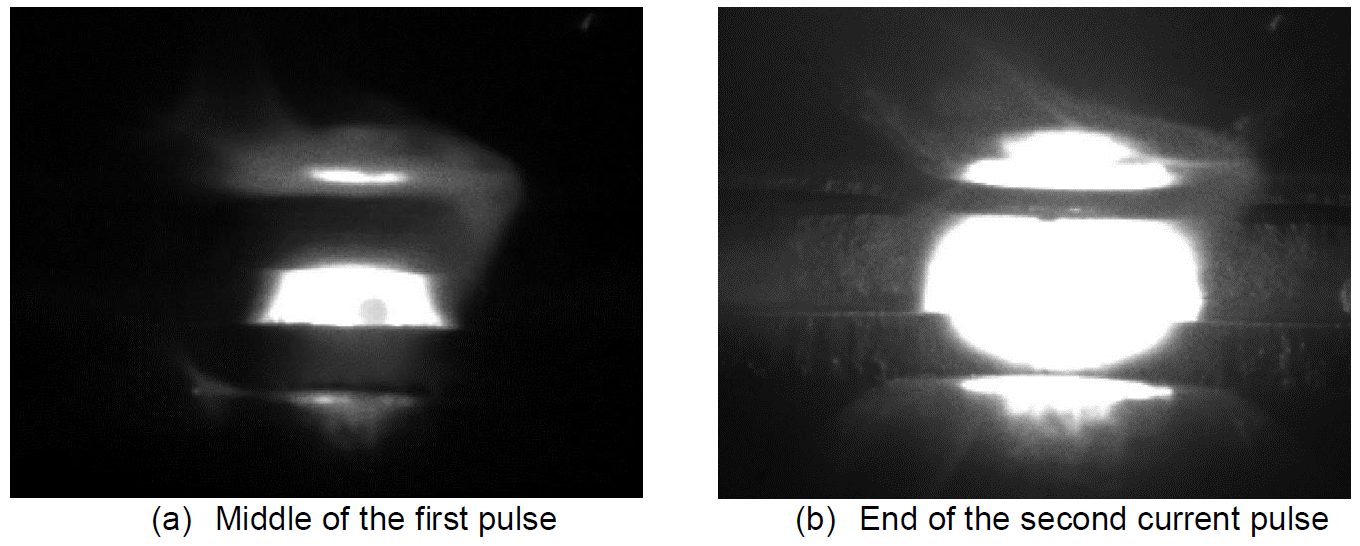
Figure 6: Still Images from High-Speed Video.N-11
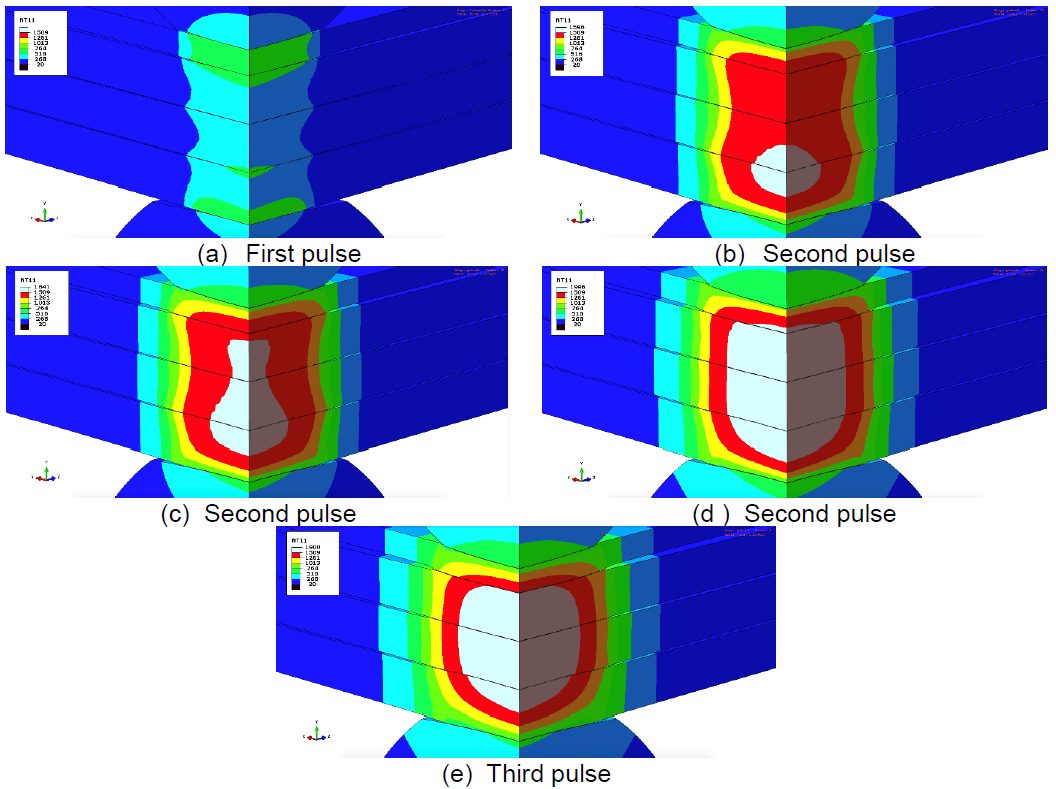
Figure 7: Still Images from Weld Simulation of the Down-Selected Schedule using 8- and 6-mm Class 1 Electrodes.L-58
Press Hardened Steels, Solid State Welding
This article summarizes a paper, entitled “Effect of GA-Coating Evolution during Press-Hardening on Fiber Laser Lap Welding Behavior of 22MnB5 Steel”, by M. H. Razmpoosh, et al.R-4
The study investigates the effects of Fe-Zn diffusion layer on laser lap-joining behavior of galvanneal (GA) coated 22MnB5 steel, an Advanced High-Strength Steel designed for the hot forming process. The results indicate that by using higher press-hardening durations, the weld window shrinks; however, this results in a wider weld bead, and therefore promotes the load-bearing capacity of the joint.
Press-hardened 22MnB5, 2mm sheet steels were used in the present study. The details of the chemical composition and the as-received mechanical properties of the sheets are given in Table 1. The steel sheets were GA-coated with two different initial total coating weights of 100 and 140 g/m2 (Table 2).

Table 1: Chemical Composition (wt.%) and Mechanical Properties of the Experimental PHS.
.
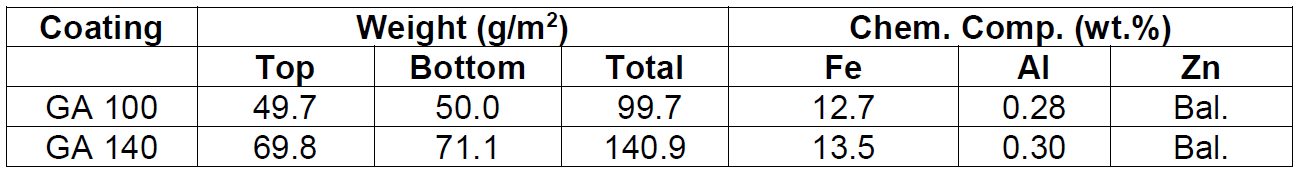
Table 2: Weight and Chemical Composition of Various GA Coatings used in the Present Study.
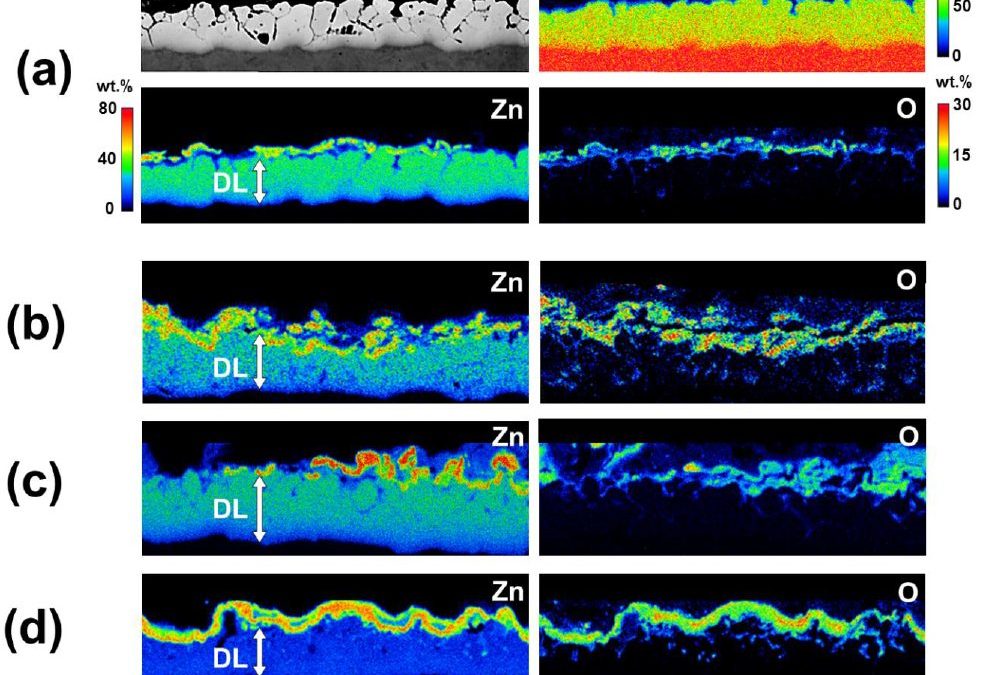
Figure 1 demonstrates backscattered scanning electron microscopy (BS-SEM) and Electron probe microanalysis (EPMA) elemental distribution of a representative Fe-Zn DL after press-hardening at 860°C for 4-10 min and corresponding 900°C for 10 min. It has been observed that by increasing the press-hardening time the Zn-content decreases; however, at higher press-hardening temperatures (i.e., 900°C) due to extreme oxidation, the average Zn-content decreases severely.
![Figure 1. BS-SEM and EPMA Results of the Press-Hardened Blanks at 860°C [(a) 4 min, (b) 7 min, (c) 10 min, and (d) 900°C for 10 min (DL)].](https://ahssinsights.org/wp-content/uploads/2020/07/3112_Fig1.jpg)
Figure 1. BS-SEM and EPMA Results of the Press-Hardened Blanks at 860°C [(a) 4 min, (b) 7 min, (c) 10 min, and (d) 900°C for 10 min (DL)].
Figure 2 summarizes the effects of press-hardening time and temperature on the thickness of the Fe-Zn DL in two different initial coating weights of 100 and 140 g/m2. With increasing the heat-treatment time at 860°C, the thickness of overall Fe-Zn DL increases. However, specifically at 900°C and longer press-hardening times, the final Fe-Zn DL is not increasing. Moreover, it has been observed that at a constant press-hardening time-temperature, lower initial coating weight results in a lower final Fe-Zn DL thickness.
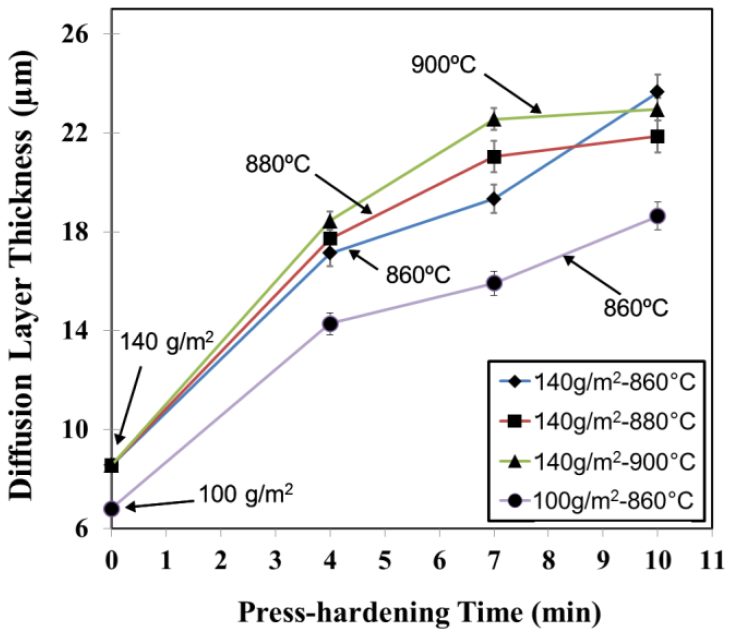
Figure 2: DL Thickness vs. Press-Hardening Times at the Experimental Temperature and Initial Coating Weights.
According to Figure 3(a), increasing the press-hardening time at a constant temperature results in wider weld beads. Hence, the fact that failure occurs within the FZ (faying surface) during lap-shear tensile tests justifies the slightly enhanced peak loads [Figure 3(b)].
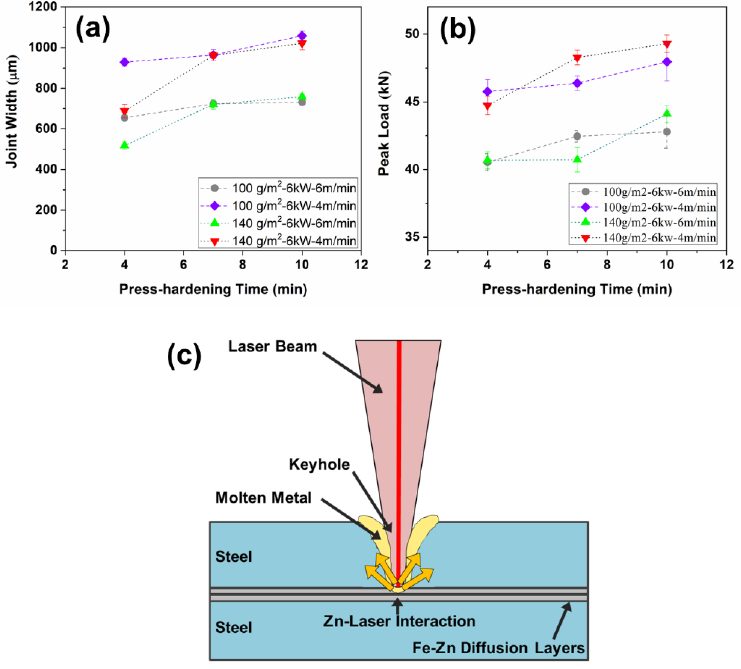
Figure 3: (a) Joint Width, (b) Peak Load of Lap-Shear Tensile Test vs. Press-Hardening Time, and (c) Schematic of Fe-Zn DL and Laser Interaction.
This work concluded the following:
- The initial GA-coating mainly evolves into a Fe-Zn DL [α-Fe(Zn)] and ZnO after the press-hardening. The thick α-Fe(Zn) phase holding 20-40% Zn; however, it was observed that with increasing press-hardening temperature, due to severity of oxidation Zn-content of the Fe-Zn DL decreases.
- Due to higher oxidation, severity at higher press-hardening temperatures, and subsequent lower Zn-content, the sensitivity of the process window is less than 860°C.
- Because of intensified Zn-plasma and laser beam interaction, by increasing the press hardening time at a constant temperature of 860°C (higher Fe-Zn DL thickness), joint width increases. This explains higher lap-shear tensile peak loads associated with the higher press-hardening times.