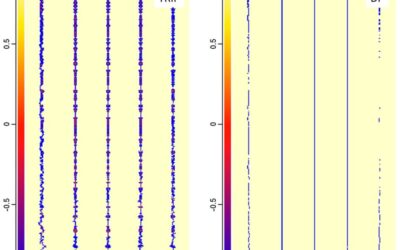
Hot cracking investigation in HSS laser welding with multi-scale modelling approach
This article summarizes the findings of a paper entitled, “Hot cracking investigation during laser welding of high-strength steels with multi-scale modelling approach”, by H. Gao, G. Agarwal, M. Amirthalingam, M. J. M. Hermans.G-4
Researchers at Delft University of Technology (TU Delft) in The Netherlands and Indian Institute of Technology Madras in India attempted to model Hot Cracking susceptibility in TRIP and DP steels. For this experiment, TRIP and DP steels are laser welded and the temperatures experienced are recorded with thermocouples at three positions. Temperatures experienced during welding are measured and used to validate a finite element model which is then used to extract the thermal gradient and cooling rate to be used as boundary conditions in a phase field model. The phase field model is used to simulate microstructural evolution during welding and specifically during solidification. The simulation and experimental data had good agreement with max temperature deviation below 4%.
Summary
Referencing Figure 1 (Figure 6 in the original paper) which shows the microstructure where the dendritic tips meet the wel, centerline, it is observed that TRIP steels reach a solid fraction of 93.7% and DP steels reach a solid fraction of 96.3% meaning that TRIP steels have a larger solidification range than the DP steels. Figure 8 shows the phosphorus distribution where the dendritic tips reach the weld centerline. TRIP steels show a concentration of up to 0.55 wt-% where segregation occurs compared to the original composition of 0.089 wt-%. DP steels show a max of 0.06 wt-% which is significantly lower than the TRIP steels. In addition to phosphorus, Al is seen in high concentration in TRIP steels which contributes to the broder solidification range. A pressure drop is the last factor contributing to the Hot Cracking observed in TRIP steels(figure 2). The pressure drop is due to a lack of extra liquid feeding in the channels and forms a pressure difference from the dendrite tip to root. The pressure drop in TRIP steels is calculates to 941.2 kPa and 10.2 kPa in DP steels. The combination of element segregation, pressure drop, and thermal tensile stresses induced during laser welding results in a higher Hot Cracking susceptibility in TRIP steels as compared to DP steels.

Figure 1: Phase distributions in the TRIP and the DP steel when the dendritic tips reach the weld centreline.G-4
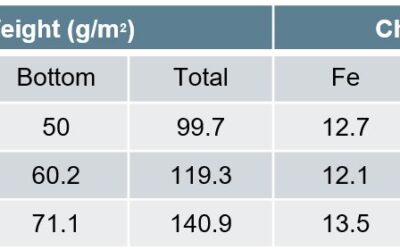
Effect of GA Coating Weight on PHS
This studyR-25, conducted by the Centre for Advanced Materials Joining, Department of Mechanical & Mechatronics Engineering, University of Waterloo, and ArcelorMittal Global Research, utilized 2mm thick 22MnB5 steel with three different coating thicknesses, given in Table 1. The fiber laser welder used 0.3mm core diameter, 0.6mm spot size, and 200mm beam focal length. The trials were done with a 25° head angle with no shielding gas but high pressure air was applied to protect optics. Welding passes were performed using 3-6kW power increasing by 1 kW and 8-22m/min welding speed increasing by 4m/min. Compared to the base metal composition of mostly ferrite with colonies of pearlite, laser welding created complete martensitic composition in the FZ and fully austenized HAZ while the ICHAZ contained martensite in the intergranular regions where austenization occurred.

Table 1: Galvanneal Coatings.R-25

Figure 1: Base metal microstructure(P=pearlite, F=ferrite, Γ=Fe3Zn10, Γ1=Fe5Zn21 and δ=FeZn10).R-25

Figure 2: Welded microstructure — (a) overall view, (b) HAZ, (c) ICHAZ at low and (d) high magnifications, (e) UCHAZ (f) FZ, and (g) coarse-lath martensitic structure (where M; martensite, P: pearlite, F: ferrite).R-25
Given the lower boiling temperature of Zn at 900 °C as compared to Fe, the interaction of the laser with the Zn plasma that forms upon welding affects energy deliverance and depth of penetration. Lower coating weight of (100 g/m2) resulted in a larger process window as compared to (140 g/m2). Increased coating weight will reduce process window and need higher power and lower speeds in order to achieved proper penetration as shown in Figure 3 and Figure 4. Depth of penetration due to varying welding parameters was developed:
d=(H-8.6+0.08C)/(0.09C-4.8)
[d= depth of penetration(mm), H= heat input per unit thickness(J/mm2), C= coating weight(g/m2)]
Given the reduction in power deliverance, with an increase in coating weight there will be an expected drop in FZ and HAZ width. Regardless of the coating thickness, the HAZ maintained its hardness between BM and FZ. No direct correlation between coating thickness and YS, UTS, and elongation to fracture levels were observed. This is mainly due to the failure location being in the BM.

Figure 3: Process map of the welding window at coating weight of (a) 100 g/m2, (b) 120 g/m2, and (c) 140 g/m2.R-25

Figure 4: Heat input per unit thickness vs depth of penetration.R-25
Microstructural Evolution and Effect on Joint Strength in Laser Welding of DP to Aluminium
Given the use of many different metals in the Body in White construction, it is important to understand the effects of dissimilar welding AHSS. Researchers at Indian Institute of Technology Madras in Chennai, India and Centre of Laser Processing of Materials in Hyderabad, India developed tests to study the resulting microstructure from laser welding 2.5 mm thick DP600 steel to 3 mm thick AA6061 aluminium alloy using a laser beam diameter of 1.5 mm.I-1 They discovered a softening in the steel HAZ due to a tempering effect and an increase in hardness in the aluminum HAZ due to the presence of aluminium intermetallic phases present. Maximum shear strength was observed when the thickness of intermetallics was reduced to 8-11 microns. They concluded that best quality welds were made under power densities and interaction times of 1.98kW/mm2, 0.15s and 2.26 kW/mm2, 0.187s.
The laser power was varied from 3 kW to 4.5 kW and the scanning speed of 8 mm/s, 10 mm/s, and 12 mm/s. Power density and interaction time were two parameters they used to compare trials where:
| Power density (Pd) = | ![]() |
and
| interaction time (It) = | ![]() |
The resulting welding parameters are shown in Table 1 below. Figure 1 shows the microstructure of the fusion boundary and HAZ on the DP600 side of the welded joint. Figure 2 shows the microstructure of the weld interface on the AA 6061 side. Figure 3 displays the hardness data with (a) representing 3.5 kW and 10 mm/s, (b) representing 3.5 kW and 8 mm/s, and (c) representing 4 kW and 8 mm/s. Figure 4 represents the Shear Stress-Strain of the welds given different IMC thickness.

Table 1: Welding Parameters.I-1

Figure 1: Weld Metal, DP 600 Base Metal and HAZ microstructure.I-1

Figure 2: Fe-Al interface microstructure.I-1

Figure 3: Microhardness Plot.I-1

Figure 4: Load vs. Displacement.I-1
