![Total Elongation]()
Mechanical Properties
Total Elongation to Fracture
Deformation continues in the local neck until fracture occurs. The amount of additional strain that can be accommodated in the necked region depends on the microstructure. Inclusions, particles, and grain boundary cracking can accelerate early fracture. Total elongation is measured from start of deformation to start of fracture. Two extensometer gauge lengths are commonly used: A50 (50mm or 2 inches) and A80 (80 mm).
In the past, limited automation and measurement equipment necessitated the use of a non-repeatable technique defined in ASTM E8A-24 and ISO 6892-1I-7 as “elongation after fracture.” Here, the operator attempts to position the two fractured strips back together and hand measures the distance between two gauge marks on the sample.
Tensile testing combined with data acquisition systems are much more commonplace today. According to ASTM E8, the elongation at fracture shall be taken as the strain measured just prior to when the force falls below 10 % of the maximum force encountered during the test. Both elastic strains and plastic strains are included in the measurement.

Figure 1 : Total elongation is measured from start of deformation to start of fracture.
![Total Elongation]()
Mechanical Properties
Forming forces need to exceed the yield strength for plastic deformation to occur and an engineered stamping to be produced. If a metal structure is loaded to a level below the yield strength, only elastic deformation occurs, and the load can be removed. With no permanent (plastic) deformation, the metal returns to its original shape.
On the stress-strain curve, yielding occurs where the initial linear region transitions to the non-linear portion. This transition does not occur always at a clearly visible well-defined point. Consistent yield strength measurement is facilitated by defining how this parameter should be determined. Two techniques are used when working with sheet metals. The most common method is to draw a line parallel to the modulus line at an offset strain of 0.2%. The intersection stress becomes what is defined at the “0.2% offset yield strength” (Figure 1). This value is referred to as Rp0.2. The second technique is drawing a vertical line at the 0.5% strain value until it crosses the stress-strain curve. This determines the “yield strength at 0.5% extension under load,” abbreviated as Rt0.5 (Figure 2). These techniques result in similar – but not identical – values for yield strength.

Figure 1: 0.2% offset yield strength, determined by offset of a line parallel to the modulus line by 0.2% strain.

Figure 2: Yield strength at 0.5% extension under load, determined by a vertical line offset from the origin by 0.5% strain
Some metals have yield point elongation (YPE) or Lüders bands. Deforming metal is locked in place by interstitial carbon and nitrogen atoms and other restrictive features of the microstructure. Load increases with little corresponding deformation – or put another way, stress increases with only an incremental increase in strain. The highest stress reached is known as the upper yield strength or upper yield point. Once a band of deformed (yielded) metal breaks free from being pinned by dislocations in the microstructure, the stress drops and there is an increase in strain. The lowest stress reached is known as the lower yield strength or lower yield point (Figure 3). The bands of deforming metal are known as Lüders bands, named after one of the people first observing the phenomenon. Lüders deformation continues at approximately a constant stress until the entire sample has yielded, and the sample begins to work harden. The total strain associated with this type of deformation is known as yield point elongation, or YPE. Stabilized, interstitial-free, vacuum degassed steel, such as ULC EDDS are not at risk of aging, and will not exhibit YPE. For those grades susceptible to YPE, leveling prior to sheet forming will minimize this tendency.

Figure 3: Defining upper yield stress, lower yield stress, and yield point elongation.
Since springback is proportional to the yield strength of the steel, knowing the yield strength allows some estimation of relative springback. Figure 4 compares mild steel, HSLA 700Y/800T, and MS 1500 AHSS having a 1400MPa yield strength. The relative magnitude of springback is indicated by the arrows shown on the horizontal axis, and reflects the increase of springback with yield strength.
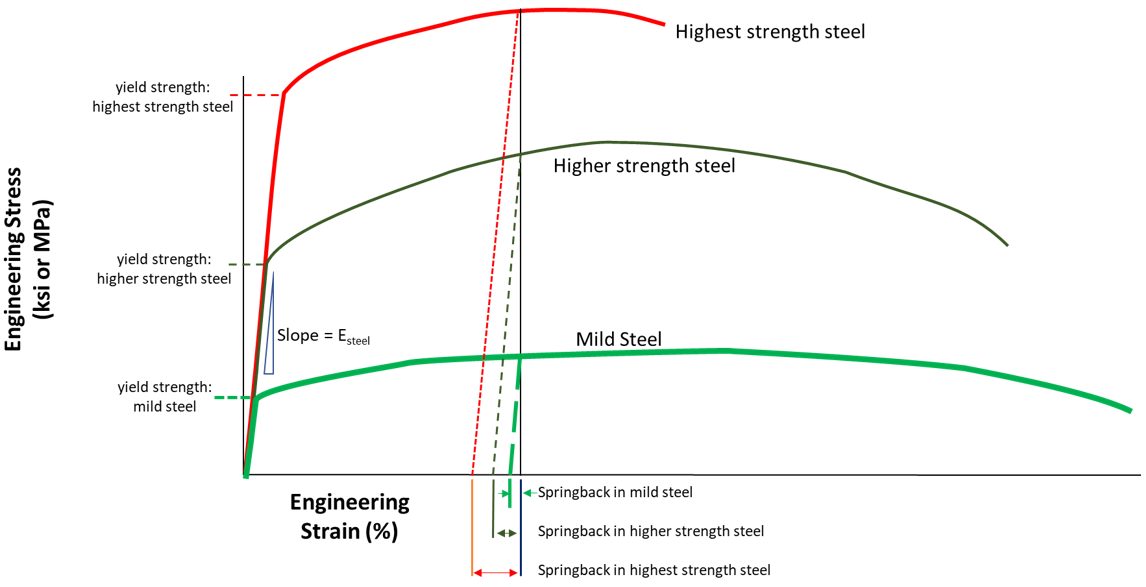
Figure 4: Springback is proportional to yield strength.
![Total Elongation]()
Mechanical Properties
Engineering stress-strain units are based on the starting dimensions of the tensile test sample: Engineering stress is the load divided by the starting cross-sectional area, and engineering strain is the change in length relative to the starting gauge length (2 inches, 50mm, or 80mm for ASTM [ISO I], JIS [ISO III], or DIN [ISO II] tensile test samples, respectively.)
Metals get stronger with deformation through a process known as strain hardening or work hardening. This is represented on the stress strain curve by the parabolic shaped section after yielding.
Concurrent with the strengthening as the tensile test sample elongates is the reduction in the width and thickness of the test sample. This reduction is necessary to maintain consistency of volume of the test sample.
Initially the positive influence of the strengthening from work hardening is greater than the negative influence of the reduced cross-section, so the stress-strain curve has a positive slope. As the influence of the cross-section reduction begins to overpower the strengthening increase, the stress-strain curve slope approaches zero.
When the slope is zero, the maximum is reached on the vertical axis of strength. This point is known as the ultimate tensile strength, or simply the tensile strength. The strain at which this occurs is known as uniform elongation.
Strain concentration after uniform elongation results in the formation of diffuse necks and local necks and ultimately fracture.
Figure 1: Tensile Strength is the Strength at the Apex of the Engineering Stress – Engineering Strain Curve.
![Total Elongation]()
Testing and Characterization
topofpage
Tensile testing characterizes the forming and structural behavior of sheet metals. The test involves loading a sample with a well-defined shape along the axis in tension, generally to fracture, and recording the resultant load and displacement to calculate several mechanical properties. Global standardsI-7, A-24, D-19, J-15 prescribe the conditions under which tests must occur.
Sample Size and Shape
Full-size samples for tensile testing of metal sheets have a rectangular section at the edges for gripping by the test machine. Reducing the width in the central area promotes fracture in the monitored region. These geometrical features result in a sample shape which resembles a dogbone, leading to a descriptive term applied to test samples.
Dimensions of the dogbone samples are associated with tensile test standard from which they apply. ISO I, II, and III (described in Citation I-7) corresponds to the ASTMA-24, DIND-19, and JISJ-15 shapes, respectively. Figure 1 shows the dogbone shapes, highlighting the critical dimensions of width and gauge length. Refer to the Test Standards for other dimensions, tolerances, and other requirements.

Figure 1: Full-size tensile sample shapes for ISO I (ASTM), ISO II (DIN), and ISO III (JIS) standards.I-7, A-24, D-19, J-15
Significant differences exist in the width and gauge length of these tensile bar shapes. Although the ASTM and JIS bars have similar gauge length, the width of the JIS bar is twice that the ASTM bar. The ASTM and DIN bars have a 4:1 ratio of gauge length to width, where the JIS bar has a 2:1 ratio.
These shape differences mean that the calculated elongation changes depending on the test-sample standard used, even when testing identical material. With the combination of the shortest gauge length and widest sample, elongation from JIS bars typically are higher than what would be generated from the other shapes.
Yield strength and tensile strength are not a function of the shape of the tensile bar. Strength is defined as the load divided by the cross-sectional area. Even though each of the bars specify a different sample width (and therefore different cross-section), the load is normalized by this value, which negates differences from sample shape.
Shearing or punching during sample preparation may work-harden the edges of the tensile bar, which may lead to generating an inaccurate representation of the mechanical properties of the sheet metal. Test Standards require subsequent machining or other methods to remove edge damage created during sample preparation. Milling or grinding the dogbone samples minimizes the effects sample preparation may have on the results.
Tensile Test Procedure
The gauge length is the reference length used in the elongation calculations. Depending on the test standard, the gauge length is either 2 inches, 80 mm, or 50 mm. Multiplying the width and thickness within the gauge length determines the initial cross-sectional area before testing.
Grips tightly clamp the edges of the sample at opposite ends. As the test progresses, the grips move away from each other at a prescribed rate or in response to the restraining load. A load cell within the grips or load frame monitors force. An extensometer tracks displacement within the gauge length. Samples are typically tested until fracture.
During the tensile test, the sample width and thickness shrink as the length of the test sample increases. However, these dimensional changes are not considered in determining the engineering stress, which is determined by dividing the load at any time during the test by the starting cross-sectional area. Engineering strain is the increase in length within the gauge length relative to the starting gauge length. (Incorporating the dimensional changes occurring during testing requires calculating true stress and strain. The differences between engineering and true stress/strain are covered elsewhere (hyperlink to 2.3.2.1-Engineering/True)
A graph showing stress on the vertical axis and strain on the horizontal axis is the familiar engineering stress-strain curve, Figure 2. From the stress-strain curve, numerous parameters important for sheet metal forming appear, including:

Figure 2: Engineering stress-strain curve from which mechanical properties are derived.
Influence of Test Speed
Conventional tensile testing is done at strain rates slow enough to be called “quasi-static.” These rates are several orders of magnitude slower than the deformation rates during stamping, which itself is several orders of magnitude slower than what is experienced during a crash event.
Stress-strain curves change with test speed, typically getting stronger as the speed increases. The magnitude of these changes varies with grade. Significant challenges exist when attempting to characterize the tensile response at higher strain rates. Improved equipment and data collection capabilities are among the required upgrades.
Influence of Tensile Test Equipment
Advanced High-Strength Steels (AHSS) may challenge older test equipment. The load and displacement response must reflect only the contributions of the sheet metal, and not be influenced by the load frame and other testing equipment. In much the same way that insufficiently stiff press crowns deflect when stamping AHSS parts, tensile test load frames may similarly deflect, resulting in inaccuracies in the load-displacement measurements.
Grip strength also becomes critical when testing AHSS samples. The high strength of the metal sheets requires more grip pressure to prevent sample slippage through the grips. Pneumatic grips and even some mechanical grips may not generate the necessary pressure. Hydraulically actuated grips may be necessary as the strength increases.
Back to the Top