High Strain Rate Testing
A dynamic tensile test was conducted to evaluate the mechanical properties of spot welds under automotive collision conditions. The actual tensile shear strengths of steel sheets with nominal tensile strengths ranging from 270 MPa to 780 MPa were investigated.
Visit our page on high strain rate testing to learn more about the equipment and testing challenges.
Test Method
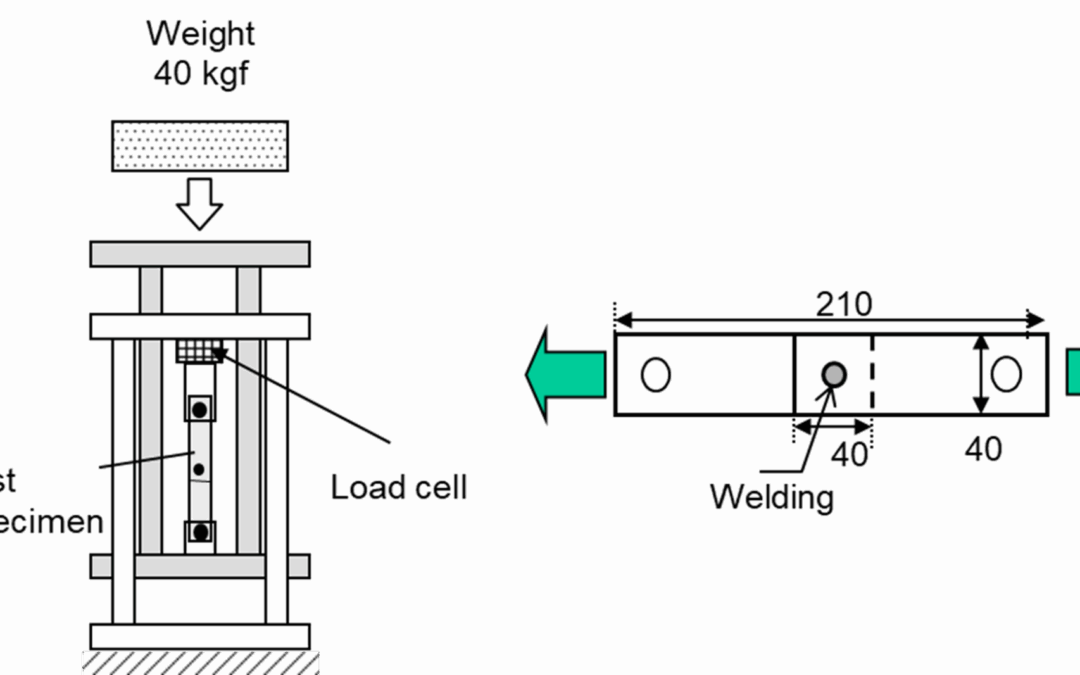
Figure 1 presents the dynamic tensile test machine and illustrates a schematic diagram of the tensile shear test specimen. A 1.6 mm thick steel sheet was placed on top of the tensile shear test specimen and spot welded, with nugget diameters of 5.5√t (7.0 mm) used for both. In the dynamic tensile test, a cone was dropped at high speed onto the specimen to apply a tensile load and determine the breaking point. The tensile speed was adjusted by varying the drop height of the cone, with a maximum speed of 2.4 m/s. For comparison, a static tensile test was conducted at a tensile speed of 1.6 × 10⁻⁴ m/s.
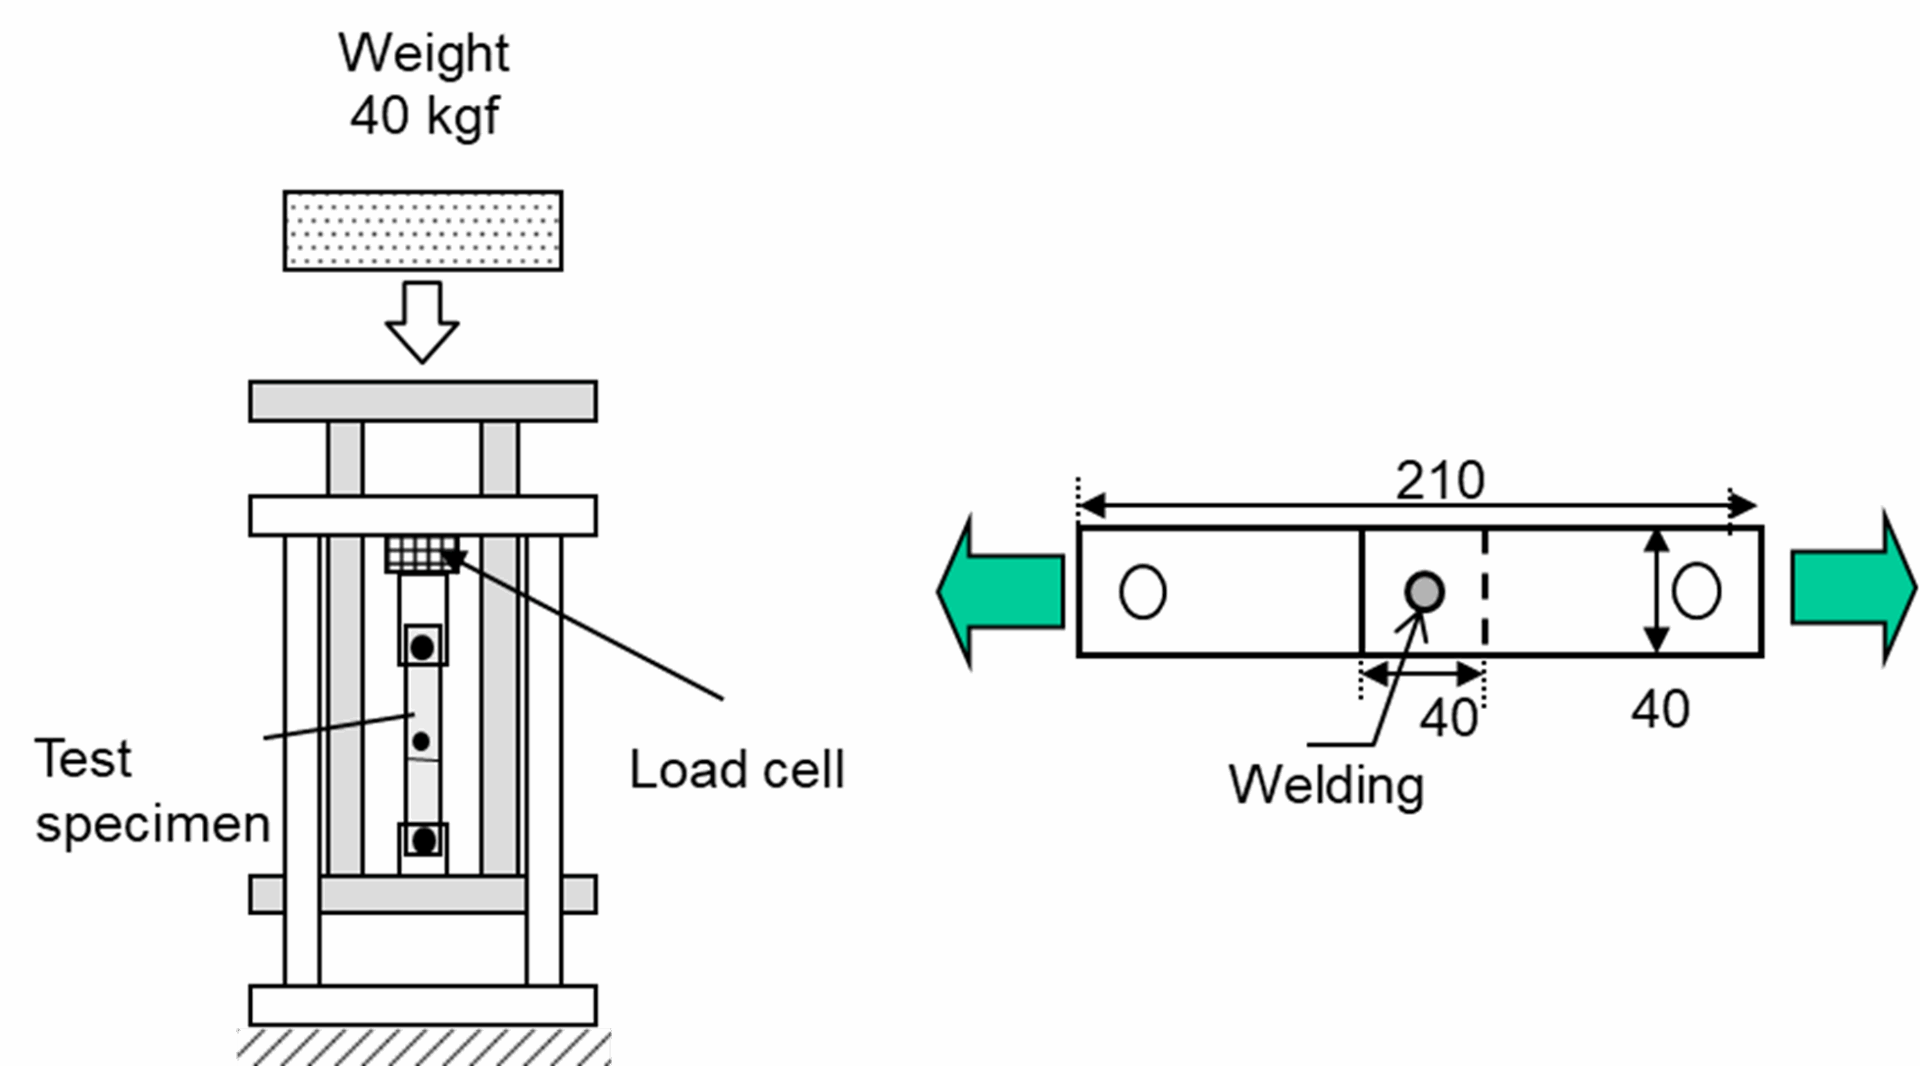
Figure 1: Dynamic tensile shear test equipment (left) and test specimen (right)
Results
Figure 2 shows the relationship between tensile shear strength and tensile speed for the steel sheet with a rated tensile strength of 590 MPa. Tensile shear strength tended to increase with tensile speed, with values of approximately 22 kN and 25.5 kN under static and dynamic loading conditions, respectively. All specimens exhibited plug fracture as the failure mode
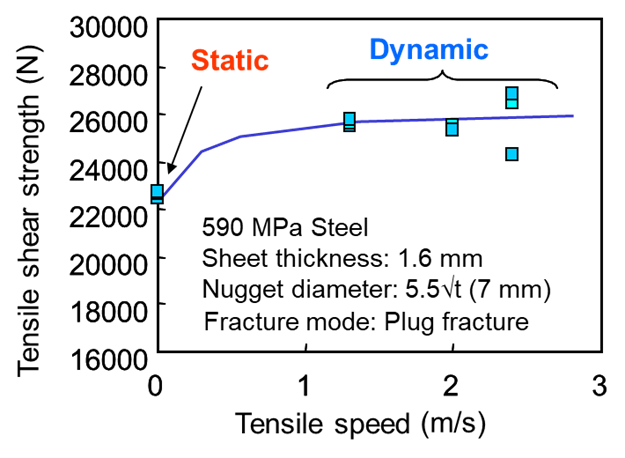
Figure 2: Relationship between tensile shear strength and tensile speed (steel sheet with a rated tensile strength of 590 MPa)
Figure 3 illustrates the effect of the tensile strength of the base material on the rate of increase in dynamic strength relative to static strength. Plug fracture remained the consistent failure mode across all cases. For the steel sheet with a rated tensile strength of 270 MPa, dynamic strength increased by approximately 60% compared to static strength. In contrast, the sheet with a rated tensile strength of 780 MPa showed an increase of only about 14%. These results indicate a tendency for the rate of increase in dynamic strength relative to static strength to decrease as the rated tensile strength of the steel increases. This is consistent with the general trend of mild steel strength increasing with strain rate, while strain rate sensitivity diminishes for higher-strength steels.
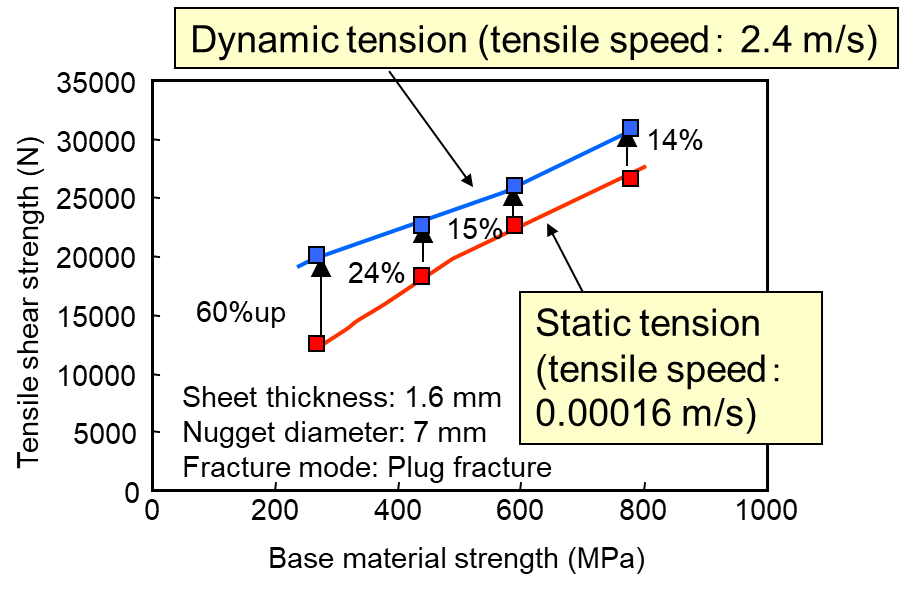
Figure 3: Relationship between dynamic and static tensile shear strengths of spot welds and base material strength
Source
Dynamic Tensile Shear Strength of Spot-Welded Joints: Experimental Investigation and Results Hiroki Fujimoto, Welding & Joining Research Laboratories, Nippon Steel Corporation