Fracture Toughness Characterization using the Essential Work of Fracture Method
The complex shapes of automotive stampings lead to die designs and processing that may challenge the inherent formability of the selected sheet metal grade.
Traditional grades, especially those of lower strength, fail from insufficient necking resistance for the chosen application. Characterization of the resistance to necking instability, sometimes referred to as global formability, is done with the strain hardening exponent (n-value), true uniform strain, and the Forming Limit Curve. Since these parameters can be mathematically described, forming simulation packages can accurately estimate the risk of necking and subsequent splitting.
Contrast this with newer grades where the sheet metal may still fail from insufficient necking resistance, but may also fail from fracture initiating at cut edges or tight bends. This fracture-limited formability, sometimes called local formability, can be influenced by many parameters – including both inherent material characteristics as well as the processing conditions used to create the cut edge (hole diameter, clearance, punch geometry, and so on) or bend (inside bend radius divided by the thickness, r/t). The inherent material characteristics contributing to this failure mode are not directly related to strength and elongation determined from traditional uniaxial tensile testing. Forming simulation packages have challenges estimating the risk of fracture-limited formability, since the full mathematical representation of the contributing factors does not yet exist.
To date, hole expansion testing is the most common way to characterize the edge stretchability of a particular sheet metal. The typical test procedure, prescribed by ISO 16630, requires a 10 mm diameter hole punched with a 12% clearance to be expanded with a conical punch having a 60° apex angle. Unfortunately, changing the testing conditions like the hole diameter, clearance, punch shape, or crack detection method has a significant influence on the results, to the point that any relative performance ranking of different products can change between the defined laboratory test conditions and the real-world performance.
Local fracture strain measurements from uniaxial tensile specimens, like true fracture strain, true thickness strain, or the reduction of the cross-section area at fracture, are also used to quantify fracture performance, and may offer better guidance for crash performance prediction.L-21, L-69 The bending angle measured from 3-point bending test according to VDA 238-100 or the fracture strain in plane strain tension obtained from these tests, are also effective in predicting bending-dominated failure that occurs with AHSS grades during folding/bending in axial and side crash tests. The bending angle and fracture strain determined in a 3-point bend test conducted according to VDA 238-100 correlates with the folding and bending seen in vehicle crash testing. However, these parameters individually are not sufficient to characterize overall fracture behavior and therefore cannot be used as a singular failure criterion that is applicable to all situations.
Fracture Toughness
Fracture-limited formability is dependent on the sheet metal’s resistance to crack nucleation and propagation, which are the two parameters influencing fracture toughness. As such, approaches have been investigated to experimentally assess the relationship between fracture toughness and cracking resistance of advanced steels.
Conventional toughness estimations based on the product of tensile strength multiplied by the total elongation to fracture (TS * TEL) or the area under the stress-strain curve are not suitable to describe the fracture toughness of AHSS. Use of these shortcuts may lead to an incorrect fracture toughness ranking when considering multiple materials: consider the comparison of 980DP vs. 980CP. The dual phase steel has greater elongation to fracture and greater uniform elongation, yet the complex phase steel has better edge ductility and fracture toughness. Tensile fracture parameters, such as the true fracture strain (εf) or the product of fracture stress and true fracture strain (σf × εf), give a better estimation of toughness at cracking initiation. However, these approaches can underestimate the crack propagation resistance of the material. To avoid misleading conclusions about the cracking resistance of high strength sheet metals, fracture toughness must be measured within the framework of fracture mechanics.F-43
Fracture toughness is defined as the energy spent in the creation of two surfaces at the crack tip that leads to crack propagation. Traditional approaches to study fracture toughness include J-integral and Crack Tip Opening Displacement (CTOD) measurements, but these evaluations do not apply to thin-gauge materials such as those used in automotive body construction. Alternative approaches appropriate for sheets below 3 mm thickness are relatively complex, involve detailed specimen preparation, and require measurement of the advancing crack during the tests.
Essential Work of Fracture Methodology
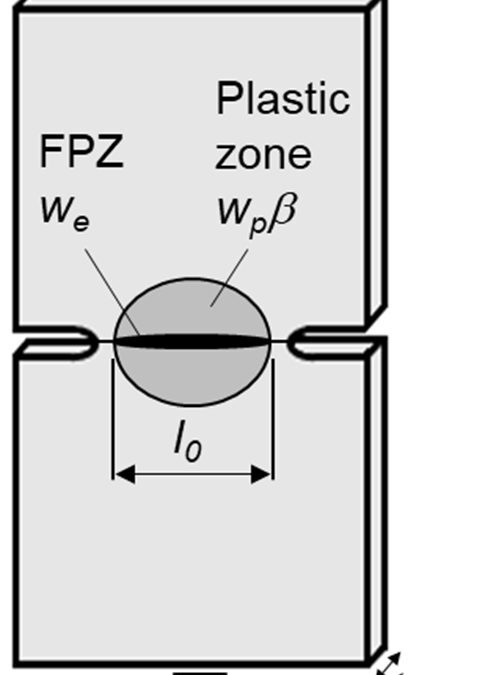
To address these challenges, a methodology based on the Essential Work of Fracture (EWF) appears to offer a simpler solution for measuring the fracture toughness of thin metal sheets. The method described below has been validated in industrial applications using both steel and non-steel sheet metals. The Double Edge Notched Tensile (DENT) specimen is used for this characterization (Figure 1). Since only tensile transverse stresses exist between the notches, and the geometry avoids the risk of buckling.
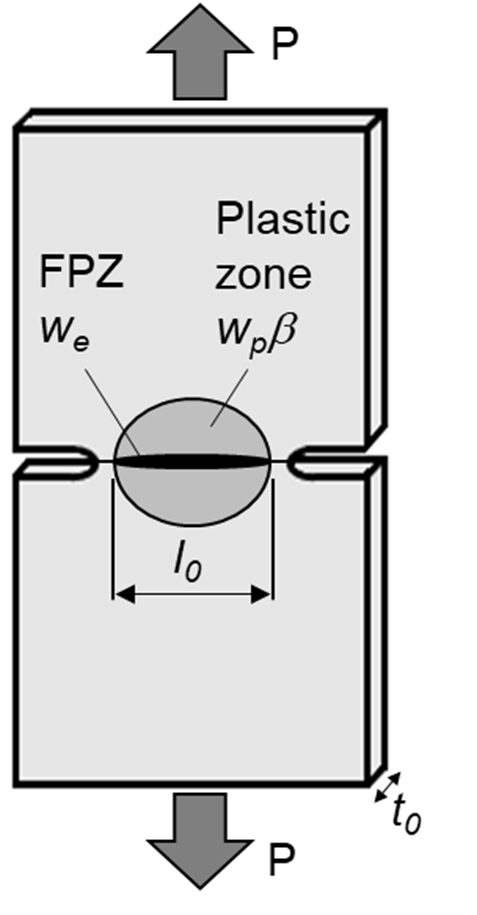
Figure 1: The Double Edge Notched Tensile (DENT) specimen is used for Essential Work of Fracture characterization.
In the DENT specimen, all of the deformation takes place in and around the notched ligament, allowing for separation of the total fracture energy, Wf, into its two components:
a) We, the essential work of fracture that is related to damage and the work to create new surfaces in front of the progressing crack tip. This value is proportional to the fractured area.
b) Wp, the plastic work dissipated in the region surrounding the crack tip as a consequence of plastic deformation. This value is proportional to the deformed volume, which is a function of the sample size, geometry, and loading mode.
Mathematically, the total fracture energy may be represented by:
Wf = We + Wp Equation 1
These parameters can be further characterized.
We = we*l0*t0, where we is the essential work of fracture per unit area, l0 is the ligament length between the two notches, and t0 is the specimen thickness.
Wp = β*wp* l02*t0, where wp is the plastic work per unit volume and β is a shape factor that is a function of the shape of the plastic zone.
Substituting these into Equation 1 gives
Wf = we*l0*t0 + β*wp* l02*t0 Equation 2
Normalizing each side of Equation 2 by the fractured area l0*t0 produces wf, the fracture energy per fracture area:
Wf/ l0*t0 = wf = we + β*wp* l0 Equation 3
This procedure enables the separation of the specific essential work of fracture, we , and the non-essential plastic work, wp, from the total energy of fracture by using a simple data reduction method. A series of specimens with different ligament lengths are tested to fracture. The fracture energy per fracture area, wf, is then calculated by integrating the area under the load-displacement curve and normalizing by the cross-section area (wf= Wf /l0*t0) . . By plotting the series of wf values as a function of ligament length l0 as shown in Figure 2, then we and β*wp can be obtained by linear regression with we being the vertical axis intercept of a line with slope β*wp. It is relevant to keep in mind that this method to obtain we is a purely mathematic procedure to remove the non-essential plastic contribution to the fracture energy, i.e. it does not mean that we is the value of wf at zero ligament length. To guarantee data linearity and the validity of the energy partitioning concept, different validity criteria must be met.T-49
The parameter we is a thickness-dependent material constant representing the plane stress fracture toughness of the material. Since it is obtained from a dataset of energy values for the complete fracture, it contains energetic contributions from both crack initiation and propagation resistance.
For each of the specimens tested with different ligament length, the work of fracture at crack initiation (wfi) is obtained from integrating the area under the load-displacement curve up to the point of crack growth initiation. This point has to be experimentally verified and generally it is around the peak values of the forces versus displacement curve. Since wfi is independent of the ligament length, the specific essential work for fracture initiation, wei can be calculated from an average of wfi values. This is also shown in Figure 2.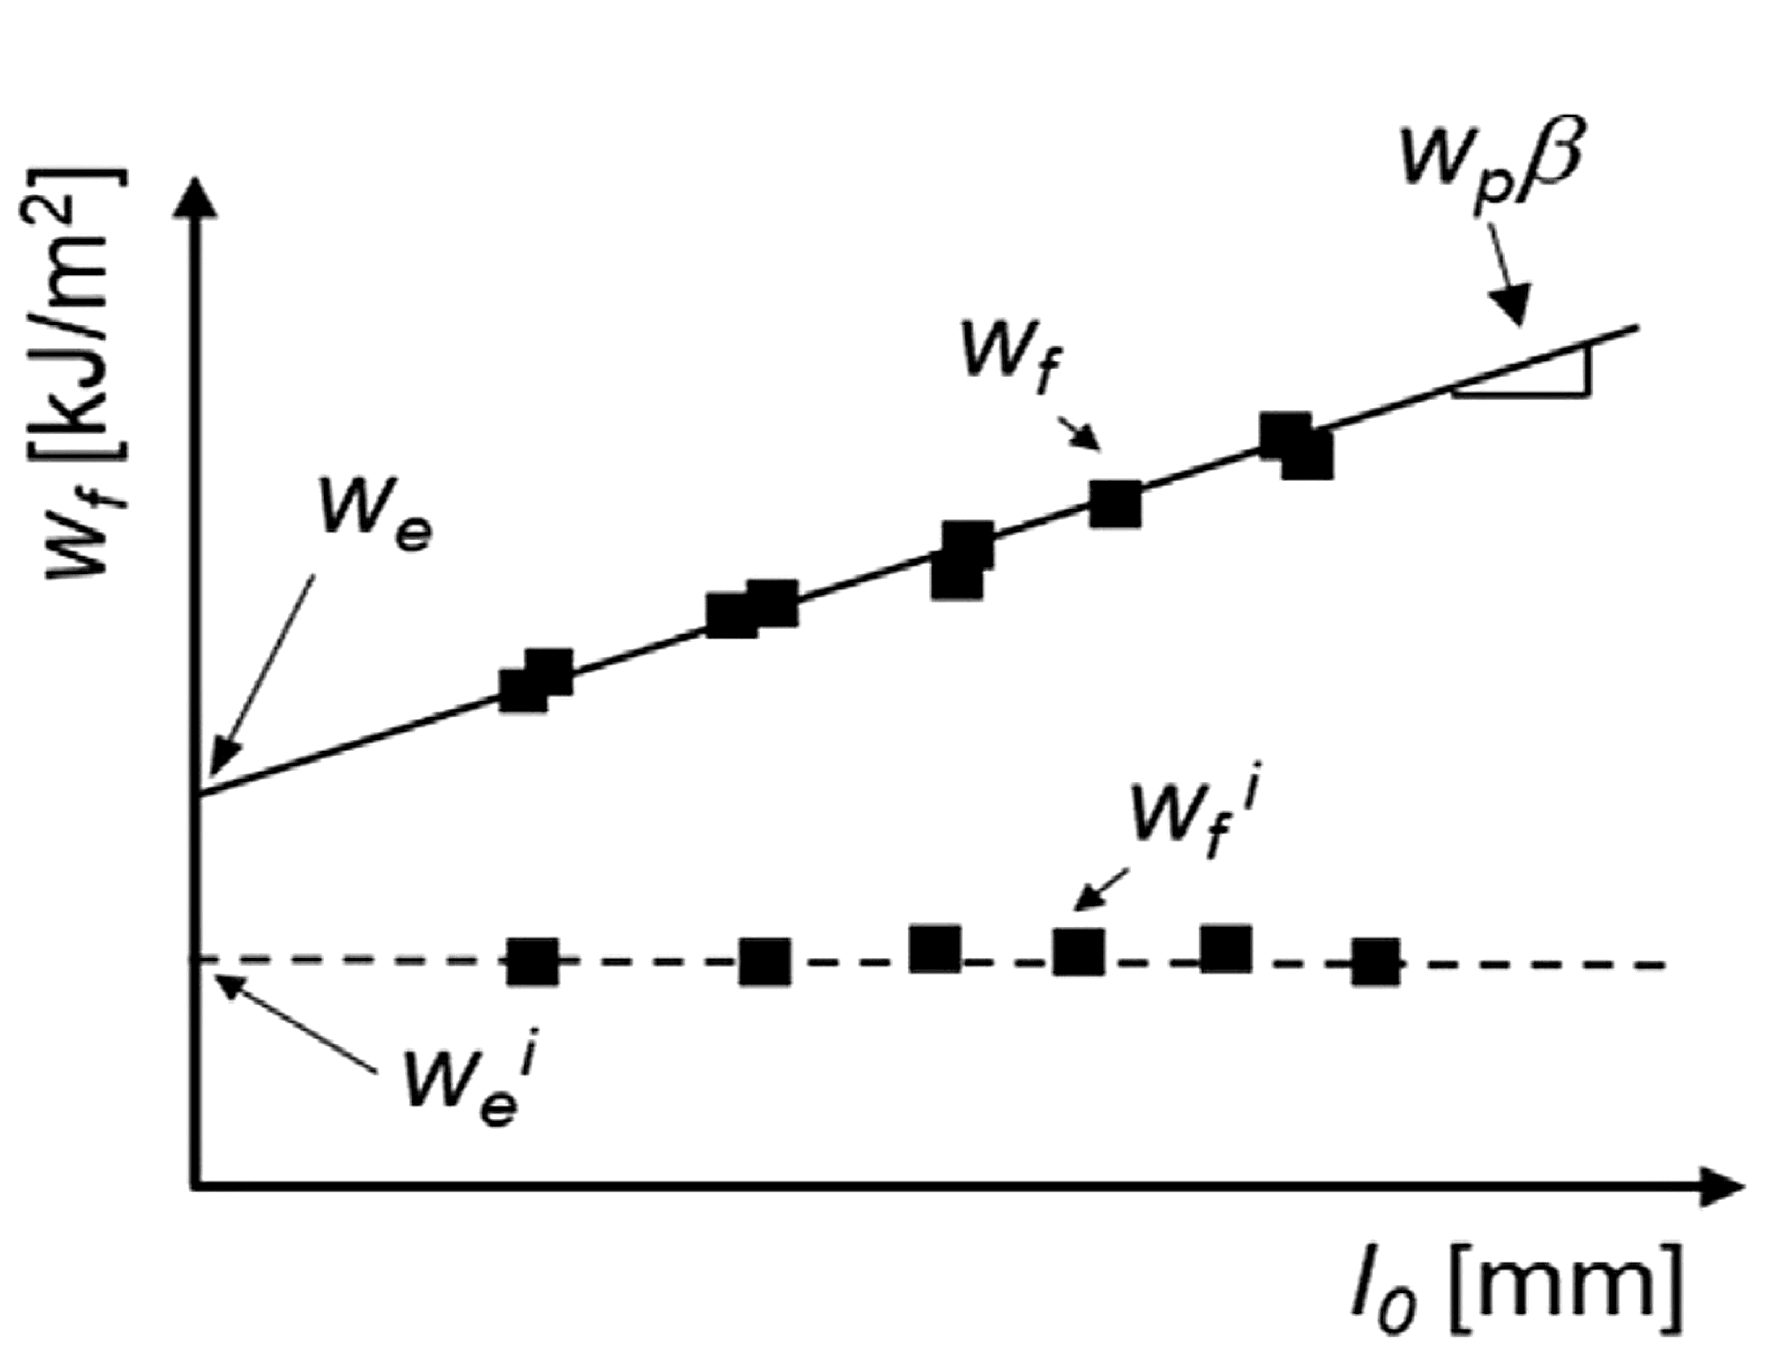
Figure 2: The specific essential work of fracture, we, is the vertical axis intercept in the plot showing the relationship between the specific total work of fracture, wf, and the ligament length. The specific essential work of fracture initiation, wei, is the average of the values of the specific work of fracture at initiation of propagation, wfi.
Figure 3 shows the specific essential work for fracture (we) and specific essential work for fracture initiation (wei) for several advanced high strength steels. The differences between these parameters vary between the grades. For some grades, the markers fall nearly on top of each other, and for these, there is only a small contribution from crack propagation resistance once the crack initiates. For other grades, including complex phase steels and the enhanced-ductility PHS grade, the crack propagation resistance is a significant portion of the overall fracture toughness.
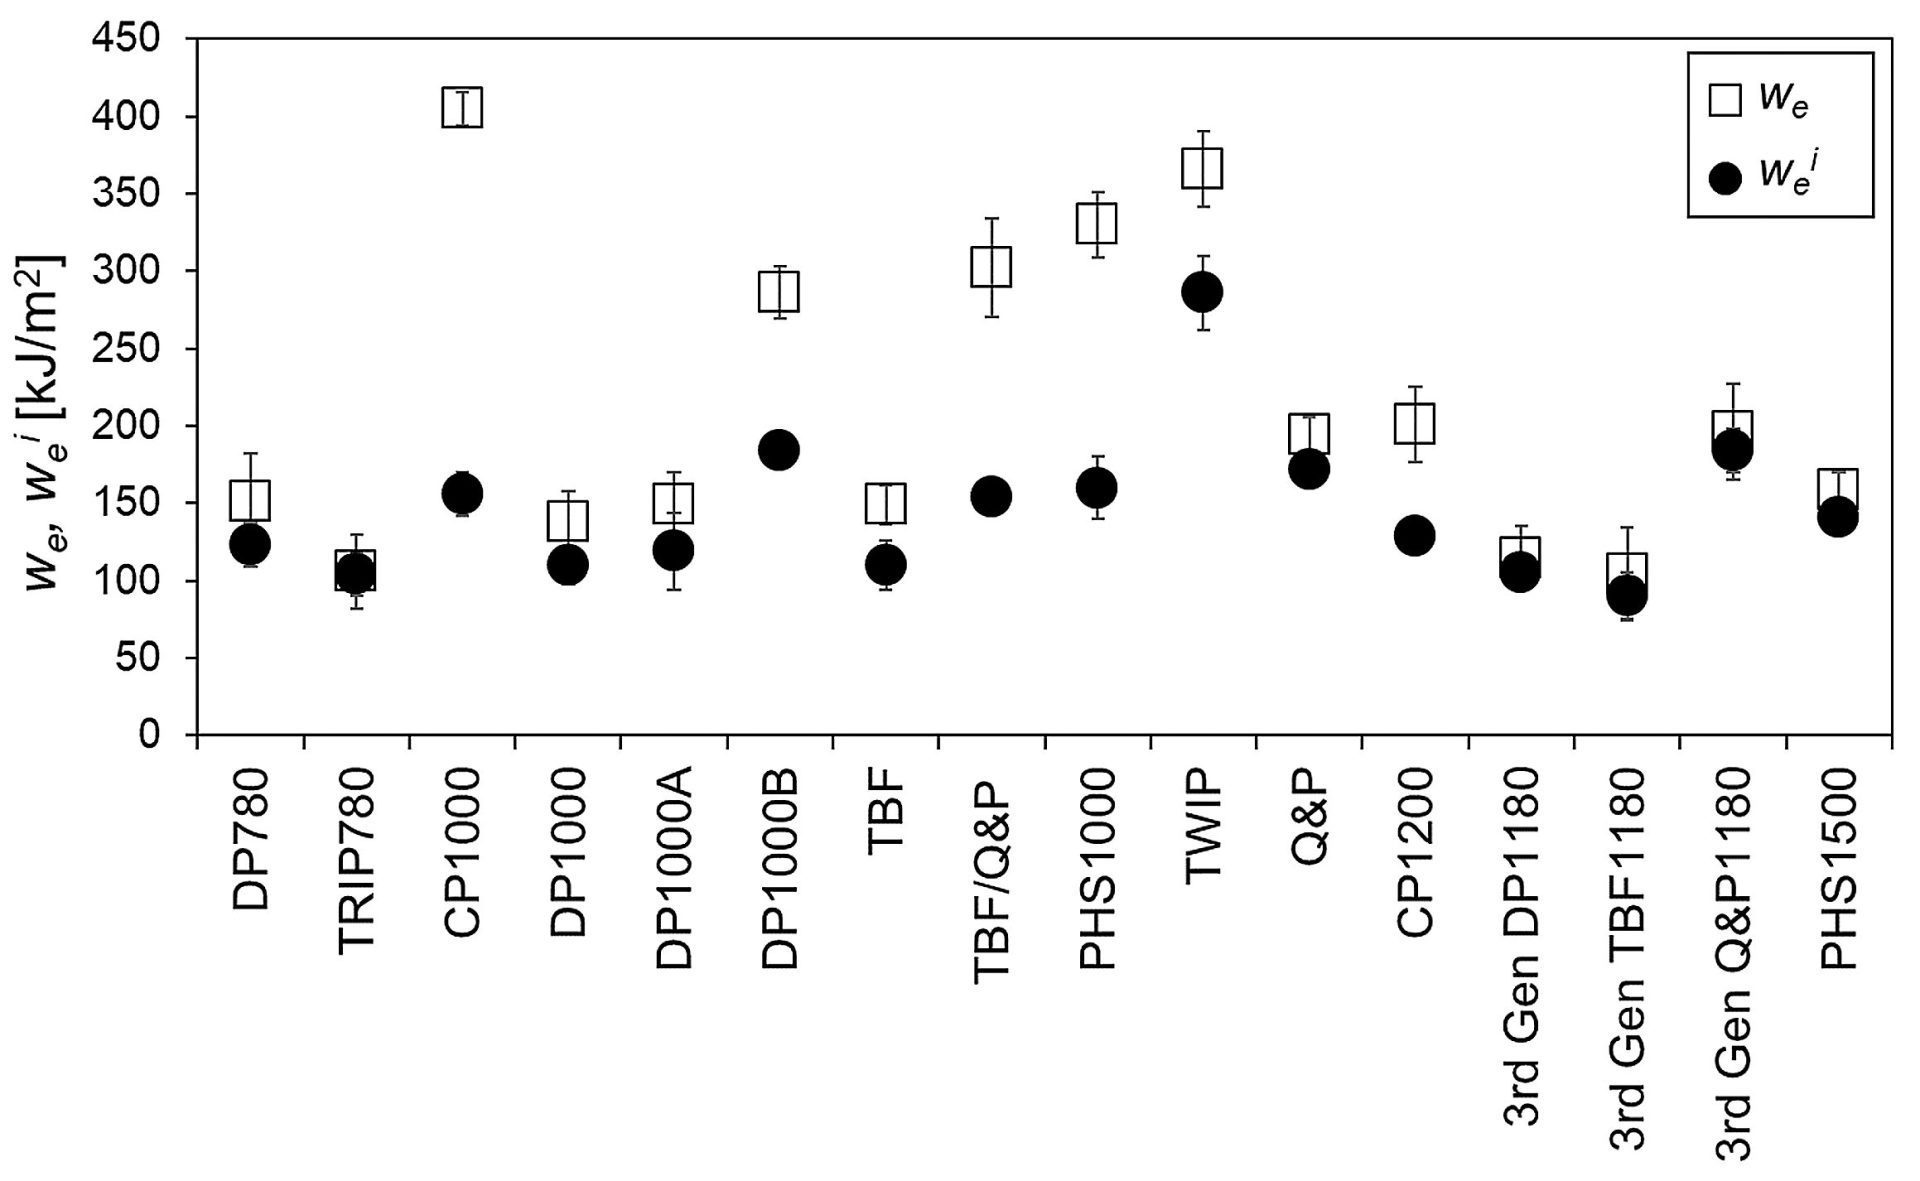
Figure 3: we and wei for several advanced high strength steels. F-44
Notch root radius has a significant influence on EWF measurements. To obtain accurate and reliable fracture toughness values pre-cracked samples must be used. Alternative methods, including fatigue pre-cracking, notch sharpening by a razor blade or mechanical sharp notching with a specific tool, may be used for that purpose. ASTM E399 lists a procedure to nucleate a fatigue crack at the notch rootA-81, as does ASTM E1820A-82. These approaches are relatively costly and time consuming. To address these concerns, a device consisting of a two-pillar modular cutting die and beveled punch was developed to shear sheet specimens in such a manner to introduce crack-like sharp notches.F-45, E-15 Without these efforts to generate an exceedingly small notch radius, the measured toughness values can overestimate the real crack initiation and propagation resistance of the material.F-43
Following the definition of the specific essential work of fracture we , the resistance to crack propagation, it is the material property to address crack-related problems in sheet metal forming, as edge cracking, or to account for part performance when cracks are involved, as in crash resistance tests. In this regard, there is good experimental correlation between the we and the hole expansion ratio for a wide range of AHSS families, as shown in Figure 4. As discussed above, although similarities exist in the fracture mechanisms involved in both tests, the hole expansion ratio is not a material parameter since it depends on several experimental factors such as the hole geometry, edge preparation method, and crack detection method. These choices lead to increased variability of results generated at different labs. Aside from thickness, we is a material property that represents more accurately the sheet steel’s crack propagation resistance. Based on experimental observations a value of we larger than 250 kJ/m2 would be recommended when edge cracking may appear in sheet forming. On the contrary, values lower than 125 kJ/m2 may jeopardize the stamping process.
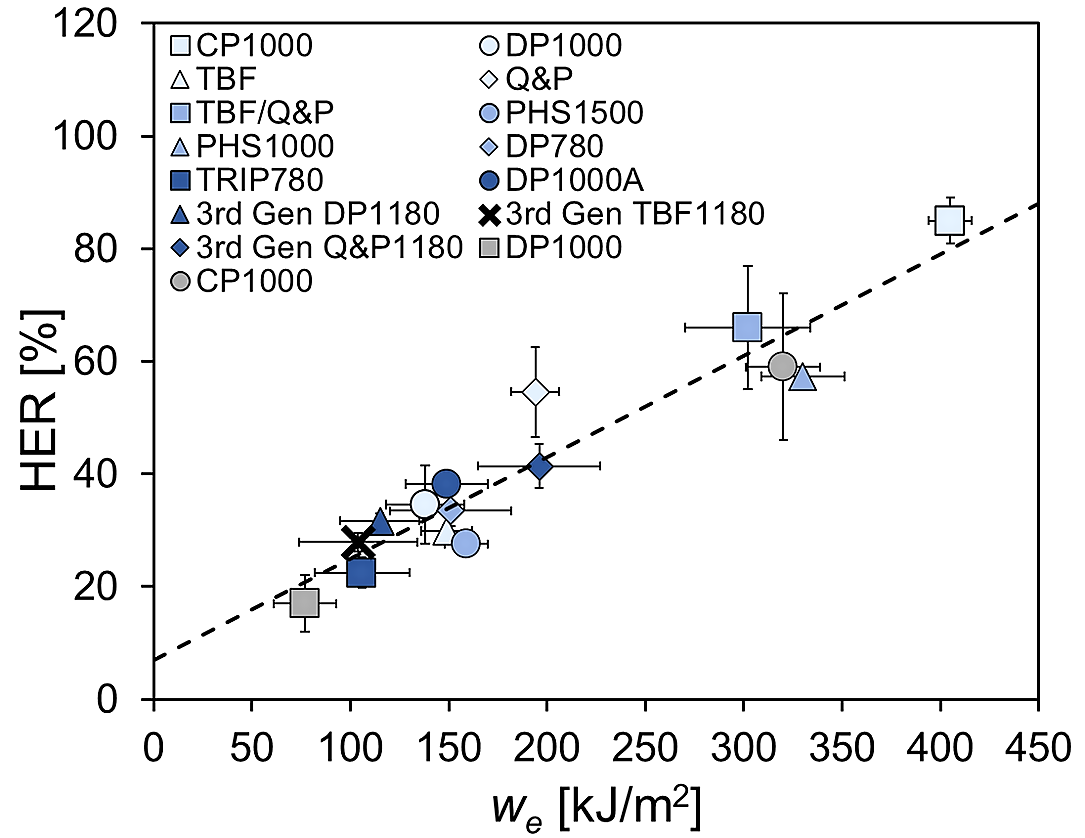
Figure 4: Correlation between we and hole expansion ratio (HER), based on data in Citations F-44, F-46
Crash resistance can be also assessed through the values of the we. In AHSS the appearance of cracks during crash tests ranks crash resistance, so high cracking resistance steel leads to high crashworthiness. The energy absorbed by a component linearly increases with the specific essential work of fracture of the steel used to form the component (Figure 5), making we a good candidate to provide useful information in assessing crashworthiness.F-47
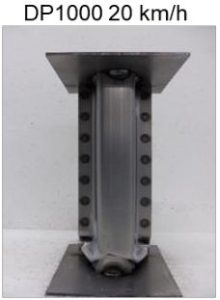 Figure 5a. Crash box made from DP1000 can absorb only limited energy before fracture. F-44 |
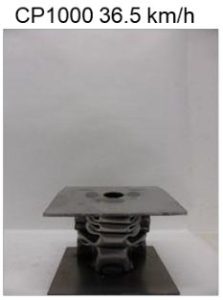 Figure 5b. Crash box made from CP1000 can absorb more energy before fracture.F-44 |
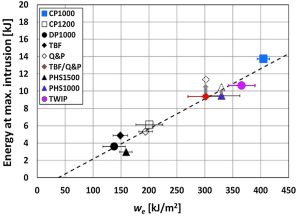 Figure 5c. Energy absorbed at maximum intrusion as a function of the specific essential work of fracture for several advanced steels.F-47 |
Local Formability Diagrams such as the ones shown in Figures 3 and 4 of the Defining Steels page give the user an indication of how a chosen grade might perform in applications requiring fracture resistance, such as those inducing expansion of cut edges during forming. Knowledge of the Essential Work of Fracture offers another representation, as reproduced in Figure 6.F-46 Figure 7 shows a similar representation having tensile strength on the horizontal axis, which is the same format as the conventional Global Formability Diagram.F-48
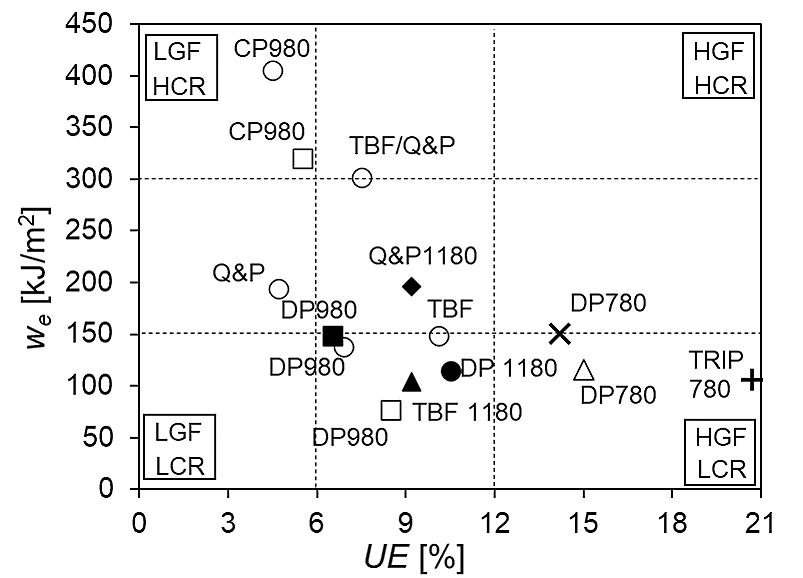
Figure 6: AHSS classification based on uniform elongation (UE, as an indicator of global formability) and fracture resistance (we). LGF low global formability, LCR low cracking resistance, HGF high global formability, HCR high cracking resistance.F-46
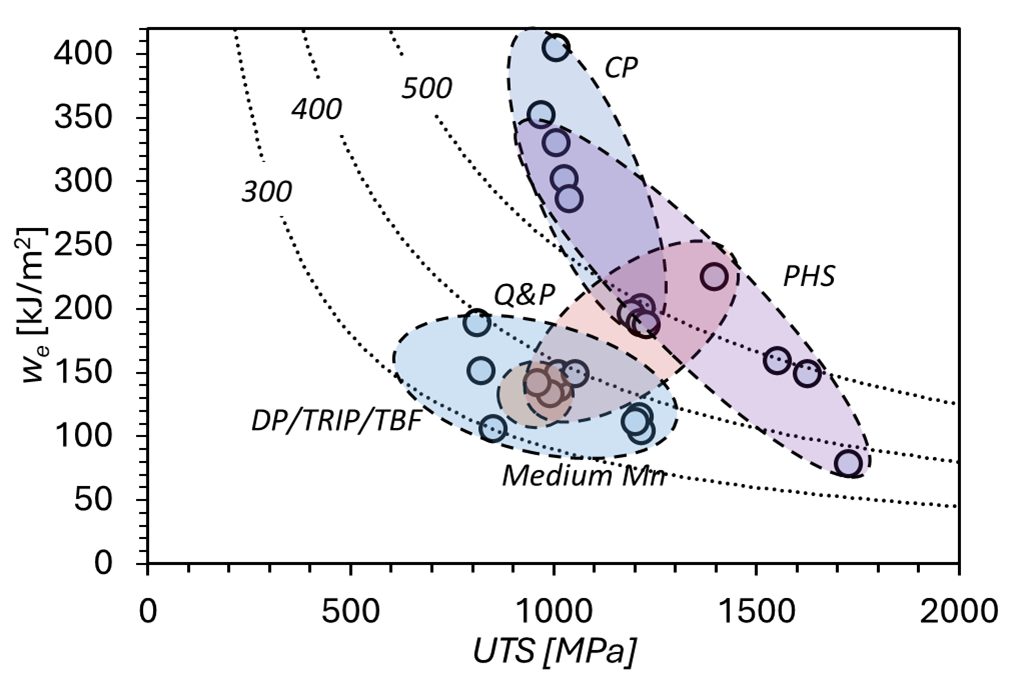
Figure 7: Fracture resistance (we) as a function of tensile strength (UTS) for several Advanced High Strength Steels.F-48
Additional information about the Essential Work of Fracture methodology and its application in fracture toughness, cracking resistance, crashworthiness assessments, User Guidelines, and case studies can be found at https://toughsteel.eu/ as well as Citations C-37, C-38, and C-39.
Thanks are given to David Frómeta and Daniel Casellas of Eurecat for their assistance in preparing this page.